Square
Following
Hot
News
Profile
Share your thoughts
placeholder
Article
Gm everyone ☀️
post-image
$FET took me through a trade like this: the hardest part is knowing when to exit.
This feels like a good spot. Close the position right here. Watching these two today: $SO and $BAT .
post-image
FET+4.90%
BAT+28.31%
GOLD 🥇
live-cover
LIVE377
Everyone watching SYMBOL long is about to get blindsided by a sharp drop.

$MU /USDT - SHORT

Trade Plan:
Entry: 927.98 – 934.84
SL: 964.38
TP1: 906.68
TP2: 890.19
TP3: 865.47

Why this setup?


Debate:
Are we testing TP2 or is 994.50 about to flip this setup?

⚠️ Personal market analysis only. NFA — manage risk and DYOR.
Educational content, not investment advice or a recommendation to buy, sell, deposit, or withdraw any asset. No paid promotion or referral/affiliate links.
MU+2.12%
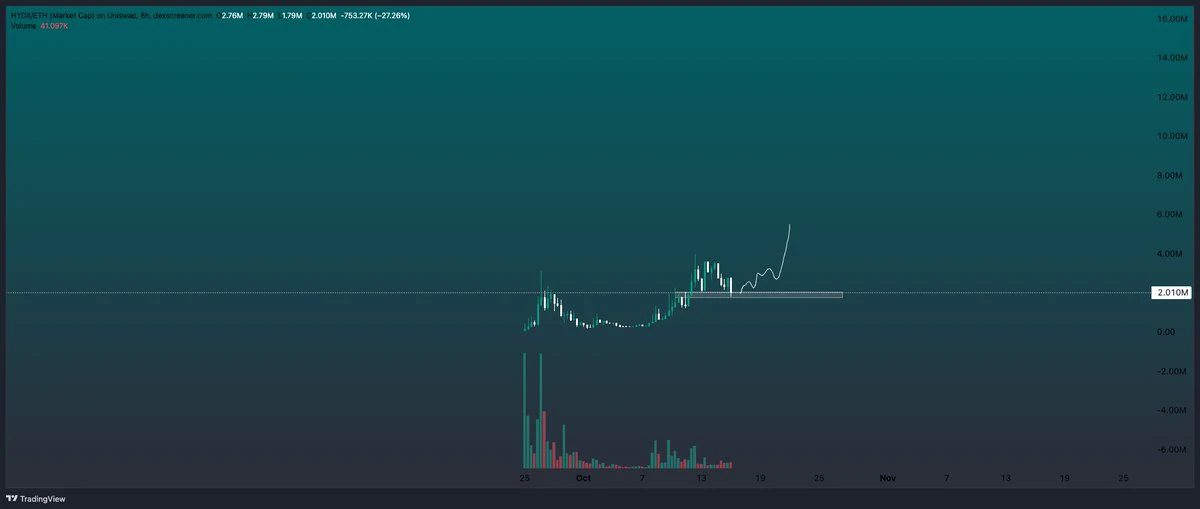
$HYDX looks great here. The market caused lot of quality RH plays to fall a bit but despite that holding pretty good strength overall. Many projects bouncing so I expect HyperDex too here eventually.
post-image

ZEC moved lower intraday from around 1116, falling all the way to a low of 1074.66 before staging an oversold rebound, surging to 1246.91. The larger-cycle downtrend structure remains intact, so a rebound into the resistance zone presents an opportunity to short.
From the chart perspective, the long-term downtrend structure on the daily timeframe remains intact. This recovery is merely a correction during the decline, while the dense overhead trapped positions will create strong resistance.
On the 4-hour timeframe, consecutive large bullish candles have driven prices sharply higher in a short
post-image
ZEC+8.92%
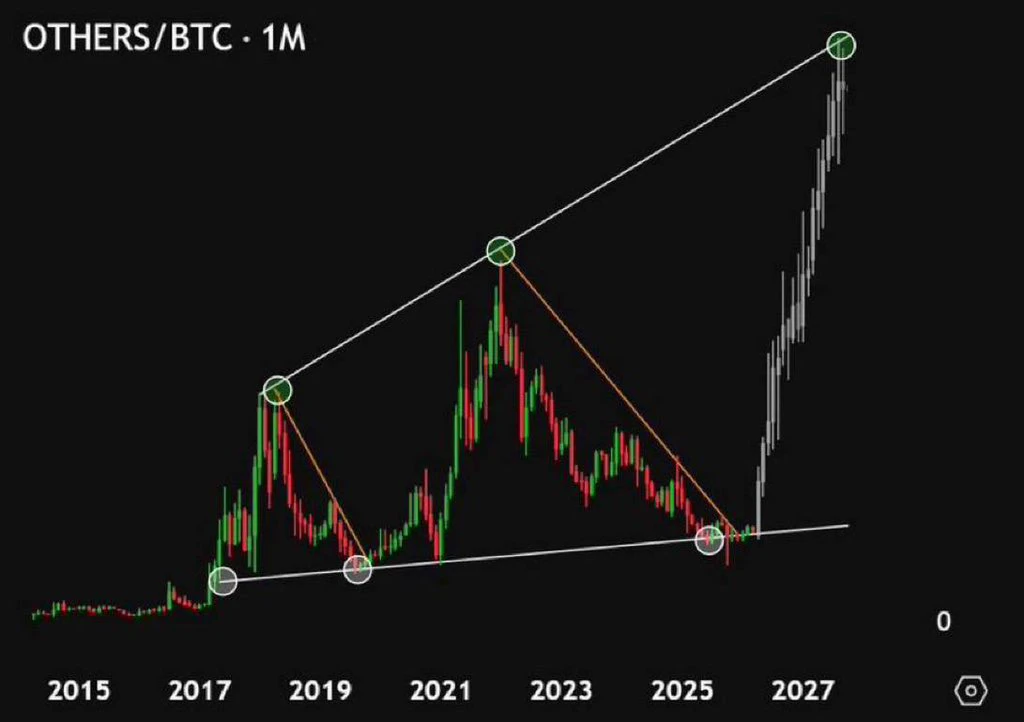
Biggest #Altseason starts any day now.
GET READY 🚀
post-image
Bitcoin Mining Stocks Plunge: 4 Major Firms Lose Over 12% in One Day
Bitcoin miners took a severe hit on Wednesday as higher-than-expected US inflation data triggered a broad selloff across tech and AI stocks.
TeraWulf fell 12.64%, Core Scientific dropped 12.44%, Cipher Mining declined 12.35%, and IREN lost roughly 12.2% in a single session.
⚠️ Personal market analysis only. NFA — manage risk and DYOR.
Educational content, not investment advice or a recommendation to buy, sell, deposit, or withdraw any asset. No paid promotion or referral/affiliate links.
post-image
CORZ+7.03%
IREN-0.55%

Intraday, Ethereum pulled back toward around 2480, hitting a low of 2322 before recovering and rebounding, but the broader bearish trend remains unchanged. The rebound is only a brief bounce during the decline, with clear overhead selling pressure.
From the current chart, the main bearish structure on the daily timeframe remains intact. This rebound is merely a brief recovery after the rapid dip, while MACD remains bearish.
On the 4-hour timeframe, the price has risen close to the upper Bollinger Band, while bullish momentum is gradually fading and the rebound is weakening. On the 1-hour timef
post-image
ETH+1.29%
( new streamer) market overview
live-cover
LIVE269
With the same 1,000U, some people doubled their money on $STRK last night, while others rushed in at today’s open and got trapped at the top. Which outcome would you choose?
Let’s look at the data first. $STRK is currently at 0.0881, up 14.3% in 24 hours, with a high of 0.0988, a low of 0.0717, and $465 million in trading volume. What does that mean? An intraday range of 38%, with trading volume several times the circulating market cap. This isn’t an ordinary rally—it’s a meat grinder for bulls and bears.
Bullish logic: STRK’s current move started around 0.07, with genuine volume coming in rat
STRK+16.15%
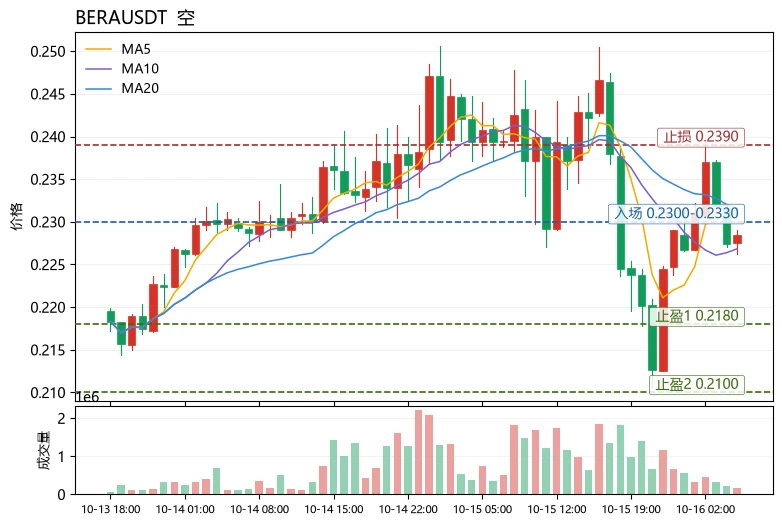
Many people see the funding rate turn positive and MACD turn green and automatically assume “the bulls are back,” then chase in with oversized positions—this is the most common position-sizing mistake: treating indicator direction as an entry signal while ignoring the moving-average structure and volatility levels. $BERA is a textbook example of this trap.
First, the structure: current price 0.2284, MA5=0.2311 remains below MA20=0.231595, and the short-term moving average has not crossed above, meaning the bearish alignment has yet to be repaired; RSI=47.3 is stuck in the neutral-to-weak zone
post-image
BERA-6.12%
Continue adding to long positions on $DASH here. 💪Entry range: 49.57 - 49.82Target profit 1: 52.10Target profit 2: 54.02Invalidation level: 48.08DASH is showing strong recovery momentum and has reclaimed the 1-hour MA99 resistance at 50.01. The 15-minute chart remains clearly bullish above the MA7 and MA25, so the current setup favors an attempted breakout, targeting the 50.50 liquidity zone. Trade 👇👇👇 hereHot coins: $SIREN : Current price 0.03206 - 24-hour gain: +44.09%$SOL : Current price 105.91 - 24-hour gain: +1.07%
post-image
DASH+2.02%
SIREN+5.45%
SOL+1.16%

Intraday, Bitcoin’s rebound faced resistance and the bearish outlook remained clear. After rebounding to around 81700, it fell all the way, with the low reaching around 79800—the move was once again nailed perfectly!
From the current chart, the rebound after the previous sharp daily decline was merely a technical recovery. Selling pressure above remains heavy, MACD continues to maintain a bearish structure, rebound momentum is gradually fading, and the major trend remains unchanged. A rebound is an opportunity to short.
On the 4-hour chart, this rebound is a recovery bounce following the decli
post-image
BTC+0.47%
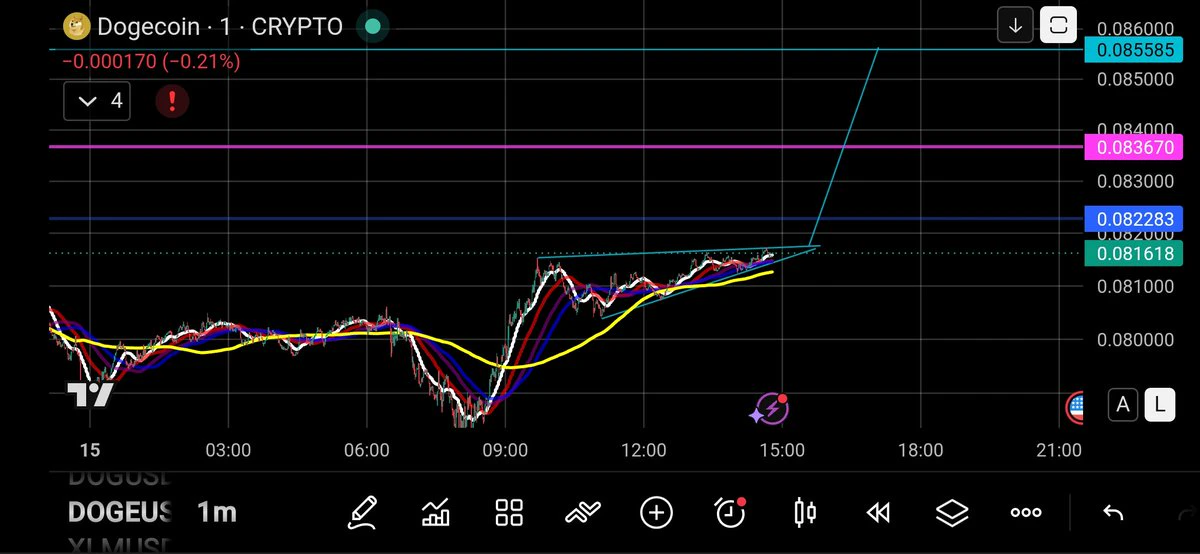
$DOGE About To Make Some Gains!?
Just locked into a long on $DOGE!
NFA, DYOR ⚠️
#Crypto #Trading #DOGE
post-image
DOGE-0.46%
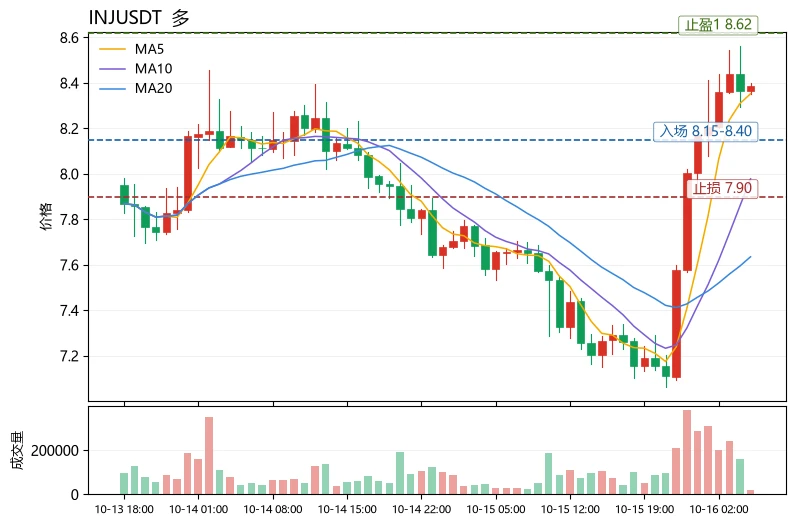
Who is truly leading the gains in the same sector? The answer points to $INJ
.
A horizontal comparison makes it clear: $INJ rose 10.92% over 24h, with a trading volume of 24.0M USDT, while $JTO fell 3.94% and $DOGE barely moved (-0.28%) over the same period. All three have an MA5 crossing above MA20, but only $INJ ’s RSI surged to 71.2, with the MACD histogram expanding significantly to +0.136. Its price of 8.379 is already approaching the Bollinger upper band at 8.618, and its 30-candle amplitude of 17.89% shows far greater volatility elasticity than the other two. The funding rate of +0.0
post-image
INJ+10.96%
JTO-3.42%
DOGE-0.46%
Ledger response to the recent supply chain attacks: $899 pls. Ps don't drop it
post-image
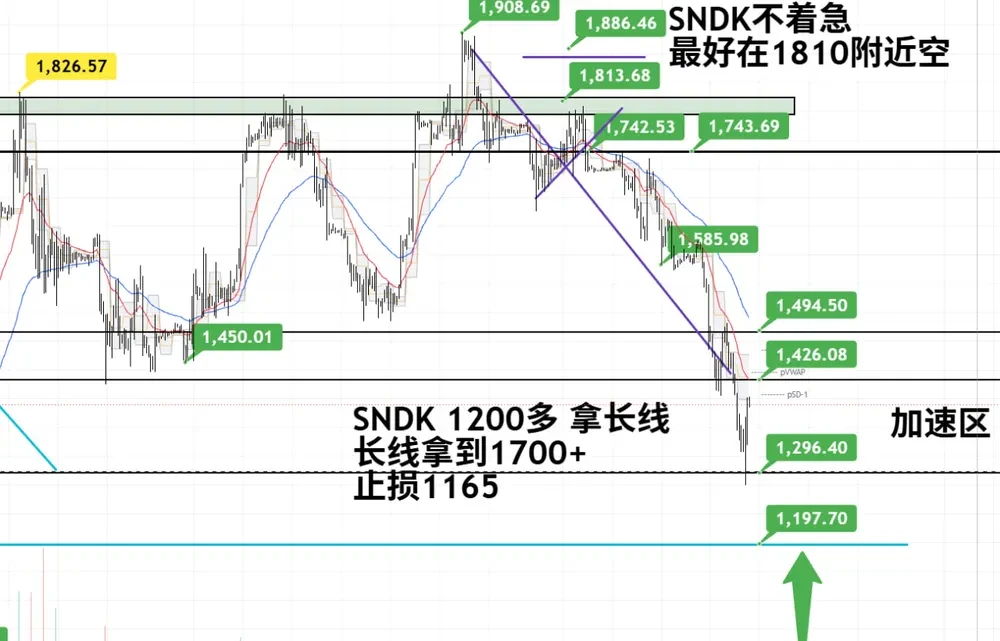
10.16 $SNDK The strategy has once again reached everyone’s favorite moment: the “three storage clowns.” First, SanDisk’s decline is not over yet; it’s just that the short positions exited early, while long positions still have to withstand further downward pressure. We previously discussed one logic,
namely, the three underlying elements for training small and large AI models: 1. Computing power: continuously allowing small and large AI models to iterate and upgrade step by step; 2. Electricity: demand for computing power continues to rise, and stable power supply is the foundation, with typic
post-image
SNDK-0.56%
We could have been a beautiful combo, you and I...
post-image
Load More

Join 40 M users in our growing community

⚡️ Join 40 M users in the crypto craze discussion

💬 Engage with your favorite top creators

👍 See what interests you

Trending Topics

USSeptemberPPIBeatsExpectations

91.35k Views1.88k Discussing

US September PPI came in at 6.3% YoY, well above the 5.3% market expectation, pointing to renewed producer-side inflation pressure. Weekly jobless claims were 199K, broadly in line with forecasts. Could hotter inflation further reduce room for rate cuts, and what does it mean for $BTC, US stocks, and gold?

DrLinHanSpeaksAtOxfordUnion

135.63k Views1.86k Discussing

JapanAndKoreaStocksPlunge

47.27k Views1.76k Discussing

View More