Square
Following
Hot
News
Profile
Share your thoughts
placeholder
Article
GM
New week new money
post-image
$SNDKB Current price: 1120.85, down 4.09% in 24 hours, with a trading volume of 45.7M USDT; MA5=1122.73 is already below MA20=1165.48, RSI=26.7 is nearing oversold territory, the MACD histogram at -7.438 shows bearish momentum still playing out, the lower Bollinger Band at 1113.98 is within reach, and the Fear & Greed Index at 37 is in the fear zone. The data is clear: this is an oversold phase within a downtrend, not a trend reversal. The risk-reward for chasing shorts is already poor, but any bottom-fishing must wait for structural confirmation.
Here’s a reusable method using this coin as an
SNDKB
SNDKBSNDKB
Four.meme
MC:$3.87KHolders:1
0%
ENA+8.04%
BNB-0.76%
Trenches
ZIG
Z
bade
b
ZIG
0x8c...1145
Market Cap
$.
Change
.
24h Vol
$.
Holders
.
IDOL
I
bade
b
IDOL
0x3b...ab07
Market Cap
$.
Change
.
24h Vol
$.
Holders
.
STONK
S
bade
b
STONK
6GmA...UNgx
Market Cap
$.
Change
.
24h Vol
$.
Holders
.
Anakin
A
bade
b
Anakin
Exxz...pump
Market Cap
$.
Change
.
24h Vol
$.
Holders
.
BTC
B
bade
b
BTC
C5xp...pump
Market Cap
$.
Change
.
24h Vol
$.
Holders
.
🚀 Everyone, go long $XAU ! Up to 70× leverage📍 Entry range: 3,967 – 3,973🎯 Take-profit 1: $3,995🎯 Take-profit 2: $4,022🛑 Stop-loss: 3,810
post-image
XAU+0.38%
🚀 Gate Square Content Mining Upgrade | Post to Earn Up to 60% Commission Rebates, and Win Rewards for Quality Content!
🎁 Five Incentives to Boost Your Creator Earnings!
1️⃣ Base Rebate: Add a token tag or trading card to your post, and earn a 10% rebate when users trade through your content!
2️⃣ Engagement Bonus: Complete weekly engagement tasks to earn an extra 10%, for up to 20%!
3️⃣ Ranking Bonus: The weekly TOP 100 creators earn up to an extra 10%, for a total rebate of up to 30%!
4️⃣ Newcomer Boost: Newly onboarded and returning creators get double rebates for 30 days, up to 60%!
5️⃣ Qu
GateSquare
🚀 Gate Square Content Mining Upgrade | Post to Earn Up to 60% Commission Rebates, and Win Rewards for Quality Content!
🎁 Five Incentives to Boost Your Creator Earnings!
1️⃣ Base Rebate: Add a token tag or trading card to your post, and earn a 10% rebate when users trade through your content!
2️⃣ Engagement Bonus: Complete weekly engagement tasks to earn an extra 10%, for up to 20%!
3️⃣ Ranking Bonus: The weekly TOP 100 creators earn up to an extra 10%, for a total rebate of up to 30%!
4️⃣ Newcomer Boost: Newly onboarded and returning creators get double rebates for 30 days, up to 60%!
5️⃣ Quality Rewards: Quality content may also earn additional rewards from the platform!
🔥 Post to drive trades and earn more from quality content!
Post now 👉 https://www.gate.com/post
Rebate details 👉 https://www.gate.com/social-mining-commission
Campaign rules 👉 https://www.gate.com/announcements/article/102544
‍#内容挖矿
repost-content-media
$ETH An extreme crypto trader is back, going 25x long on ETH with a position worth over $11 million and a liquidation price of 2242. Even more intense is $HYPE , with a liquidation price of 80.2 and liquidation just 5U away
post-image
ETH-1.26%
HYPE+0.24%
#WCTCS9 #BTC #ShareWeekly
Bitcoin Analysis: Testing the $77,000 Support Zone, Key Levels and Trading Plan
Bitcoin is trading near 77,750 USDT, down about 2.3 percent over the past seven days and about 10 percent from its early-October high near 86,700. The daily chart shows sellers have controlled the market since the rejection near 84,000 to 84,900 in the third week of October. The market is now testing whether the demand zone spanning 76,300 to 77,500 can hold. I see BTC in a corrective downtrend on the daily timeframe, but it is at a level where a sharp short-term squeeze could occur if bu
Falcon_Official
#WCTCS9 #BTC #ShareWeekly
Bitcoin Analysis: Testing the 77,000 Support Zone, Key Levels and Trade Plan
Bitcoin is trading near 77,750 USDT, down about 2.3 percent over the past seven days and roughly 10 percent below its early October high near 86,700. The daily chart shows sellers in control since the rejection around 84,000 to 84,900 in the third week of October. The market is now testing whether the 76,300 to 77,500 demand zone can hold. My view is that BTC is in a corrective bear phase on the daily timeframe, but it sits at a level where a sharp short squeeze is possible if buyers defend this area.
On the 1-day chart, BTC has printed a series of lower highs: about 86,700 on October 6, about 84,400 on October 22, and a failed bounce toward 81,900 on October 28. The decisive move came on October 29, when price broke below 80,000, fell below the short-term moving averages, and turned the 30-day average into resistance. On October 30 the price wicked down to 76,283 and recovered, leaving a long lower shadow. That wick is the most important support marker on the chart right now. The October 31 candle closed at 78,341, and today's session opened near 78,342, but price has slipped back below 78,000. The recovery is not yet confirmed.
On the 7-day view, the trend remains negative. The 7-day change is about minus 2.3 percent, and the market has been making lower highs since early October. However, the structure is not yet a full breakdown, because price has held above the 76,000 region and has not produced a daily close below the October 30 low. That distinction matters for trade planning.
Moving averages show the short-term weakness. The 7-day MA is near 79,083 and the 30-day MA is near 81,916, so price is below both. The 120-day MA sits near 74,426 and the 200-day MA near 73,195, and price remains well above these long-term averages. This suggests the broader uptrend from earlier in the year has not been broken. The bear case is a correction inside a larger structure, not yet a full cycle reversal. The EMA 200 near 74,539 is a deeper support I am watching if the 76,300 zone fails.
Bollinger Bands give a similar picture. The middle band is near 80,929, the upper band near 84,578, and the lower band near 77,280. Price is below the middle band and close to the lower band. Momentum is weak, but the market is not in extreme oversold territory. The 30-day volatility measure is about 1.5 percent per day, so a move of 3 to 4 percent in either direction within a few sessions is realistic.
Momentum indicators lean bearish but are not extreme. Daily RSI is about 39.5, below the neutral 50 line, so bears still have the upper hand, yet it is not oversold below 30. Stochastic readings are low, with K near 25 and D near 24, which allows for a short-term bounce if support holds. MACD remains negative at about minus 455, with the signal line near minus 648, and the histogram is negative. I want to see a bullish MACD crossover before calling a trend change. ADX is near 17, meaning trend strength is weak. The DI minus line near 28 sits above the DI plus line near 15, confirming that bearish direction still dominates. The Parabolic SAR is near 83,190, above price, which stays bearish until price closes above it. Williams %R near minus 76 is leaning oversold but not extreme.
Market sentiment looks cautious rather than panicked. Price has held above 76,000 through several sessions of selling, which suggests spot buyers are still active near these levels. Strategy, Michael Saylor's company, has kept buying bitcoin. Reports from October put its holdings at roughly 848,000 to 848,500 BTC, with further purchases in the week of October 19. Saylor posted a purchase chart on November 1, which many traders read as a hint of another buy. At the same time, MSCI is due to announce its index decision on November 11, and some analysts are discussing whether Strategy could face index-related selling pressure. This creates two-sided risk. Continued treasury buying supports sentiment, while index uncertainty could add volatility. I do not treat Strategy purchases as a guaranteed price driver, but they are a useful sentiment signal to watch alongside the chart.
Key resistance levels are as follows. 79,100 is the 7-day MA and a recent intraday pivot. 80,900 is the 30-day MA and the Bollinger middle band, and it is the first level bulls must reclaim. 81,900 to 82,000 is the October 28 rejection zone. 84,400 to 84,900 covers the October 21 and 22 highs and the upper Bollinger region. 86,700 is the October 6 high, the level that must be reclaimed for a real trend reversal.
Key support levels are as follows. 77,500 to 77,000 is the current demand area, close to the November 1 low near 77,490. 76,300 is the October 30 wick low and the most important line in the market right now. 75,000 is a psychological round number and a previous consolidation shelf. 73,200 to 74,500 contains the 200-day MA and the EMA 200.
For long trades, my base plan is patience at support with defined risk. I prefer entries in the 77,000 to 77,500 zone, and only once price holds above 77,000 on a 4-hour close and reclaims 78,000. The main stop loss sits below 76,300, which would invalidate the support test. Targets are TP1 at 79,100, TP2 at 80,900, and TP3 at 82,000. Using an entry at 77,300 with SL1 at 76,800, SL2 at 76,300, and SL3 at 74,800 as a deeper protective stop, the reward-to-risk to TP1 is about 1.6 to 1 against SL2, rising to about 3.2 to 1 at TP2 and about 4.2 to 1 at TP3. Partial profit taking at TP1 and TP2 makes sense, with the remainder held for TP3 if momentum improves. SL3 is only for traders who accept a wider drawdown and expect a retest of the 200-day MA.
For short trades, I prefer waiting for a rejection rather than chasing. A strong short zone is 80,900 to 81,900, where the 30-day MA, the Bollinger middle band, and the late October breakdown level converge. If price rejects there with a bearish daily or 4-hour candle, I would place the stop above 82,300. Staged risk levels are SL1 at 82,300, SL2 at 83,200 near the SAR level, and SL3 at 84,600 near the upper Bollinger band, depending on position size. Targets are TP1 at 78,000, TP2 at 77,000, and TP3 at 76,300. A daily close below 76,300 would open the path toward 75,000 and then the EMA 200 near 74,500.
The trend call is a bear correction for now, not a confirmed bear market. The bullish case strengthens if BTC closes a daily candle above 80,900 and then above 81,900. That would reclaim the 30-day MA and show sellers losing control. The bearish case becomes dominant if BTC closes below 76,300 on a daily basis, confirming a lower low and opening the path to 75,000 and possibly 73,200. Between these levels, the market is likely to stay range-bound with choppy moves.
For spot accumulation or long positions, the best area is the 76,300 to 77,500 band, provided price shows signs of holding. Scaling in is safer than entering all at once. A first entry near 77,500 and a second near 76,800 spreads the risk. Avoid chasing above 79,000 unless the market closes above that level with strong volume.
My base case for the next seven days is a range of 76,300 to 81,000, with a slight upside bias if 77,000 holds and MACD starts turning up. The bullish scenario targets 81,900 to 82,000 if buyers reclaim the 30-day MA. The bearish scenario targets 75,000 if the 76,300 support fails. These are scenario estimates, not guarantees.
On position size, risk no more than one to two percent of trading capital on any single idea. If you use leverage, keep it low. A 2 to 3 percent move against you can trigger liquidation quickly in a choppy market.
Bitcoin is at a decision point. The short-term daily trend is bearish, but the long-term structure remains above the 120-day and 200-day averages, and the 76,300 wick low gives a clear line for risk management. Wait for confirmation, respect the levels, and do not mistake a bounce for a trend reversal.
repost-content-media
BTC-0.67%
  • 3
We're among the most talked-about topics; you guys really are left-wing. #TheLeftFollowsTheLeft
post-image
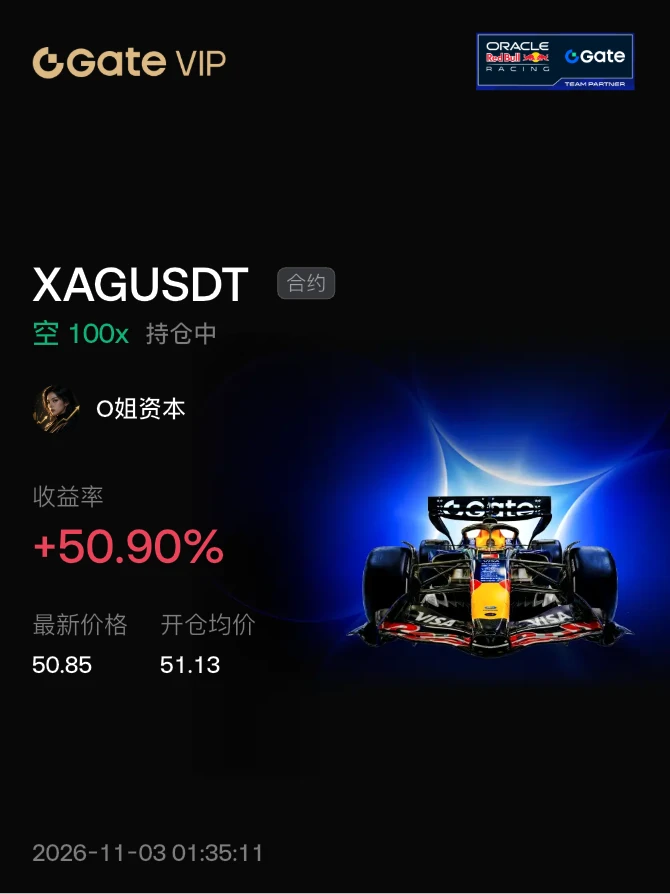
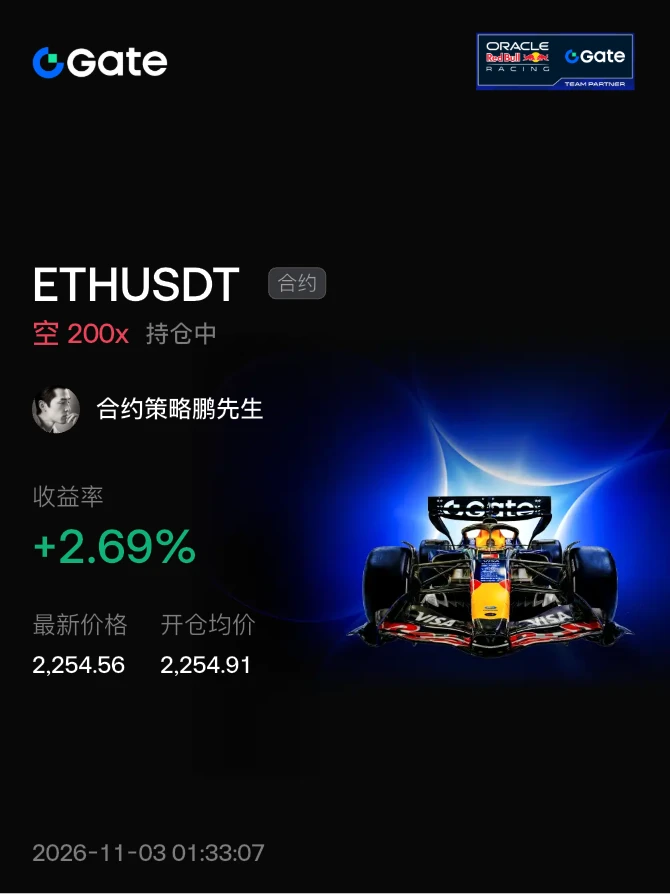
#晒出我的持仓收益 Gold, silver, Ethereum, ETH, waiting all night, live now
post-image
GLDX-0.40%
PAXG+0.37%
ETH-1.26%
$ETH I can never get the timing right. I opened a short at 2286 this morning, then it kept going up. I held it for half a day, but when it later dropped to 2283, I couldn't hold on and closed it. I guess that money just wasn't mine to make. I can't be bothered to open a trade tonight either; watching the charts is exhausting. I'll place a limit buy order at 2255 and go to sleep, then check again tomorrow morning. ‌
post-image
ETH-1.26%
  • 3
market updates for new streamer
live-cover
LIVE1,616
🚩 UNITED WE STAND! ❤️
Left follows left! Every new follower makes us stronger, every follow adds to our numbers, and every share helps us grow!
🤝 Follow me and I’ll follow back (F4F).
🔁 Leave your RT.
❤️ Let’s strengthen our community!
🎯 ON THE ROAD TO 3K!
#EsquerdaSegueEsquerda #SDV #RoadTo3K
post-image
I regret closing the short too early earlier. I think we can watch 2220 tonight, set a stop-loss at 2285, and hold it for a bit. I just shorted from 2270.
#晒出我的持仓收益
post-image
The midterm elections are likely to result in a divided Congress, which is actually a relatively comfortable setup for AI and chip stocks: major policies are unlikely to advance, and major surprises are unlikely to emerge.
Prediction markets are currently clearly betting that Democrats will retake the House, while control of the Senate will depend on the final results in several key states. Under this scenario, at least one chamber of Congress will be controlled by a different party than the White House. Passing major new legislation over the next two years is basically off the table, with pol
post-image
NVDA-0.35%
AMD-0.55%
TSM-0.18%
#GateSOLStakingHitsNewHigh
#GateSOL质押创新高参考年化7.29%
Gate SOL Staking Reaches a New High: A Strong Signal of Growing Confidence in the Solana Ecosystem
The latest milestone in Gate's SOL staking ecosystem deserves attention. According to recent platform data, the total amount of SOL staked through Gate has reached approximately 662,600 SOL, establishing a new historical record. The reported reference annualized yield was around 6.45% at the time of the October 22 update.
This achievement represents more than just an increase in staking numbers. It highlights the growing importance of passive yie
SOL-0.77%
GTSOL+0.00%
🚨 $ARIA Rallies 45% — Can the Momentum Last?
$ARIA climbed to $0.1338 before pulling back to around $0.1222, with $23.58M in 24-hour trading volume.
📊 Three signals to watch:
🔹 Resistance: $0.134–$0.140. A confirmed breakout could open the door to further upside.
🔹 Liquidity: $1.78M. Relatively thin liquidity increases the risk of sharp price swings in both directions.
🔹 Sustainability: Will buying pressure continue, or will profit-taking weaken the rally?
My take: High volume confirms strong market activity, not necessarily sustainable demand. Without a verified catalyst, $ARIA still ne
post-image
ARIA+22.03%
Console yourself that you're in it for the long term#intc #sol
INTC-5.69%
SOL-0.77%
Woke up MEGA bullish on Crypto today
I want to see all time highs in 2027!!
post-image
Xiaohan’s Diary of Turning 20u into 80k: Spot Bottom-Fishing Picks
There are many coins worth buying right now, but I recommend two: one is $KGEN . We can see that Bitcoin is falling, but it has support at 0.07. This can be considered strong support, and tomorrow we can open a long position at this price. The other is $BIRB . Its price action is still range-bound and shaking out weak hands, and on-chain data suggests it has the makings of a monster-coin run. So I highly recommend #每周来晒 #美股财报季 ‌
KGEN-5.73%
BIRB-15.48%
  • 7
  • 1
Sony’s crowning achievement back then—supposedly, it survived thanks to this company. Do you remember what it was?
Load More

Join 40 M users in our growing community

⚡️ Join 40 M users in the crypto craze discussion

💬 Engage with your favorite top creators

👍 See what interests you

Trending Topics

USMidtermsEnterFinalStretch

8.43k Views487 Discussing

The U.S. midterm elections are entering the final stretch, with control of both chambers of Congress still at stake. Inflation, energy prices, tariffs and economic policy remain key voter concerns, while the result could shape fiscal, trade and regulatory policy over the next two years. If the balance of power in Congress changes, which policies could be affected first? How might U.S. stocks, gold and crypto trade the election outcome? Are you watching fiscal policy, tariffs or crypto regulation most closely?

USEarningsSeason

431.1k Views3.19k Discussing

AppleQ3EarningsInFocus

6.16k Views540 Discussing

View More