
Square
Following
Hot
News
Notifications
Profile
Share your thoughts
placeholder
Article
In the cryptocurrency market, many traders see BTC trading volume suddenly surge and assume prices are about to rise. But sometimes, volume increases significantly while prices fail to rise and instead fall. Why is that?
First, it’s important to understand that trading volume represents market activity, not simply buying pressure. Every trade involves both a buyer and a seller, so a surge in volume does not mean prices will necessarily rise.
First, rising prices on high volume. If prices continue to rise while volume increases, it shows that market participation is growing, and buyers may be t
post-image
BTC-0.67%
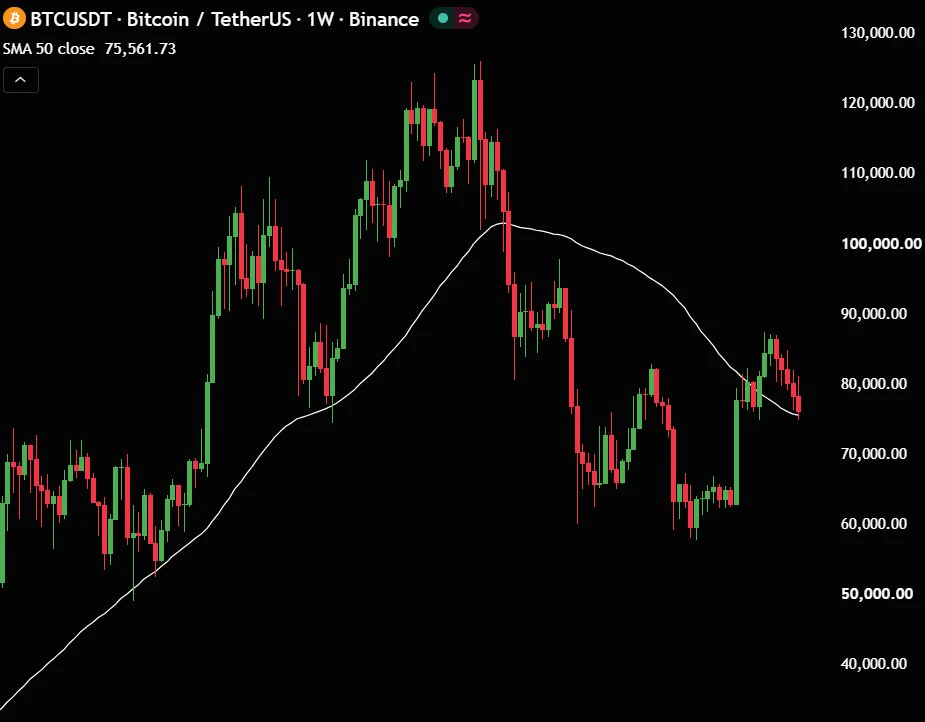
$BTC is testing the crucial 50-week MA.
Hold it, and bulls could regain control.
Lose it, and more downside may follow.
Pay attention!
post-image
BTC-0.67%
Trenches
ZIG
Z
bade
b
ZIG
0x8c...1145
Market Cap
$.
Change
.
24h Vol
$.
Holders
.
BTC
B
bade
b
BTC
C5xp...pump
Market Cap
$.
Change
.
24h Vol
$.
Holders
.
Diamond
D
bade
b
Diamond
5VCE...pump
Market Cap
$.
Change
.
24h Vol
$.
Holders
.
DOGE
D
bade
b
DOGE
DoGE...fm7R
Market Cap
$.
Change
.
24h Vol
$.
Holders
.
STONK
S
bade
b
STONK
6GmA...UNgx
Market Cap
$.
Change
.
24h Vol
$.
Holders
.
ETH UPDATES
live-cover
LIVE1,975
Does she really know she was wrong🤔
post-image
In the cryptocurrency market, many traders have learned some technical analysis methods but still repeatedly lose money in volatile, range-bound conditions. The reason may not be that their technical skills are lacking, but that they have failed to identify the current market state.

The biggest difference between trending and range-bound markets is how prices move.

First, in a range-bound market, prices usually fluctuate repeatedly within a certain range, with resistance above and support below. If you follow a trend-trading approach—going long when you see prices rise and going short when y
post-image
#每週來曬 and #美股史詩級拋售
This Week’s Topic: Is the AI Market Facing a Deeper Correction?

The US stock market experienced a significant sell-off on Thursday, November 5, 2026, as investors reacted to growing uncertainty surrounding the future of artificial intelligence investments. The Nasdaq Composite dropped approximately 5.5%, while the S&P 500 declined 4.4%. Technology and semiconductor companies suffered particularly heavy losses. Reuters +1

Is this downturn short-term deleveraging or the beginning of a deeper AI correction?

I believe the current downturn reflects a combination of short-t
post-image
NVDA+2.80%
  • 5
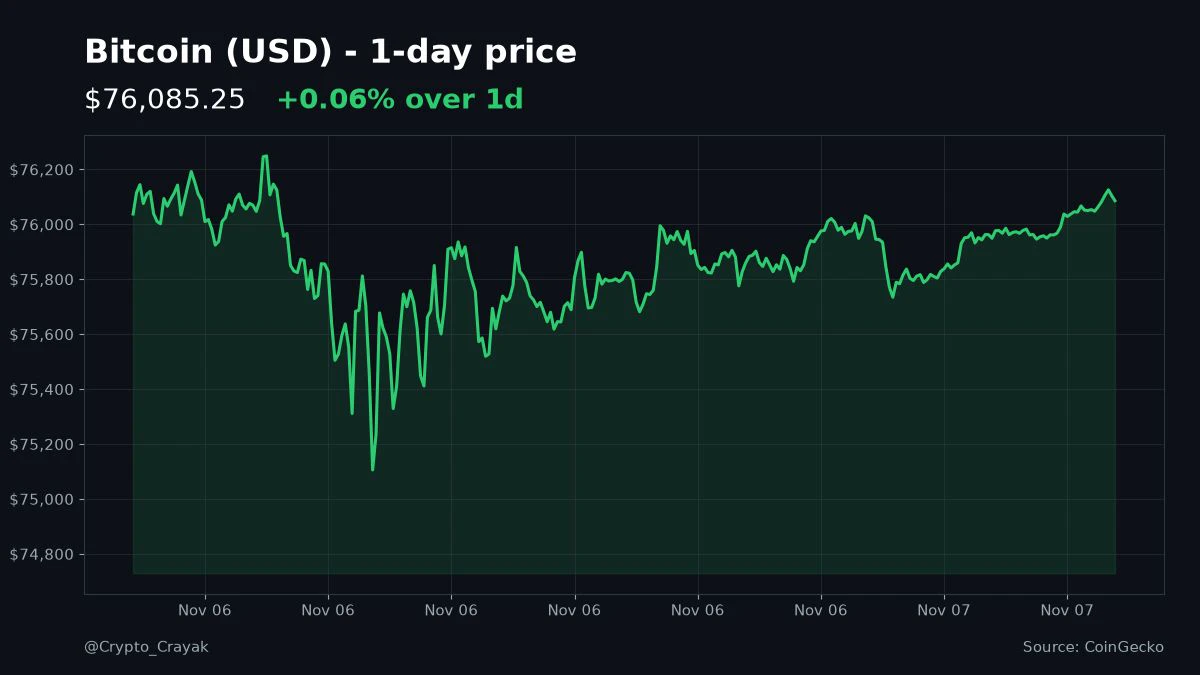
Up way too early and Bitcoin's still glued near $76K. Barely moved overnight after dipping to about $75K. I should be sleeping, not refreshing this. Anyone else up watching nothing happen? #Bitcoin
post-image
BTC-0.67%
From 81,196 down to 74,888—a $6,308 drop. For anyone long with 10x leverage, that drop was enough to liquidate you twice.

The structure is laid out here, one level at a time:

Downside: 74,888 is the low of this move. Below that is the daily MA200 at 73,200, the last major-cycle threshold. A break below it would mean a genuine change in trend.

Upside: The daily MA100 at 77,200 is the first hurdle; above that, 77,500–78,000 is a double resistance zone formed by the 4H MA20 and MA50. Until price reclaims 77,200, any bounce is just a bounce.

Moving averages: The daily MA5, MA10, MA20, and MA50
post-image
BTC-0.65%
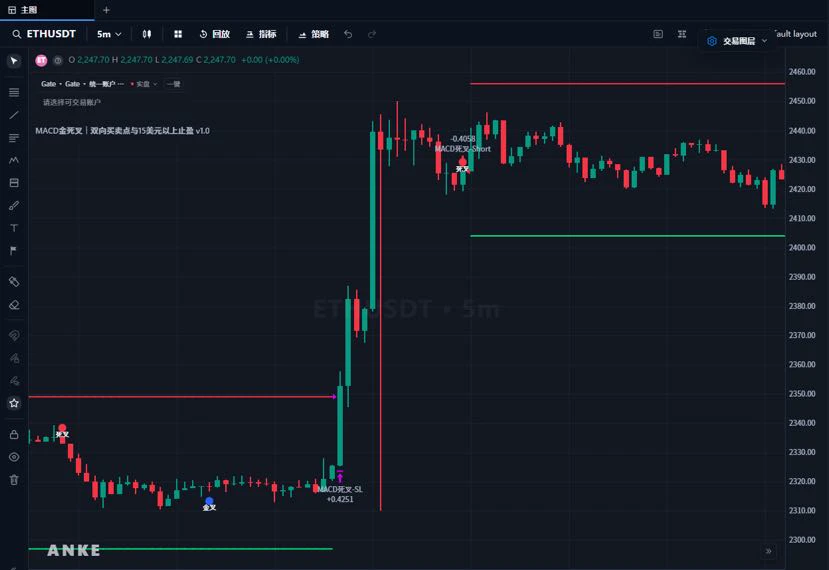
💡 You can try developing your own trading strategy even if you can't code!

You only need to describe your trading idea in one sentence, for example:

“When the MACD makes a bullish crossover and the price rises above the moving average, signal a long; when it makes a bearish crossover, signal a short.”

AI can help generate the corresponding indicator and standalone strategy code.

Make the complex coding process more intuitive, so traders can focus more of their energy on strategy logic and market research.

Your trading idea can start with a single sentence.
post-image
Look at the 4-year cycle trend:
2014, 2018, 2022, and now 2026. Q4 drops are normal, but history tells us they are always followed by a massive market pull and a huge multi-year bull run.
Difficult days are ending get ready for the big ride! 💎
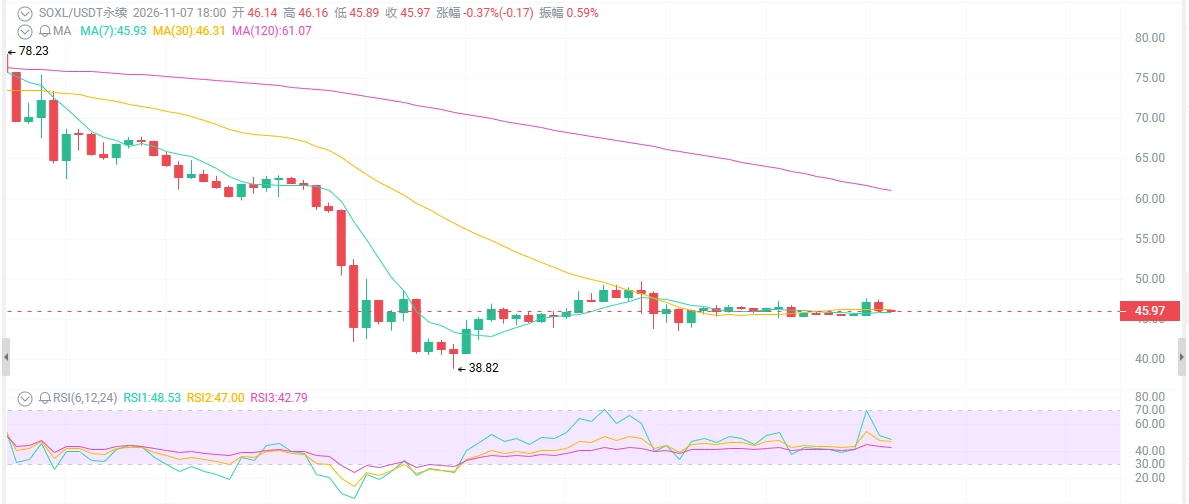
SOXL at $46—would you dare to buy the dip?
It plunged from $302 to $46, down 85%. Everyone is shouting, “Semiconductors are finished.” Just now, a big 12% green candle shot straight from $43 to $46, volume surged, and the RSI climbed back from 27. Is this really a “dead cat bounce,” or a desperate counterattack by AI chips?

First, the surface picture: after the plunge, it finally bounced.

SOXL was thoroughly crushed from its June high of $302 all the way to $43, falling 60-70% in nearly a month. The daily RSI dropped to 27-30, extremely oversold. On November 5-6, the price rebounded more tha
post-image
BTC-0.67%
ETH-1.26%
SOXL-1.16%
Najib had just paid the 50 million ringgit fine and stepped out of prison when, a few hours later, he was thrown back in. This is downright surreal!
The National Palace issued a blunt statement on Saturday: the pardon decree is crystal clear, all conditions have been met, and anyone who challenges it is defying the King’s decree
The Attorney General’s Chambers is still arguing that it is not trying to overturn the King’s pardon decree, but is simply asking the court to clarify whether the High Court’s release order means Najib has completed his sentence in the SRC case
Put simply, he was relea
post-image
#Gate股票畅聊季 AI Market Collapse + Stagflation Looming: U.S. Stocks Enter a Period of Volatility

The market is seriously misjudging the AI sector’s ability to deliver on earnings and the macroeconomic pressure from stagflation. The risk-reward profile of one-way bets on U.S. stock indexes has deteriorated sharply.

I. Root of the Risk: Global Liquidity Imbalances and an Unsustainable AI Capex Bubble
The source of this market risk lies in the long-term structural imbalance in global cross-border capital flows. Overseas funds have continued pouring into dollar assets, steadily pushing up valuation
CRWV+6.18%
TSLA+4.26%
ORCL+0.84%
VST+10.47%
  • 5
  • 1
How Should You Manage Position Sizes? How Can Scientific Position Sizing Control Risk and Generate Steady Profits?
In cryptocurrency trading, many people study BTC's price direction every day, but rarely give serious thought to one question: Even if you're right, how much capital should you put in?
In fact, many traders don't lose because they misjudge the direction, but because they fail to manage their position sizes.
Suppose your trading account has 1,000 USDT. If you put all your funds into every trade, a sudden market move could cause serious losses. Even if the market later moves as you
#AITechSelloffPutsCryptoUnderPressure
The recent sharp fluctuations across global financial markets highlight a coordinated phase of technical deleveraging and structural capital reallocation. A significant single-day sell-off, heavily concentrated in high-beta technology sectors and digital assets, was quickly met by a technical recovery driven by retail capital and the stabilization of passive rebalancing flows.
Rather than indicating a systemic collapse, institutional metrics reveal a calculated risk-management cycle. Many prominent hedge funds had actively reduced their net exposure to ov
post-image
NVDA+2.80%
AMD+11.55%
NAS100+1.90%
BTC-0.67%
  • 9
🔥We banked gains across the board this week—the market moves to our rhythm!
The market seesawed all week, with long and short turning points locked in ahead of time. We traded Bitcoin, ETH, ZEC, and gold across the board, keeping the pace firmly in our hands.

Early in the week, Bitcoin tested 78,000. The bullish move was a trap, and we took 2,300 points with a high-level short at resistance. Once the selling pressure had played out, we scaled into longs at 76,000 and drove straight to 80,800.
At 80,800, the bullish run was over. We decisively reversed into a high-level short and captured a 5
BTC-0.65%
ETH-1.23%
Crypto market update
live-cover
LIVE2,352
This is the most vivid analogy I've seen so far🤣
post-image
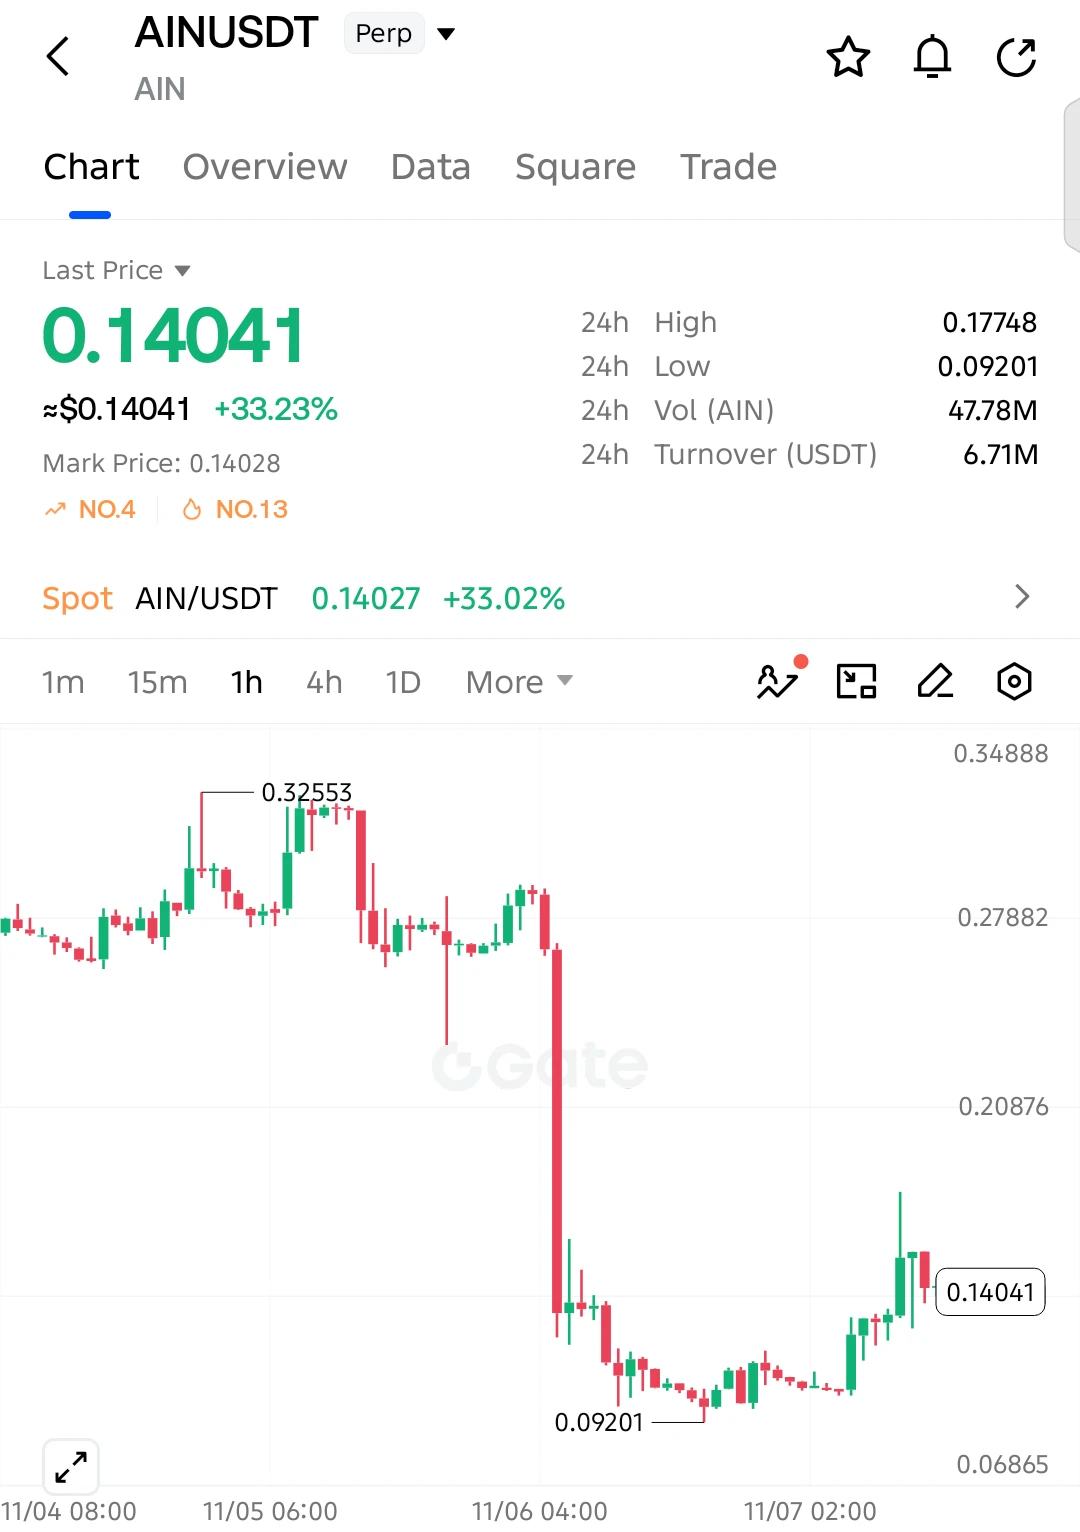
$AIN SHORT SETUP — BIG PUMP, STRONG REJECTION!

$AIN surged 33.23%, but the sharp rejection from 0.17748 suggests sellers are stepping back in. Another correction could be developing!

Entry: 0.14041
SL: 0.15850

TP1: 0.12800
TP2: 0.11500
TP3: 0.10200
Final Target: 0.09201

After a massive rally, $AIN faced aggressive selling near its recent high. The broader trend remains bearish, and if buyers fail to defend 0.1350, selling pressure could accelerate toward 0.1150 and potentially retest the previous low.

Invalidation: A sustained recovery above 0.15850 weakens the bearish setup.
post-image
AIN+3.85%
Load More

Join 40 M users in our growing community

⚡️ Join 40 M users in the crypto craze discussion

💬 Engage with your favorite top creators

👍 See what interests you

Trending Topics

USAIStocksHitHard

17.41k Views3.65k Discussing

U.S. stocks sold off sharply on Thursday, November 5 (UTC). The Nasdaq closed down around 5.5%, entering correction territory, while the Philadelphia Semiconductor Index plunged roughly 12%, with chip stocks including $NVDA and $AMD posting steep losses. Beyond profit-taking, investors are growing concerned about the pace of AI data center construction, capital spending, and future returns on investment. The key question now is whether the AI sector’s lofty growth expectations need to be repriced. Where do you think the next opportunities will emerge: chip stocks, tech giants, or other sectors?

USNonfarmPayrolls

26.04k Views4.28k Discussing

StakeOnLaunchpoolToShare450KVLX

4.29k Views786 Discussing

View More