
Square
Following
Hot
News
Profile
Share your thoughts
placeholder
Article
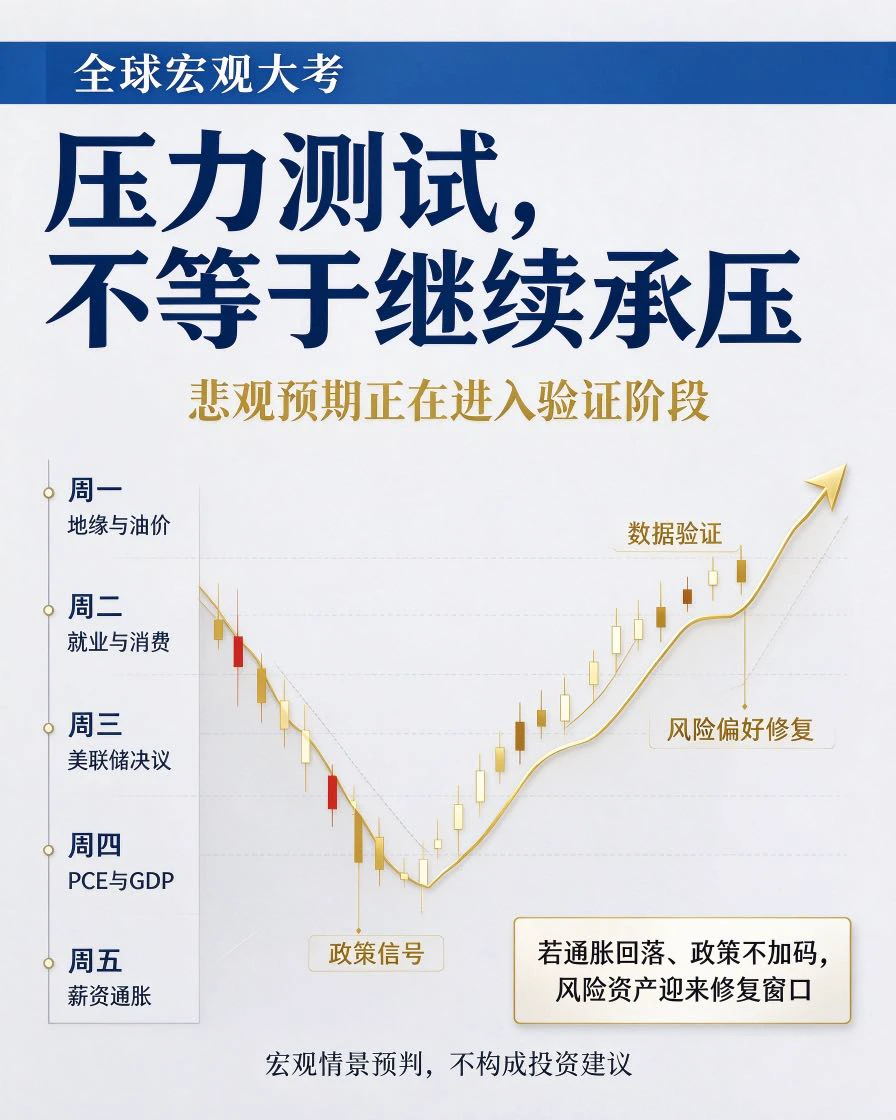
The odds of the Fed holding rates steady in October have surged to 85%—inflation and economic data are keeping the Fed from having an off-ramp. The stronger the data, the further away rate cuts get, and mortgage and credit card rates will have to stay high. Save this and come back tomorrow to check. Follow if you’re watching the data.
post-image
Shāzhūcài is just so quintessentially northeastern. I can’t even take one bite. Luckily, there are green peppers.
But that doesn’t stop my card-playing friends from eating it with great relish. They think it’s very authentic.
It feels like the only thing that can bring the diets of these card-playing friends together is Shandong green onions—including seafood, and one thing they can’t eat—the lamb stir-fried with scallions is just incredible. It feels like Shandong green onions and those from other places aren’t even the same species.
I can’t handle anything sour at all, so I have to admire th
Trenches
AGT
A
bade
b
AGT
0x5d...e274
Market Cap
$.
Change
.
24h Vol
$.
Holders
.
CNPY
C
bade
b
CNPY
0xc6...ddd2
Market Cap
$.
Change
.
24h Vol
$.
Holders
.
FOLIO
F
bade
b
FOLIO
0x5f...e411
Market Cap
$.
Change
.
24h Vol
$.
Holders
.
Q
Q
bade
b
Q
0xc0...0589
Market Cap
$.
Change
.
24h Vol
$.
Holders
.
FTR
F
bade
b
FTR
DFMt...pump
Market Cap
$.
Change
.
24h Vol
$.
Holders
.
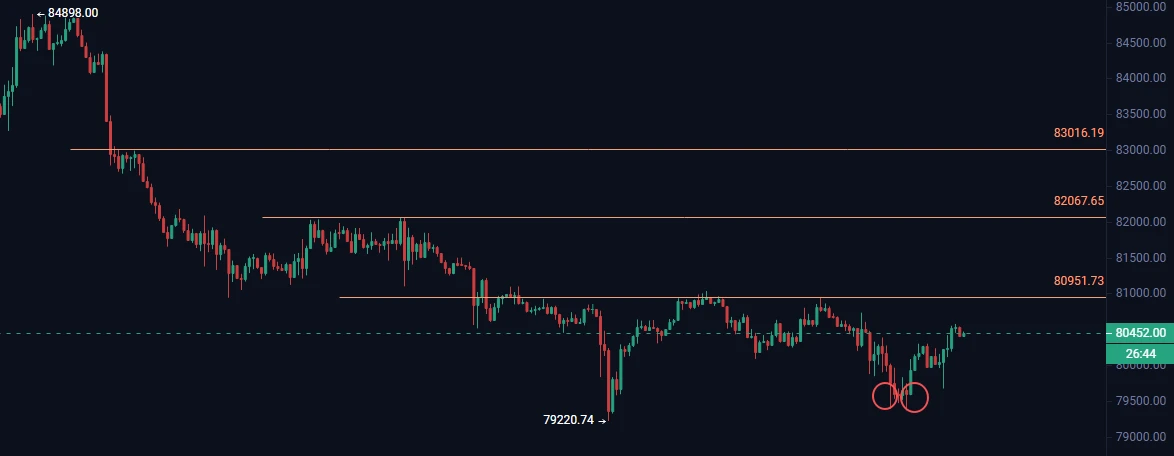
BTC is bearish today, with a clear divide between bulls and bears. The market is range-bound and trending lower, driven by “macro tightening + ETF outflows + technical weakness,” but exchange reserves hitting a record low and expanding institutional custody provide medium- and long-term support. This is not a collapse-style decline.
Bearish factors are dominant for BTC today, with range-bound trading skewed downward. Don’t chase shorts; wait for a retest of 80,000-81,000 to hold before taking a small short-term long position. Don’t chase longs; wait for a rebound to 82,300-82,623 to meet resis
BTC+0.29%
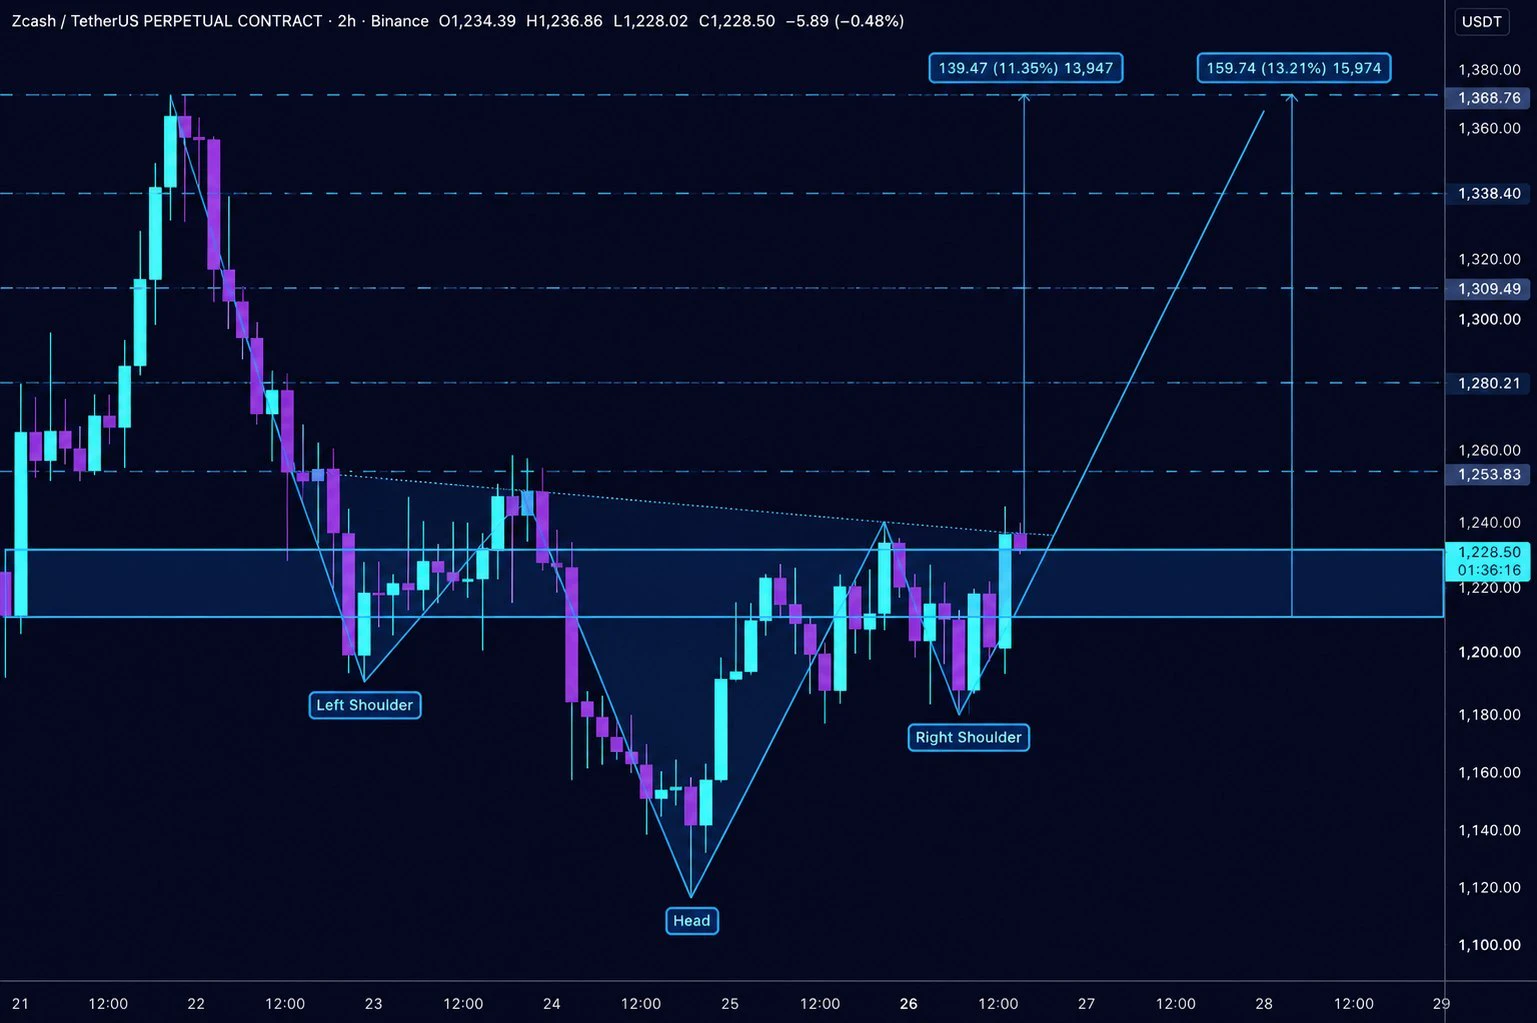
#ShareWeekly ‌$ZEC in ten numbers: a different way to read the week at $1,162
Instead of a standard chart review, here are ten numbers that explain where Zcash stands today, what they mean, and what to watch next.
1. $1,162: the price in context
Trackers show ZEC between about $1,144 and $1,176 on October 17, so $1,162 sits in the middle of the live range. Over the past 24 hours the high was $1,239.00 and the low was $1,130.36.
2. #10: its rank by size
ZEC ranks tenth by market cap. Its market cap is about $19.98 billion, which puts a privacy coin in the same top-ten conversation as the bigge
post-image
ZEC-1.30%
BTC+0.29%
ETH+0.20%
Beyond the Order Book: How Gate Money Transforms Crypto into Real-World Utility 🌐💳
For years, crypto has been viewed primarily through the lens of price charts, trading pairs, and market volatility. But true adoption happens when digital assets seamlessly bridge into everyday financial workflows.
With Gate Money, the Gate ecosystem shifts from being solely a trading platform to an all-in-one financial gateway. Here is a breakdown of how Gate Money enhances financial flexibility and utility for everyday users and professionals alike:
1. Seamless Cross-Border Financial Management 🌍
For freela
BTC+0.29%
GT-2.04%
META-3.68%
Russian forces are setting up a security zone and launched a massive overnight drone assault, sending pressure on Kyiv through the roof. Meanwhile, Washington has once again granted waivers for some sanctions on Russia—the political drama is even more convoluted than the battlefield. At this point, it’s all about who runs out of steam first. We’ll see this weekend how the sanctions easing plays out and whether it checks out.
post-image
2026-10-17 18:05 UTC. Following a clean double-target hit on BTC in our previous session, BTW/USDT swept both liquidity extremes over the last four hours and is now trading at ~2.56185 USDT, extended well above its upper boundary. With price currently stretched past the SHORT ZONE (2.51888 - 2.53905 USDT) and structural support anchored at the LONG ZONE (2.15307 - 2.17324 USDT), we watch for momentum exhaustion to pull price back toward the equilibrium TARGET ZONE (~2.3099 USDT).
BTC/USDT also holds a clean structure (SHORT: 81543.4 - 81560.4 | LONG: 81235.8 - 81252.7 | TARGET: ~81357.5 USDT)
post-image
BTC+0.29%
BTW+35.96%
SOL-0.06%
$BAT currently makes this trade look quite solid.
There’s no reason to complain about this move. Good result. Keep an eye on $BT and $ICNT today.
post-image
ICNT+38.99%
BTC MARKET TRENDS
live-cover
LIVE451
Bitcoin market caps correlation
live-cover
LIVE80
$FIL I held through this whole move from 1.8 down to 1.05, and only learned to shut up after cutting losses of over $40,000. It’s now at 1.0641, down another 7.28% over 24h, with $165 million in trading volume—volume hasn’t dried up, which means panic selling is still underway. I’m not guessing the bottom; I’m following the data: the previous low of 1.0582 is the line in the sand. If it breaks, I’m looking at 0.9. My plan now: a 30% core position, scaling in between 1.06 and 1.08, selling half on a rebound to 1.15, with strong resistance at 1.22. Stop-loss at 1.03; if it breaks, I take the los
FIL-6.60%
The market never sleeps.
Analyze the charts, manage your risk, and let discipline guide your trades. No emotions, just strategy.
post-image
#每周来晒 #沃什IMF讲话 Fed Chair Kevin Warsh Keeps Markets Guessing as Bitcoin Trades Near $81,550
The October 16 IMF fireside chat delivered a crucial message for global markets: the Federal Reserve remains focused on price stability, but its next interest-rate decision is not predetermined. Fed Chair Kevin Warsh discussed persistent inflation, economic resilience, and the growing influence of artificial intelligence on investment and productivity without committing to another rate increase. For Bitcoin traders, the significance lies in how these economic signals influence the US dollar, Treasury yie
post-image
BTC+0.29%
🚨 RUMOR: Evernorth, the XRP treasury platform, is reportedly considering purchasing another $655 MILLION worth of $XRP as early as next week. 👀
The potential acquisition remains unconfirmed.
XRP-0.24%
$APT Current price: 0.7895, below the lower Bollinger Band at 0.7965. MA5 (0.80394) is below MA20 (0.828335), indicating a bearish short-term moving average structure. However, RSI is only 23.4, in oversold territory. The MACD histogram is still negative at -0.004722, and with the price tracking the lower band, chasing shorts offers poor risk-reward; an oversold rebound appears more likely.
Key levels: 0.78 is the psychological round-number level and the lower bound of the 30-candle range. The lower Bollinger Band at 0.7965 becomes the first resistance, with strong resistance from MA20 near 0
post-image
EIGEN+1.30%
$SOL Is it being overlooked by the market right now? The answer is yes, and that very neglect is what makes its relative strength worth watching.
Side-by-side comparison within the same sector: $AVA is up 36.89% over 24h, with an RSI of 85.7, deeply overbought, and its price has surged above the upper Bollinger Band at 0.365925—a sentiment-driven rally that has run too far. Another asset is down 2.45% over 24h. Although its MACD histogram is positive at 1.967, MA5 at 1296.78 is below MA20 at 1298.58, making the strength of the rebound questionable. By contrast, $SOL is unchanged over 24h, se
post-image
SNDKB
SNDKBSNDKB
Four.meme
MC:$3.87KHolders:1
0%
SOL-0.06%
AVA+42.13%
#美股存储板块跌幅扩大 The Nature of the U.S. Tech Pullback Is Shifting: From Valuation Repricing to Credit-Chain Repricing
Many people are still viewing U.S. stocks through the old “AI pullback = buying opportunity” playbook. But if you only watch the Nasdaq and the Philadelphia Semiconductor Index, you may miss the most important change:
July was “AI valuation/positioning repricing”; October is a triple hit from “the AI credit chain + high interest rates + geopolitics/oil prices.” The latter is closer to a “credit-side preview” of the bursting of the 2000 internet bubble, but we’re not yet in a full-bl
post-image
Will #Bitcoin grab the last longs before 85K?
post-image
BTC+0.33%
$Q ‌Don't even think about sleeping today
post-image
Q+120.16%
Treat $SOL as a thesis to test: current price 103.52, down 0.93% over 24 hours, with participation at 0.42x. What’s known is clear; the key unknown is whether real buyers will show up at key levels.
There’s a simple rule of thumb: price shows direction, while volume shows participation. When price has moved but volume is clearly below average, the follow-through on either a breakout or a decline should be discounted. Looking only at candle colors is easy, but price moving and most people being willing to follow are two different things.
Don’t clutter the chart with lines. For now, just note 1
post-image
SOL-0.06%
Load More

Join 40 M users in our growing community

⚡️ Join 40 M users in the crypto craze discussion

💬 Engage with your favorite top creators

👍 See what interests you

Trending Topics

USSeptemberPPIBeatsExpectations

91.35k Views1.93k Discussing

US September PPI came in at 6.3% YoY, well above the 5.3% market expectation, pointing to renewed producer-side inflation pressure. Weekly jobless claims were 199K, broadly in line with forecasts. Could hotter inflation further reduce room for rate cuts, and what does it mean for $BTC, US stocks, and gold?

GateWCTCS9GlobalTradingCompetition

37.87k Views6.67k Discussing

GateBTCAndETHFuturesVolumeRanksTop3

53.8k Views1.8k Discussing

View More