Square
Following
Hot
News
Profile
Share your thoughts
placeholder
Article
$IREN
Not looking good for IREN, as the bulls are almost losing the demand zone at $30.19-$32.74 per share.
I am looking at two levels
1. The $25.01/share level
and
2. Bullish OB of $15.86-$18.91 per share, where I will be loading all my ammo should we approach this
#NFA
post-image
IREN-0.55%
$NEAR The most interesting thing right now is not guessing whether prices will rise or fall, but seeing who is forced to change their tune first.
The bulls’ test is at 5.44, while the bears’ test is at 4.527. $NEAR is currently at 5.392, up 11.96% in 24 hours. One-hour support is 4.527, resistance is 5.44, and current volume is 0.31 times the average volume of nearly 20 bars.
For now, I’ll note that $NEAR remains strong, while the crowded positioning is already out in the open. I acknowledge that the trend is strong, but what matters next is not how much higher it can surge, but whether anyone
post-image
Retail investor: Oil’s back over $100 & they’re hitting tankers in Hormuz again. I’m thinking about going to cash till it calms down
Me: When does it calm down?
Retail investor: idk... when the war’s over?
Me: Brent oil hit around $118 back in March when the strait shut down. Everybody was saying exactly what you’re saying...
Retail investor: & what happened?
Me: Nasdaq made a new all time high a few weeks later and now up over 30% from that point.
Retail investor: with all this still going on??
Me: Yep. The market doesn’t wait for the all clear. It moves as soon as it figures out earnings are
post-image
BZ-0.34%
NDAQ+1.57%
they're longing Celestia?
post-image
TIA+5.21%
2026-10-15 20:14 UTC. Following clean target completions on BTC and SOL in the previous session, WAL/USDT rejected off its upper boundary and pulled back -4.87% from its 0.05385 peak. Price now sits around ~0.05123 USDT, resting in the lower third of its range just below its central equilibrium. Upper resistance is mapped at the SHORT ZONE (0.0535882 - 0.0537676 USDT), while lower demand holds the LONG ZONE (0.0498204 - 0.0499998 USDT) around the primary TARGET ZONE at ~0.052276 USDT. AKE/USDT also holds a clean structure (SHORT: 0.0367231 - 0.0370425 | LONG: 0.0300153 - 0.0303347 | TARGET: ~0
post-image
BTC+0.60%
SOL+1.62%
WAL-17.25%
AKE+21.81%
SNXX-1.18%
#美国9月PPI大超预期
The September CPI data (3.7% year-on-year / 0.6% month-on-month), combined with today’s PPI figures—which show a sharp increase (6.3% year-on-year / 1.3% month-on-month)—have fundamentally altered the short-term macroeconomic outlook. Driven by energy costs, price hikes linked to chip shortages ("chipflation"), and persistent pressures in the housing and services sectors, this trend is causing inflationary pressures to re-accelerate. This leaves Federal Reserve (Fed) policymakers in a very difficult position ahead of their policy meeting at the end of October.
Federal Reserve Pol
post-image
BTC+0.60%
XAUUSD+1.58%
MU+1.93%
NAS100-0.05%
INDEX-3.11%
$AGT A 117% Rally — Can Buyers Hold?
$AGT surged toward $0.0371, with $27.34M in 24H volume. But $2M in liquidity means volatility remains a key risk.
Watch $0.0371–$0.0380 for breakout confirmation. A loss of $0.0350 could signal weakening momentum.
The real test isn't the pump — it's sustained demand.
Would you enter now or wait for confirmation?
#AGT #Crypto #Altcoins
post-image
AGT+110.26%
Social experiment but after confirming villian monkey is behind the “Neymar” token.
I recant my post. I do not endorse this token or encourage anyone to buy after new evidence.
If you still buy, it’s at your own risk. Enjoy your day. 👍🏾
post-image
To the guys who grow out or keep their hair: what hair creams and treatments do you use to give it a great look, texture, and healthy shine?
Abeg recommend!
post-image
Honestly, there is still support below overall, and it has been holding above 82000, but I still couldn’t hold on. I’ll take profits first and redeploy later. 😁
post-image
Which step is the easiest to be fooled by in this $PYTH rally?
When I looked at $PYTH again, I first covered up the 24-hour +13.69%. It’s not that this figure is unimportant, but it is too good at grabbing attention. What really needs explaining right now is that after $PYTH’s sharp 24-hour surge, momentum and continuation are not the same thing. I won’t extrapolate the large move that has already happened into the next leg; I’ll first see whether the price can hold in the new range.
Laying out the market, the current price is 0.09408, with a 24-hour range of 0.08063–0.10094. The 1-hour suppo
post-image
PYTH+16.96%
Musk envisions SpaceX’s market capitalization “very likely” surpassing $100 trillion within 10 years
post-image
SPCX-2.38%
Bitcoin Support and Resistance Levels
live-cover
LIVE607
(New Streamer)World Cup Prediction
live-cover
LIVE68
Why is big money watching the PPI rather than the CPI?
CPI is a statement of fact (what people have already overpaid for in stores). PPI is a look into the future (what costs businesses are bearing now). If raw materials and production become more expensive, producers will inevitably pass these costs on to end consumers within 1–2 months.
Conclusion: High PPI today guarantees high CPI tomorrow. Major players reduce risks based specifically on PPI, without waiting for consumer reports.
#USCPISoon #ShareWeekly
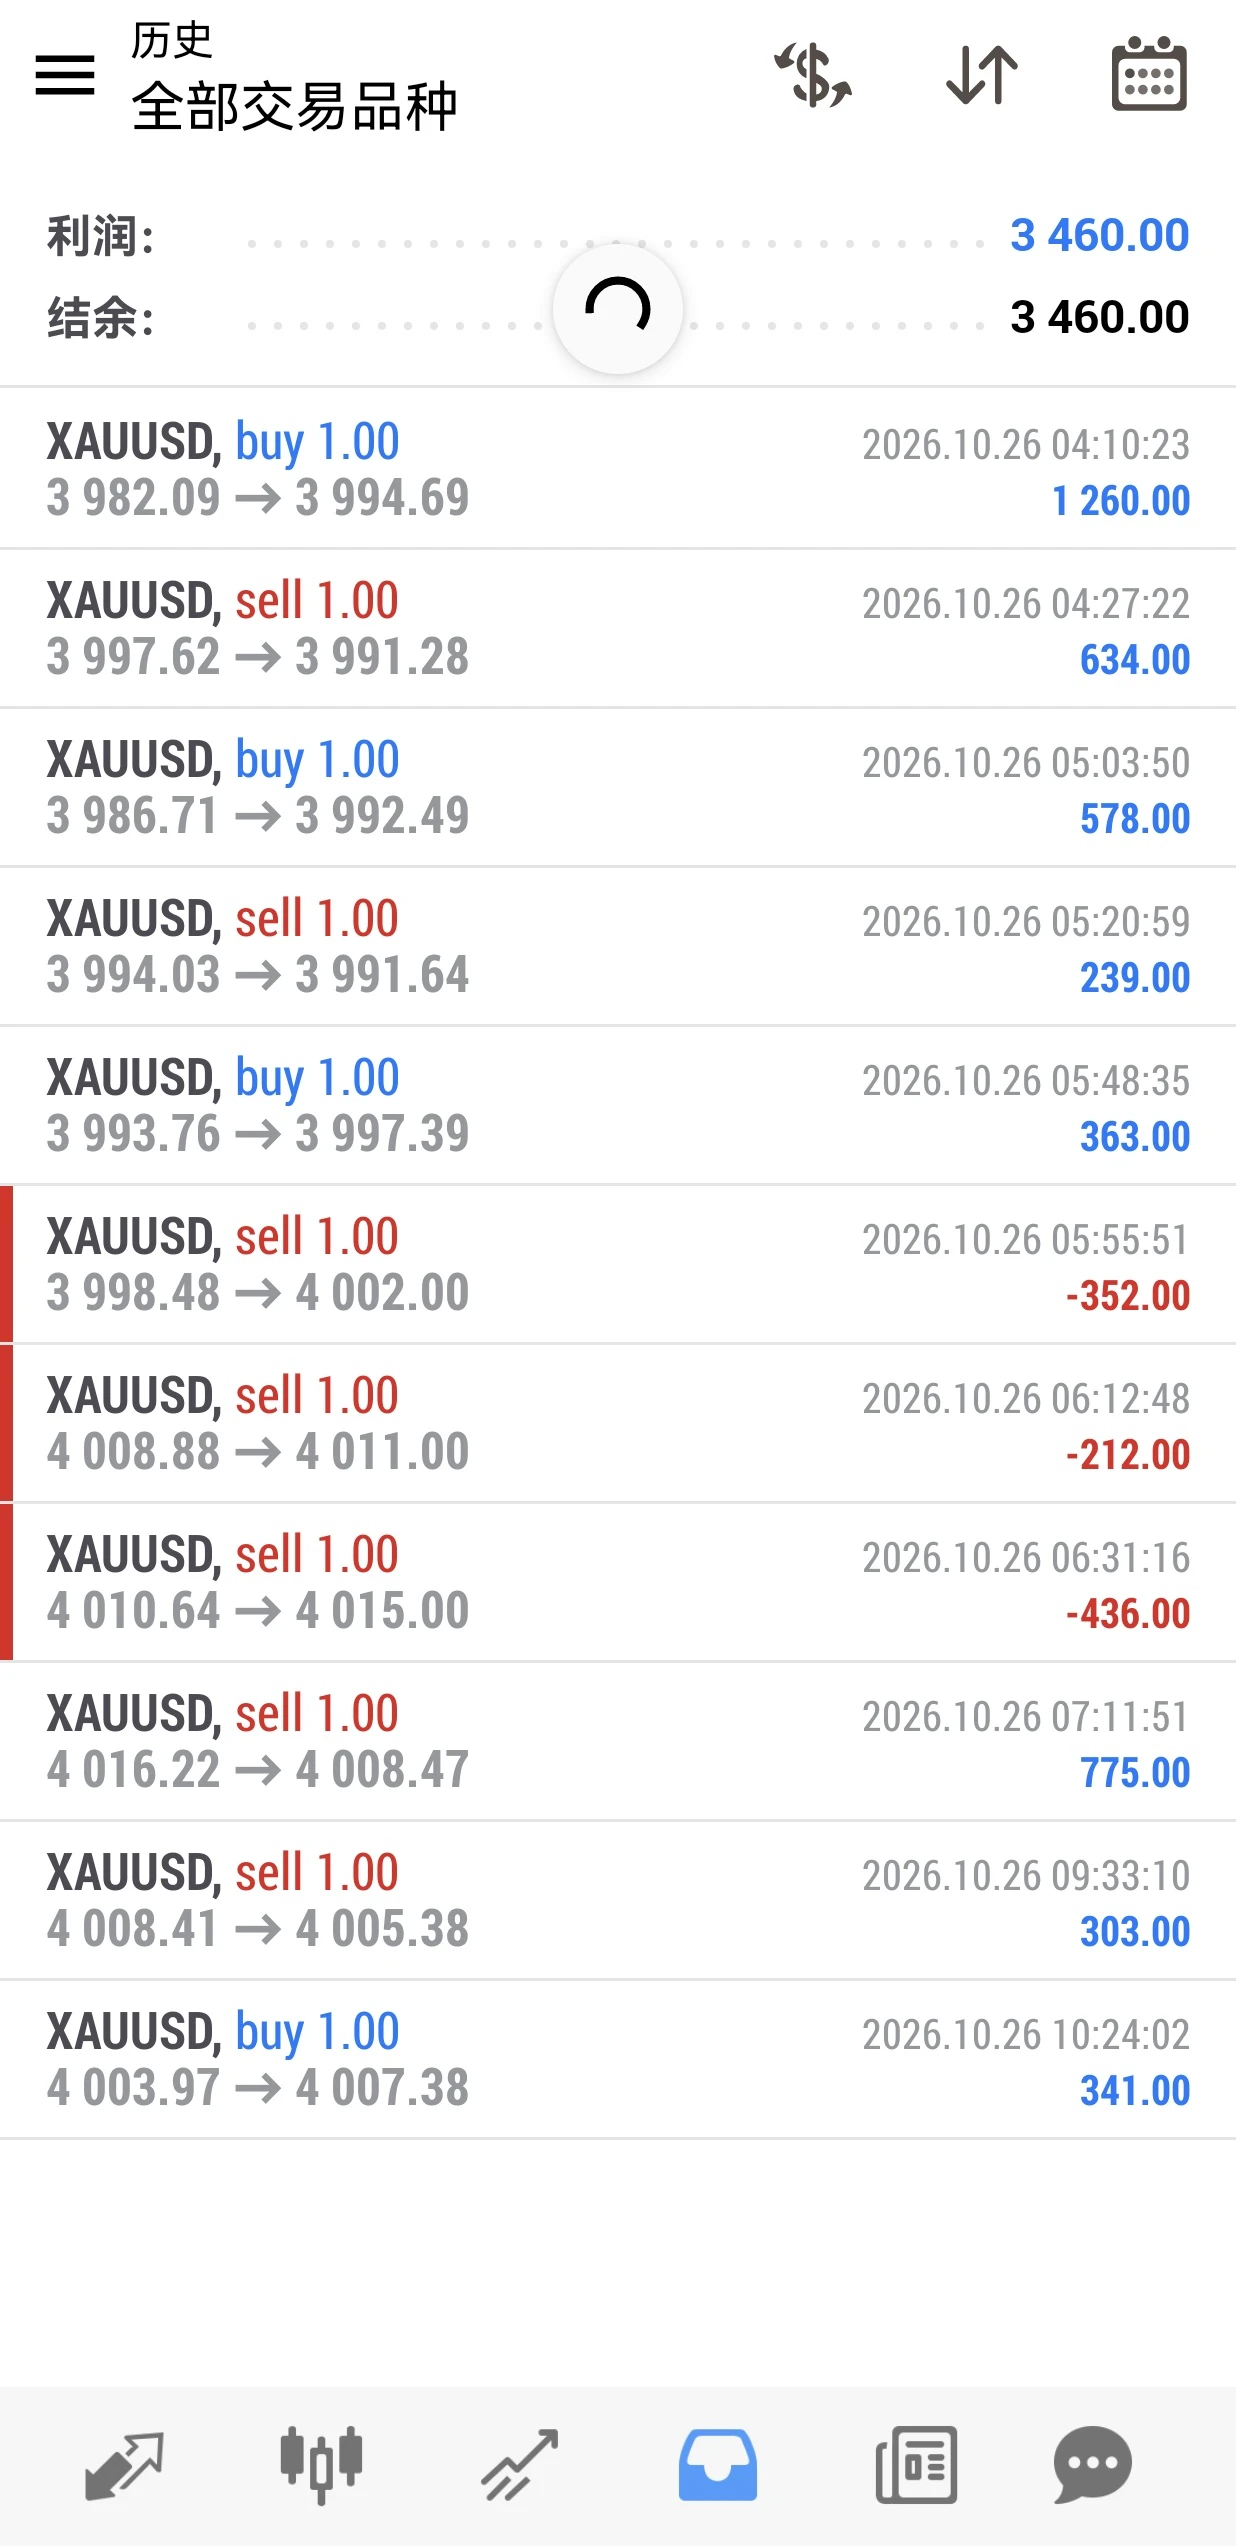
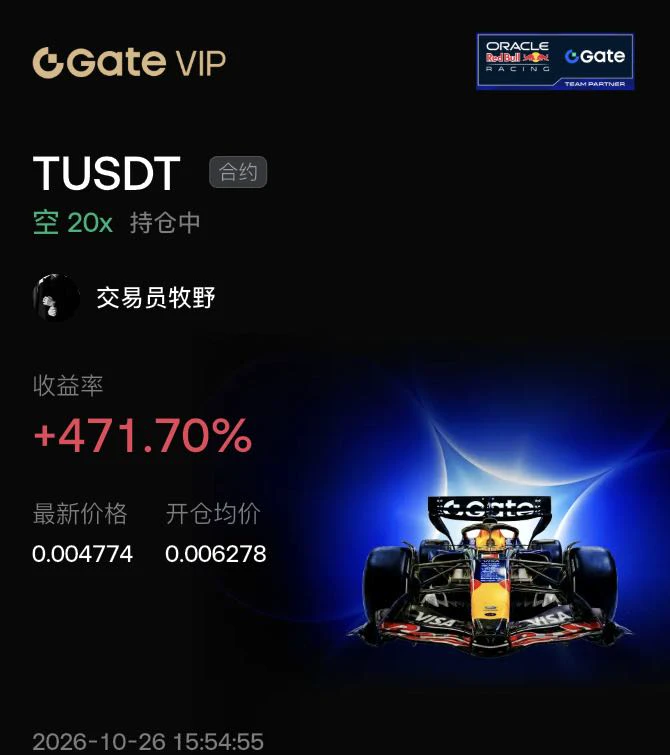
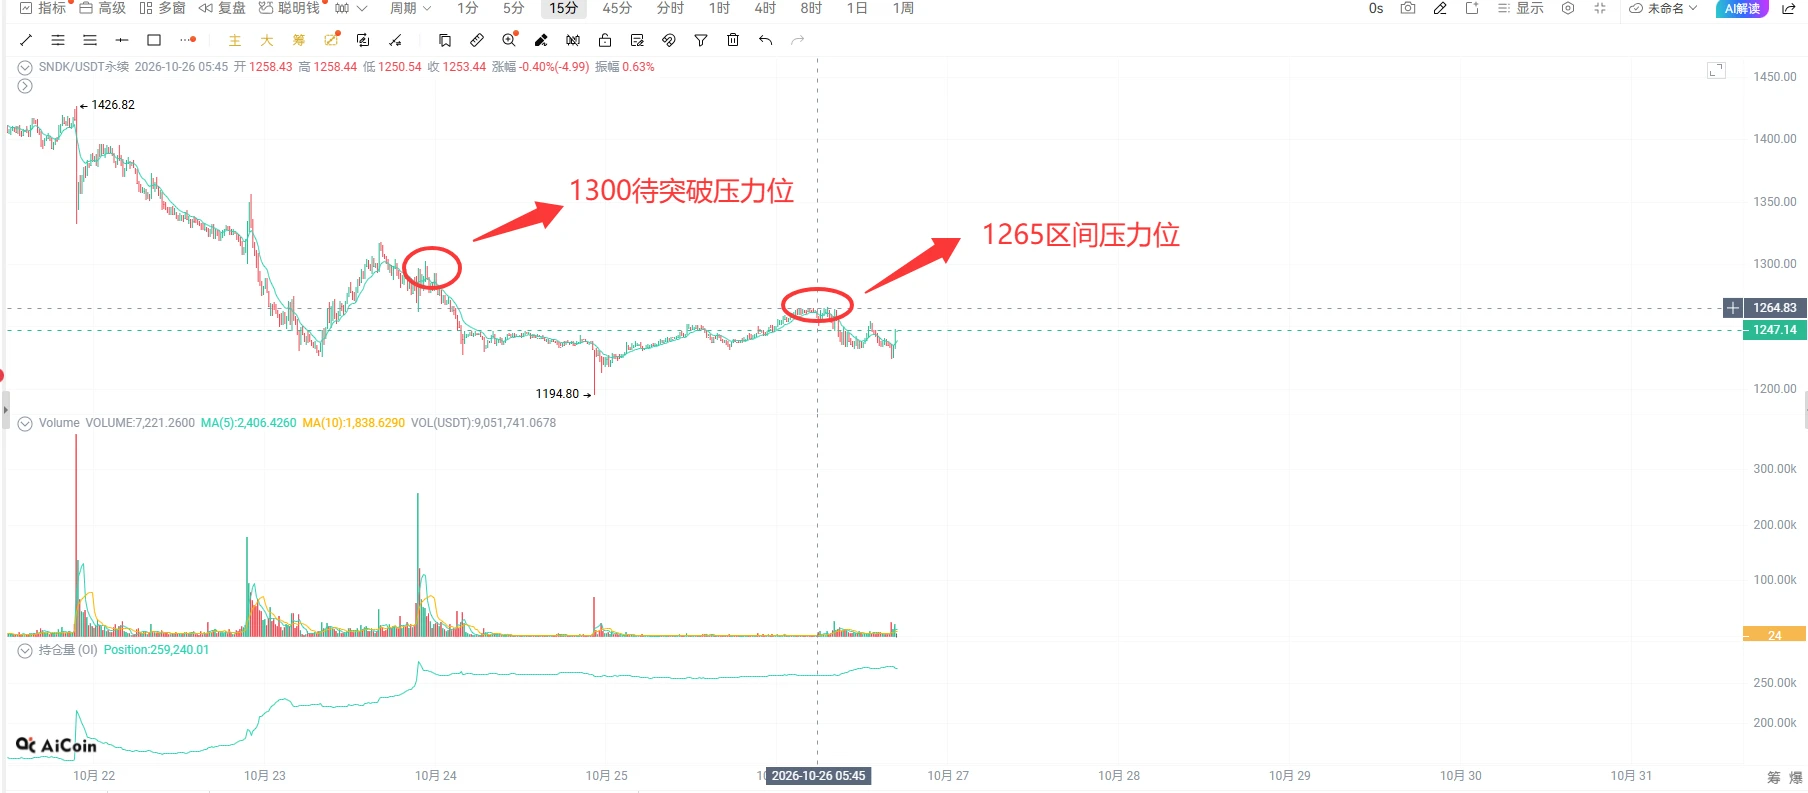
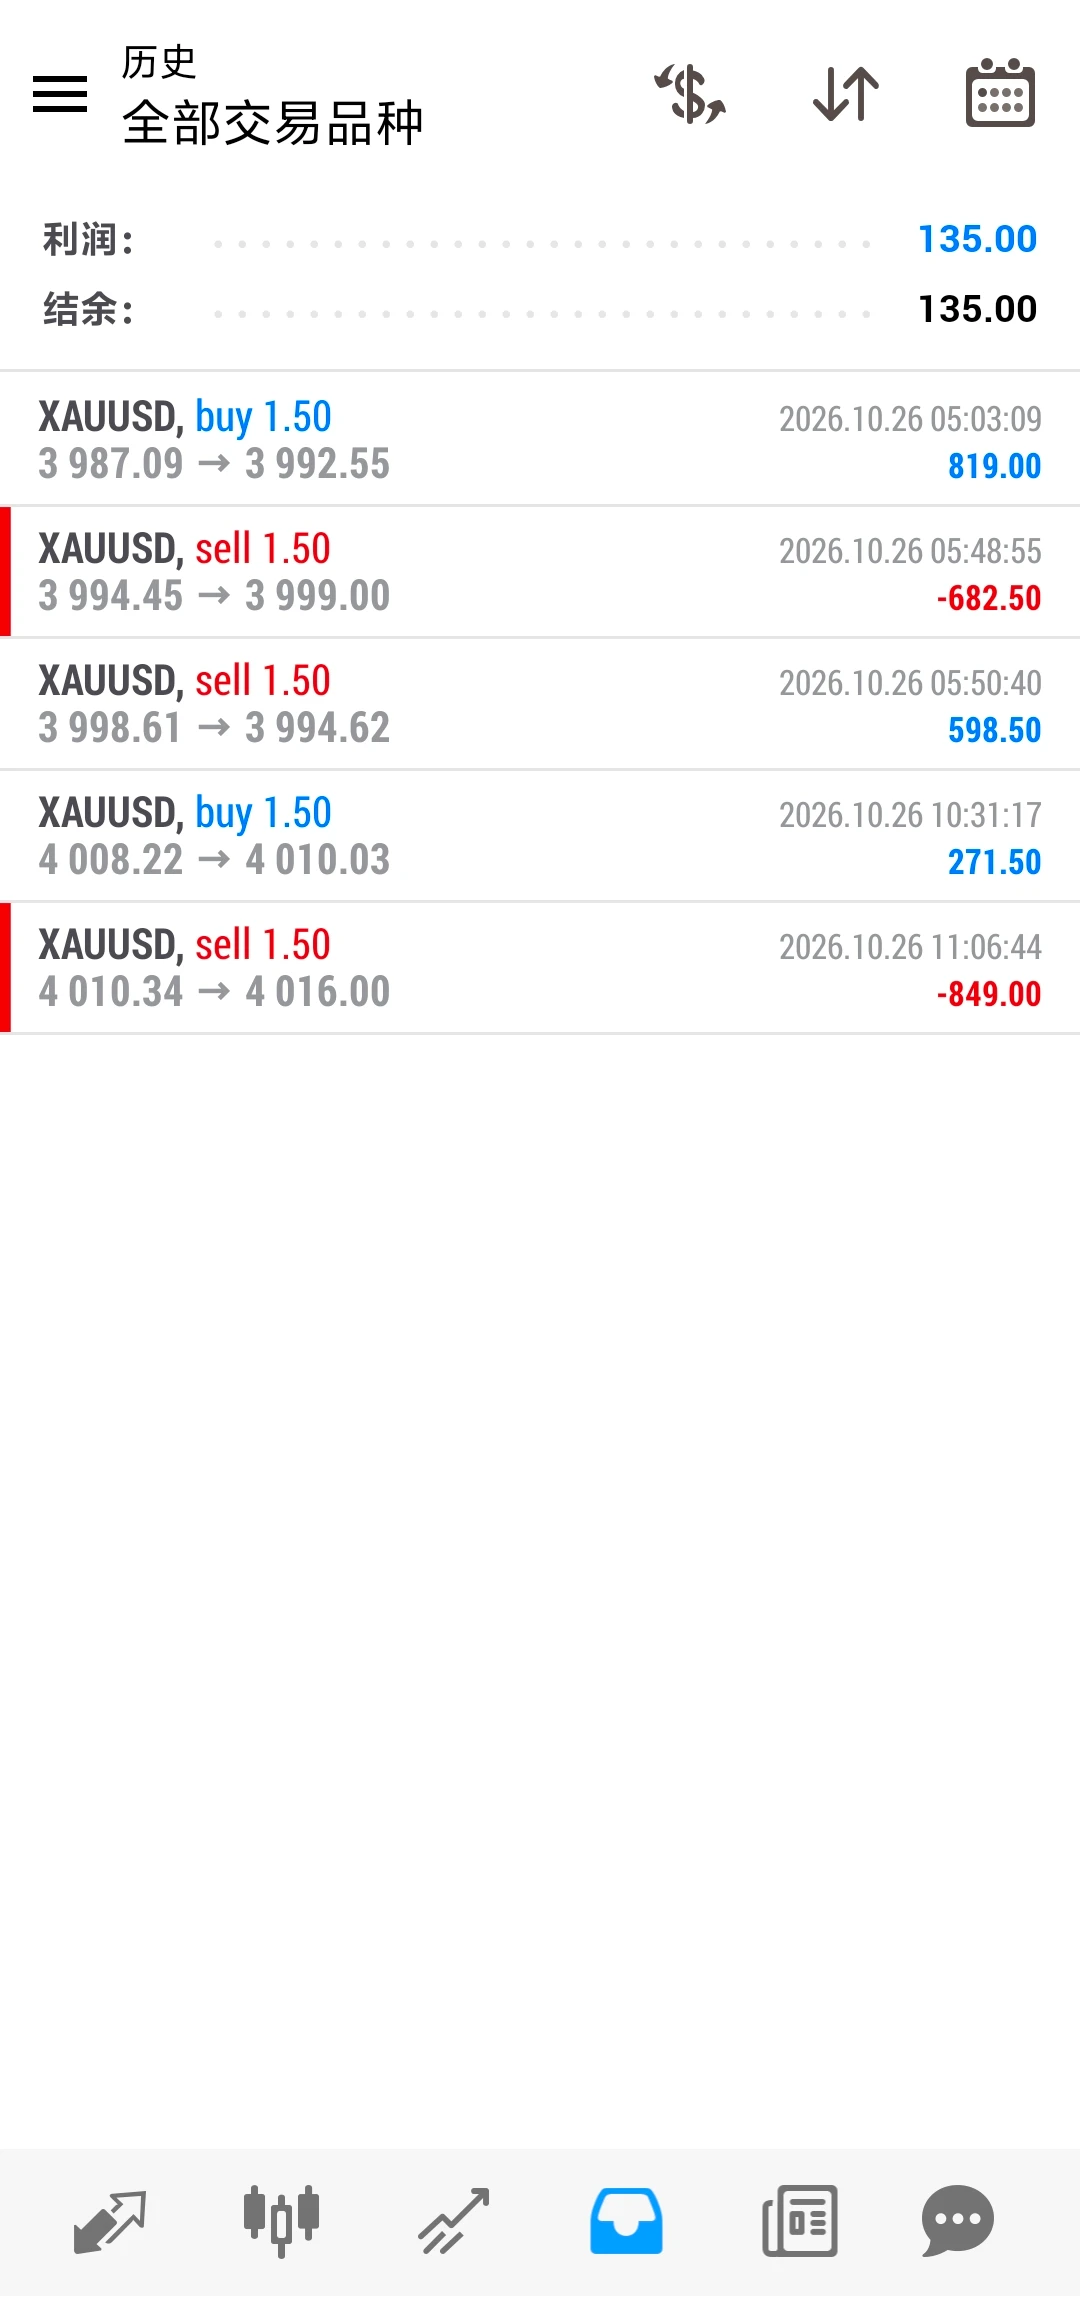
Talk less, do more! Let the results speak! The winning streak continues!
The BTC, XAU, ETH, and ZEC strategies were all perfectly validated.
BTC gave 4,300 points of pullback room🔥
XAU directly delivered 125 points of room🔥
ETH easily moved 224 points south🔥
ZEC delivered 214 points on the pullback🔥
Only what you can see and feel can be called real strength! Who witnessed it all from start to finish? Let me see your results😁😁
$BTC $ETH #Solana大升级定档
BTC+0.60%
ETH+0.83%
As Bitcoin attempts to hold its ground at the $82,400 level, the market is simultaneously navigating a heavy flow of macroeconomic data. Over the past 24 hours, the price dipped to as low as $79,795 before recovering to test the $82,630 mark. This movement cannot be attributed to a single factor; rather, several distinct pressures have come into play at once.
PPI surprise and interest rate expectations
The Producer Price Index (PPI) data released in the U.S. for September came in significantly higher than anticipated. On an annual basis, the PPI rose by 6.3%, reaching its highest level in four
post-image
BTC+0.60%
GT-0.19%
ETH+0.83%
SOL+1.62%
XRP+1.19%
  • 3
  • 2
Recent update | On a steady winning streak every day
There is really no need to pursue a spectacular moment; not stagnating, not retreating, and steadily moving forward is the best answer to life.😁
#日韩股集体大跌
BTC is currently around 82400; after the previous pullback, it has staged a short-term corrective rebound, but the upside follow-through is weak. This is a technical recovery after the decline, with no trend reversal signal appearing for now. The broader structure remains range-bound with a bearish bias.

On the 4-hour chart, the price is below the moving averages, and rebound volume is insufficient, indicating a weak consolidative recovery. The overhead resistance zone is substantial. As long as the price fails to firmly hold above resistance, this rebound is more likely to be a continuation
post-image
BTC+0.61%
Load More

Join 40 M users in our growing community

⚡️ Join 40 M users in the crypto craze discussion

💬 Engage with your favorite top creators

👍 See what interests you

Trending Topics

USSeptemberPPIBeatsExpectations

91.35k Views1.87k Discussing

US September PPI came in at 6.3% YoY, well above the 5.3% market expectation, pointing to renewed producer-side inflation pressure. Weekly jobless claims were 199K, broadly in line with forecasts. Could hotter inflation further reduce room for rate cuts, and what does it mean for $BTC, US stocks, and gold?

DrLinHanSpeaksAtOxfordUnion

135.63k Views1.86k Discussing

JapanAndKoreaStocksPlunge

47.27k Views1.76k Discussing

View More