Share your thoughts
placeholder
Article
Market update
live-cover
LIVE1,511
Insiders are watching SYMBOL like a hawk, and the setup is too clean to ignore.

$BNB /USDT - LONG

Trade Plan:
Entry: 750.02 – 752.28
SL: 740.31
TP1: 759.28
TP2: 764.70
TP3: 772.83

Why this setup?
Why now? The daily trend is firmly bullish, setting the stage for a continuation move. The 1h ATR of 4.516161 shows volatility is just right for a clean push, not a wild chop. The 15m RSI at 48.16 confirms there is room to run before hitting overbought territory. The entry zone between 750.02 and 752.28 aligns perfectly with the 1h price of 751.15, offering a precise risk-defined opportunity. Th
BNB-1.52%
Why is everyone ignoring the obvious short setup forming on XLM?

$XLM /USDT - SHORT

Trade Plan:
Entry: 0.19387 – 0.19505
SL: 0.20012
TP1: 0.19022
TP2: 0.18739
TP3: 0.18314

Why this setup?
Why now? The daily trend is range-bound, which often precedes a sharp directional move, and the 1h RSI at 69.2 signals weakening momentum on the short side. The 1h ATR of 0.002358 confirms enough volatility to reach our targets. We enter at 0.19446 with TP1 at 0.19022 and TP2 at 0.18739, while the invalidation level sits at 0.18989, acting as the hard line in the sand. The entry zone between 0.19387 and
post-image
XLM-2.33%
Nobody is warning you about $ONE /USDT right now.

$ONE /USDT - SHORT

Trade Plan:
Entry: 0.003616 – 0.003876
SL: 0.004996
TP1: 0.002808
TP2: 0.002183
TP3: 0.001245

Why this setup?
Why now? The daily trend is a range, which means the 1h ATR of 0.000521 is compressing against the 1h price of 0.003755, setting up a sharp move. The 15m RSI at 41.19 confirms bearish momentum without being oversold, so the short bias has room to run. The entry zone sits at 0.003746, with targets at TP1 0.002808 and TP2 0.002183, while the invalidation level at 0.001983 acts as the hard line in the sand.

Debat
ONE+25.98%
$SOL GAVE THE BREAKOUT — NOW I’M WAITING FOR THE PULLBACK
SOL pushed from around $96 to $114 pretty quickly and is now cooling near $109.
I like the structure here but I’m not chasing the move. I’d rather see SOL come back into $106.50–$108.50 and see if buyers defend it.
🟢 $SOL LONG
Entry: $106.50–$108.50
TP1: $114.50
TP2: $118.00
TP3: $123.35
SL: $103.50
Structure: Bullish above $103.50
Liquidity: $114.50–$118
Zone of Interest: $106.50–$108.50
If buyers show up around the zone, the previous high is the first level I’m watching.
If SOL loses $103.50 with strong selling volume, the setup i
post-image
SOL-2.92%
$AR Short-term bearish bias; rebounds are windows for bears to add positions, not signals to buy the dip. Reasons: down 10.49% over 24h, with the price at 4.232 already near the lower Bollinger Band at 4.19179. MA5 at 4.3084 and MA20 at 4.3083 are almost overlapping and flat, indicating that bullish momentum has been disrupted; RSI at 48.4 is in the neutral-to-weak zone, while the MACD histogram remains negative at -0.02941, meaning the bearish structure has not been repaired. The key factor is funding: the funding rate remains at +0.0100%; the price has plunged while the rate has not turned n
post-image
JUST IN: Wall Street expects the U.S. to issue roughly $1 trillion in short-term debt as borrowing costs rise. This could signal ongoing funding needs and potential pressure on liquidity windows in macro markets. $BTC $ETH
post-image
BTC-1.10%
ETH-1.51%
#Glassnode称BTC呈牛市特征
#GateSquareMidAutumnReunion
Bitcoin has recovered strongly, but the bigger question is whether this recovery can develop into another sustained expansion. Glassnode’s recent analysis remains constructive, particularly because entity-adjusted SOPR is holding above 1. When this signal is combined with Bitcoin’s price recovery, ETF flows, realized profit, selling pressure and market structure, the picture looks bullish but still requires confirmation.
Bitcoin recently moved back above $80,000 and traded around the $80,300–$81,300 area, with the September 19 range reaching ro
post-image
BTC-1.10%
ETH-1.51%
The more divided the market is, the more people look for opportunities in Memes
#GateMemeCarnivalSeason
BTC is grinding back and forth above $80,000, ETH is doing its own thing, and the altcoin market has split into two camps. In this kind of market, those suffering most aren't the ones holding positions, but those sitting in cash waiting for direction. Those waiting for a pullback have missed the ride so far, those chasing highs are stuck halfway up the mountain, and only those watching narratives and capital flows are still looking for opportunities.
Here's the bottom line: the Meme sector i
MU+3.80%
The daily chart has fallen into sideways trading, and BTC’s three tests have not broken support. On the lower time frame, first watch for a pullback, then look for a rebound in the third wave before switching. Tonight, open an initial short on ETH at 2580, and watch 2550–2530 on the pullback. If it breaks below the range low support, stand by and observe...#BTC重回80K $ETH
ETH-1.52%
Can MSTR Continue to Amplify BTC’s Market Rally? These Three Signals Are Key
Back to the core question: Can MSTR continue to amplify BTC’s upside? My answer is—possibly, but only if all three signals are present at the same time.
Signal One: mNAV remains above 1. MSTR has risen 48% over the past month, while BTC has gained 12%, indicating that mNAV is expanding. But how long the premium can last depends on the market’s confidence in the “BTC balance sheet” model. If mNAV compresses back toward 1, the efficiency of raising funds to buy BTC will decline, the flywheel will slow down, and MSTR’s e
BTC-1.09%
good breakout and retest from $SUI , added some
~85% off its $5 ATH
was a loud L1 which lost its shine and revenue but this kinda charts do well in bull regardless of fundamentals
post-image
SUI-0.29%
Watching the chart until I got annoyed, I actually saw things more clearly after turning it off. When my eyes weren’t glued to it, my heart didn’t feel as anxious either. A few days ago in the afternoon, $MAGMA stayed range-bound at the bottom for a long time, then held firm after a pullback. The feeling of funds quietly entering was obvious, so I suggested gradually taking long positions.

During the repeated intraday swings, many people were worn down and left, but I chose to hold a little longer. Entered at 0.17163, now at 0.22607, with floating profit of +627.07%. Nailed the rhythm—feels
post-image
MAGMA-6.06%
BNB-1.52%
DOGE-3.83%
My current Meme position allocation and why I set it up this way
Let me talk about my current Meme positions.
PEPE accounts for 30%, DOGE 20%, WIF 10%, and the remaining 40% is in USDT, waiting for opportunities.
Why this allocation? PEPE has both volume and a narrative, with healthy technicals, making it the asset with the best risk-reward ratio at present. DOGE is stable and less volatile, making it suitable as a core position. WIF has high upside but also high risk, so I keep a small position. The 40% in USDT is reserved for picking up tokens after a sharp crash.
Overall strategy: Hold more
WIF-5.18%
Woke up to some crazy charts today and had to share this 🤯 The crypto market just flushed out 345 million dollars in liquidations, and short sellers took almost all of the damage. But the real star of the show was $ZEC , which randomly pumped 17 percent and triggered a massive 56 million dollar short squeeze on its own. It is wild how quickly the tables can turn 💸
This whole move shows just how fast shorts can get squeezed when the market decides to run. Definitely stay safe out there if you are trading with size today ⚠️
#Zcash #CryptoTrading #GateIdleEarnAutoYieldUpTo3% #GateLaunchesTrenche
post-image
ZEC-5.49%
  • 9
  • 2
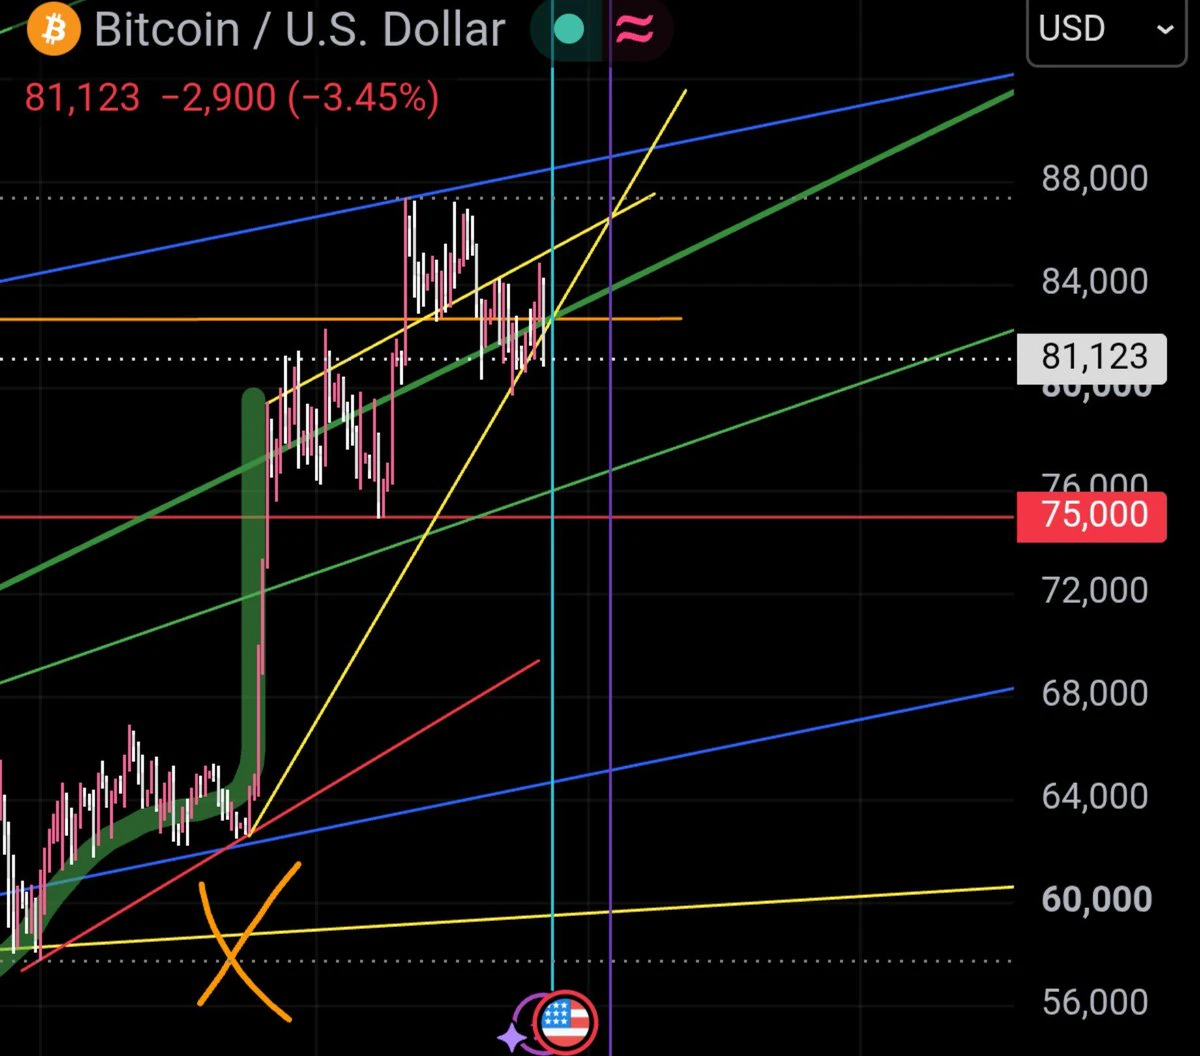
$BTC momentum is holding up.
RSI is back in its 55–63 support zone, the same area that preceded the last breakout.
Price is holding $79K–$81K after the channel breakout.
Hold $79K and I'm watching $82K–$85K next.
post-image
BTC-1.10%
#晒出我的合约收益 this fucking thing has never gone up at all.
post-image
🔥 The more divided the market, the more people look for opportunities in Meme
As the market diverges, trading strategies also start going their separate ways 👀
Some are waiting for a rebound, some are continuing to watch, and others are already looking for the next one.
Bring #GateMeme狂欢季 to Gate Square to share your trades and judgments 👇
🎯 The more you post, the more chances you have to win, with up to 10 USDT per draw
📈 Your first valid trade-sharing post each week is guaranteed to receive a 50 USDT futures position experience voucher
🍀 Complete copy trading for a chance to win weekl
MEME-2.10%
  • 1
  • 1
Load More

Join 40 M users in our growing community

⚡️ Join 40 M users in the crypto craze discussion

💬 Engage with your favorite top creators

👍 See what interests you

Trending Topics

MSTRTopsNasdaq100

74.08k Views2.98k Discussing

Strategy (MSTR) has gained about 48% over the past month, making it the best-performing stock in the Nasdaq 100, while Bitcoin rose roughly 12% over the same period. The company holds 845,050 BTC with a cumulative cost basis of about $63.73B. MSTR is not a pure Bitcoin proxy — its price swings can be more extreme. Can this rally last?

Gate Tops 24H Net Inflows Among Exchanges

26.43k Views3.69k Discussing

BTCRetakes80K

57.12k Views60.57k Discussing

View More