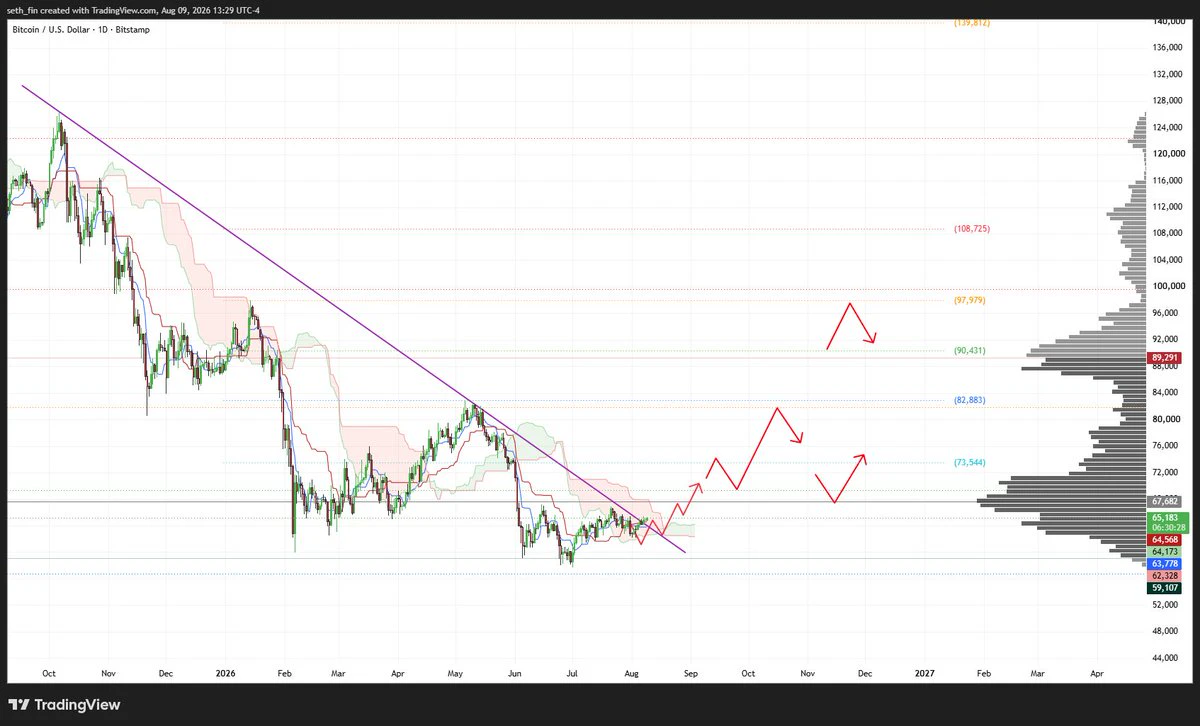








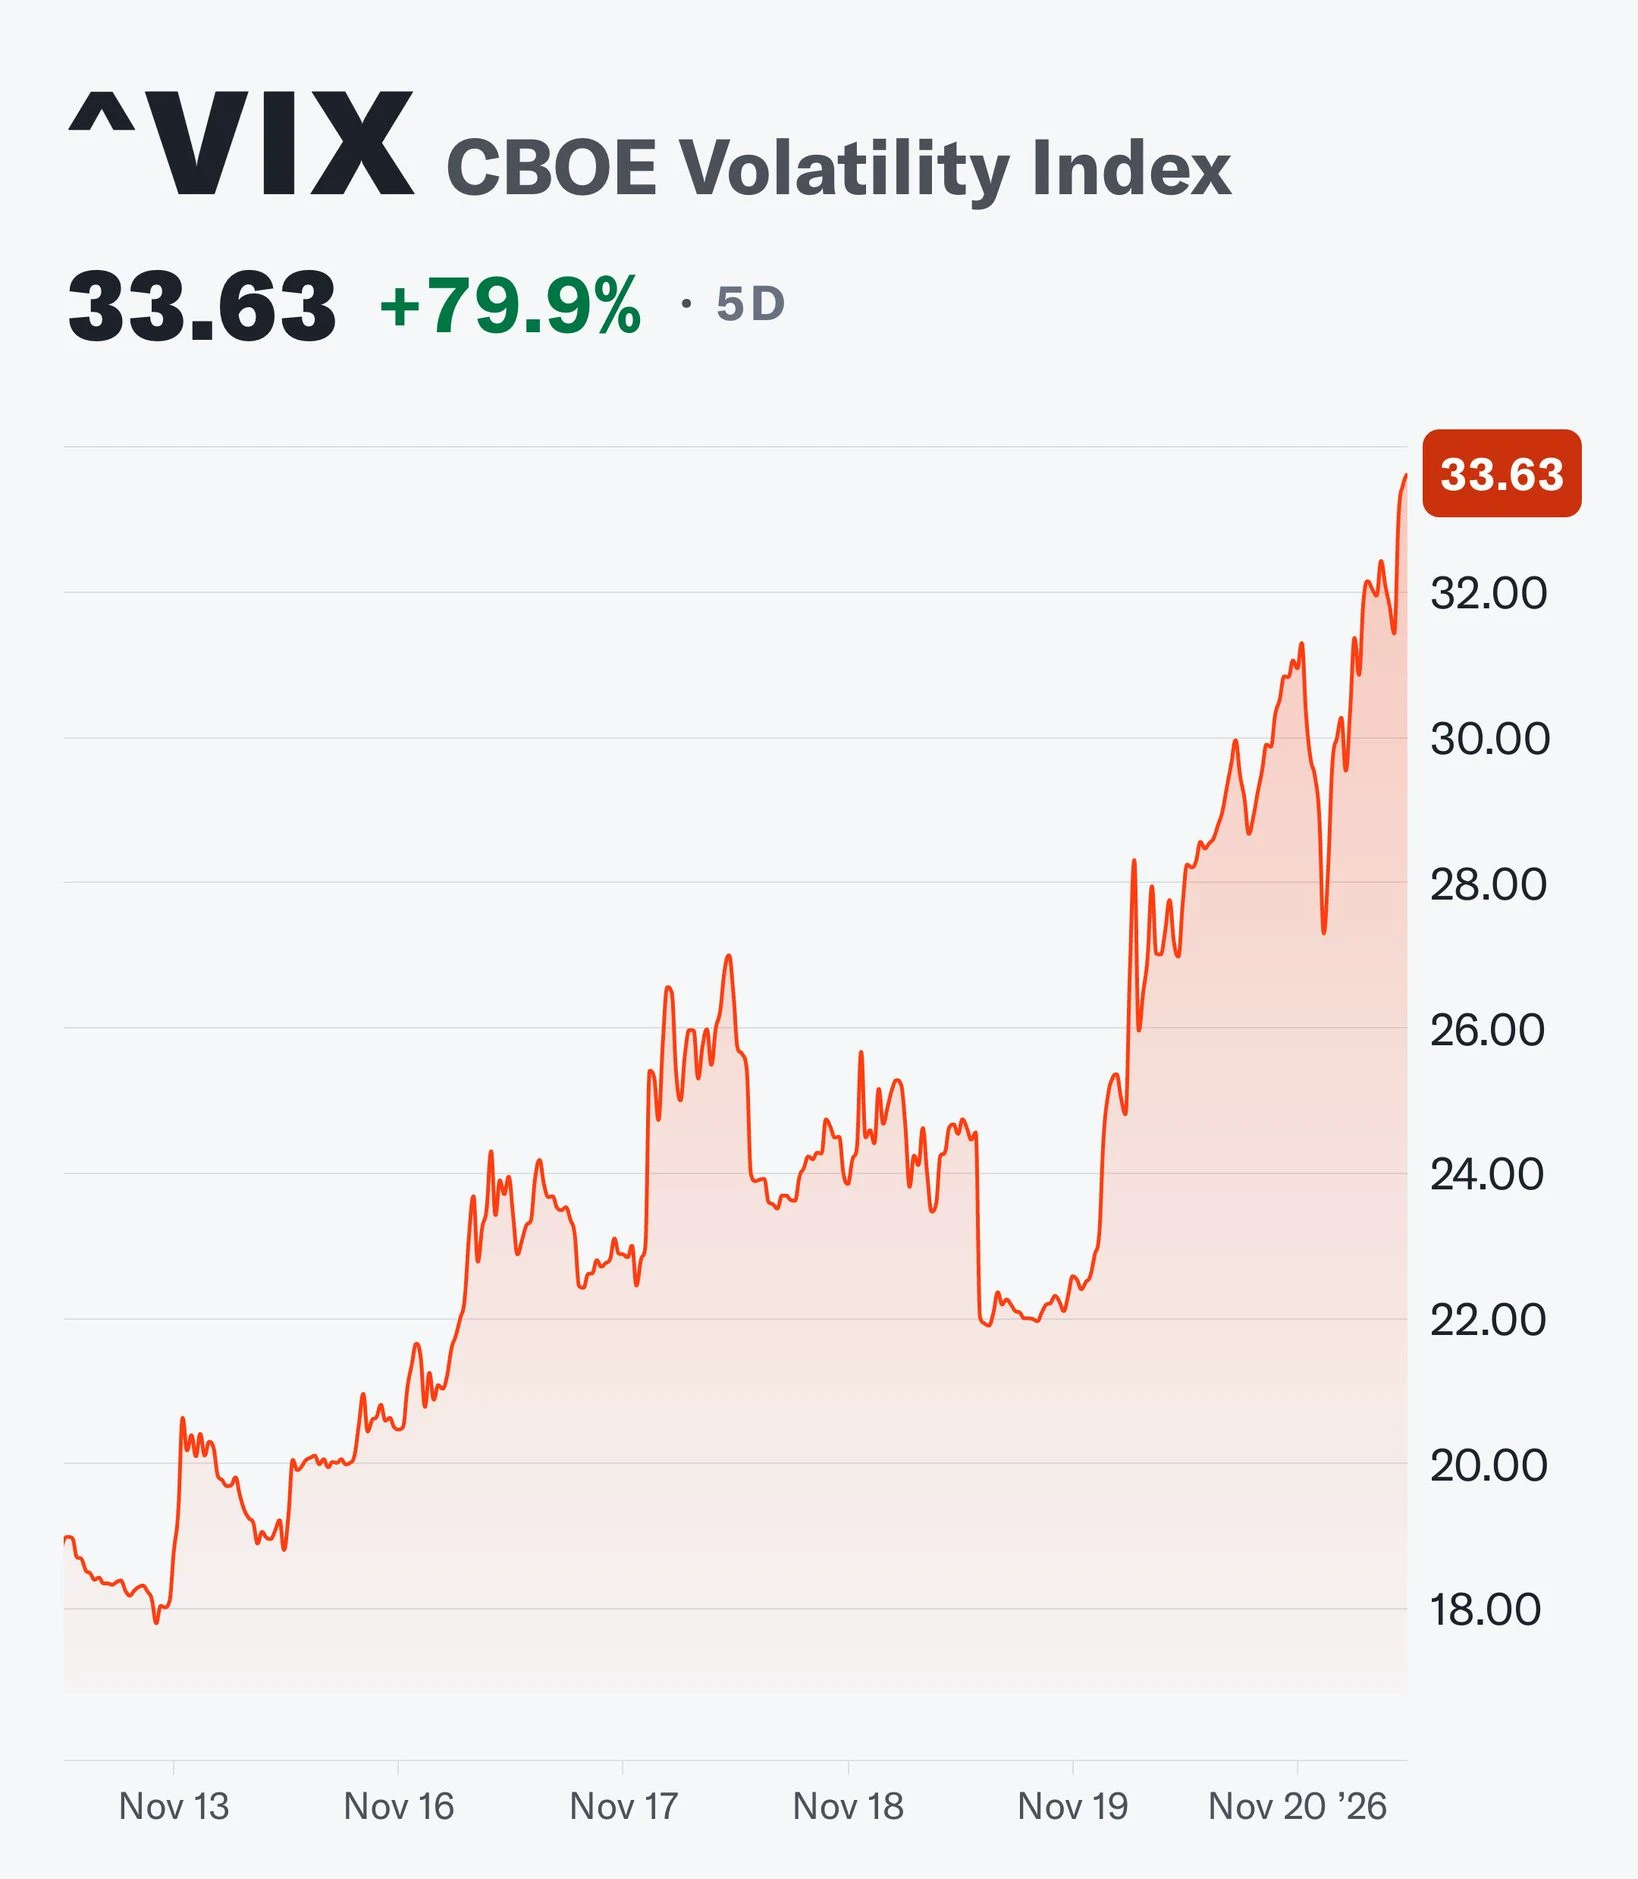
The data at hand indicates that the market is at a highly critical psychological threshold. The decline of the Fear and Greed Index to a level of 10 is not merely a "sell" signal; it serves as a mirror reflecting the collective sentiment of all market participants. Let us analyze this situation calmly, in light of the figures and investor behavior.
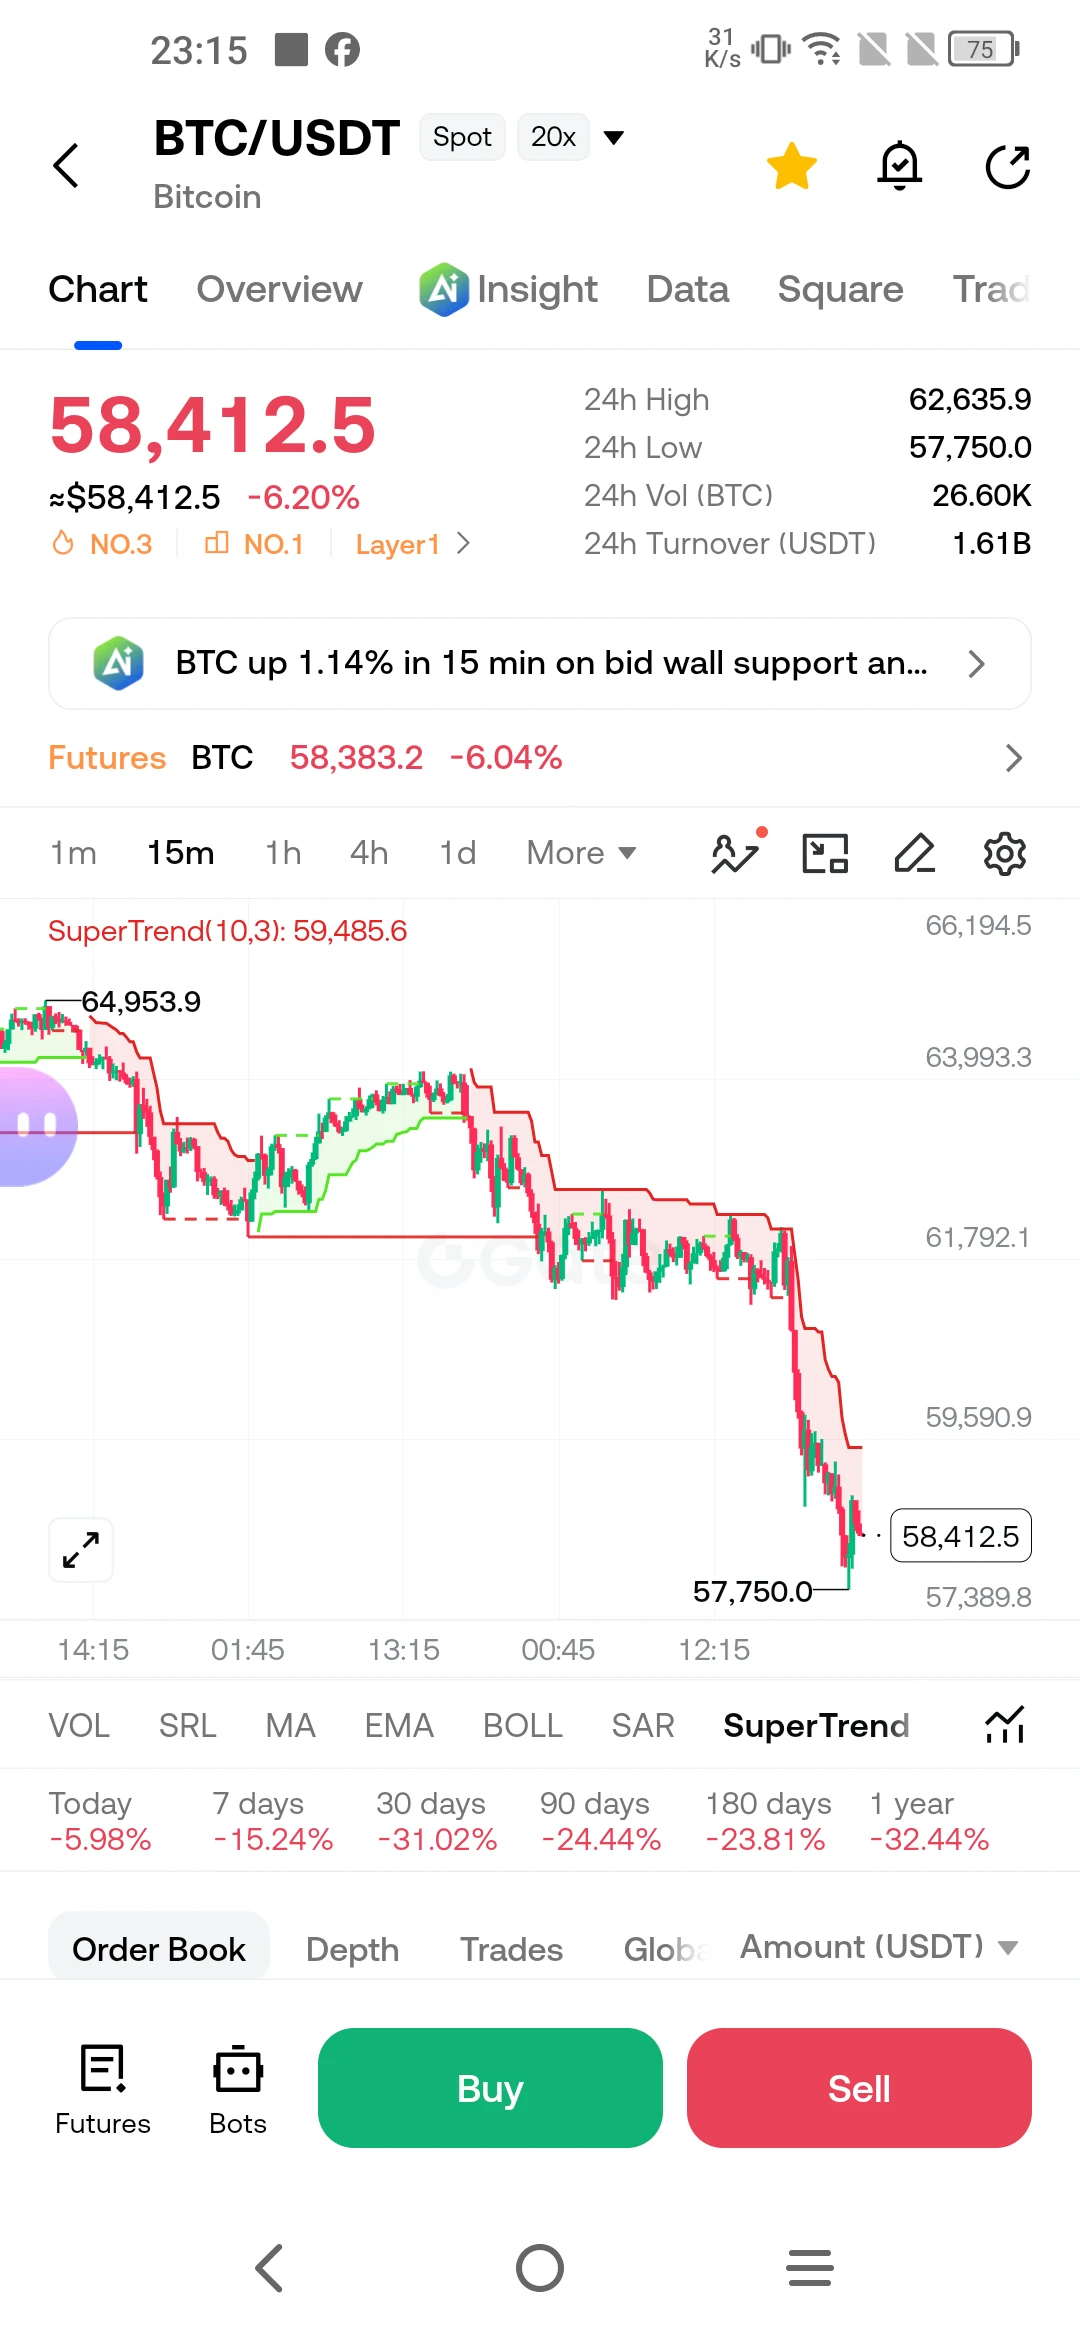
First, let’s examine the concrete data behind this downturn. As of November 20, 2026, Bitcoin is trading at approximately $58,412, having dipped as low as $57,750 during the day—its lowest level since early July. The decline stands at 15.24% over the past week and exceeds 31.02% over the past month. Market capitalization has fallen to $1.16 trillion, while trading volume hovers around $1.61 billion. Ethereum is under similar pressure, trading at $1,749, with a weekly loss of 10.8% and a monthly decline of 29%.
The primary catalyst for this decline is the withdrawal of institutional investors. On November 19, U.S. spot Bitcoin ETFs saw a net outflow of $582.3 million. Of this, $541.1 million originated from BlackRock’s IBIT fund—the largest single-day outflow since the fund’s inception. Total outflows for the month of November have reached $3.47 billion. This suggests that institutional demand has effectively come to a halt, or has even begun to reverse.
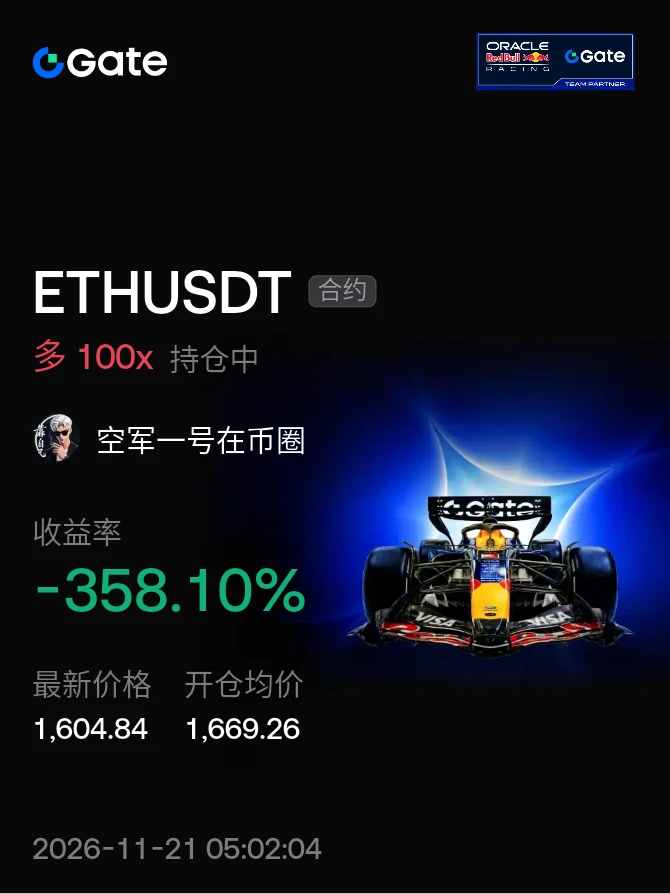
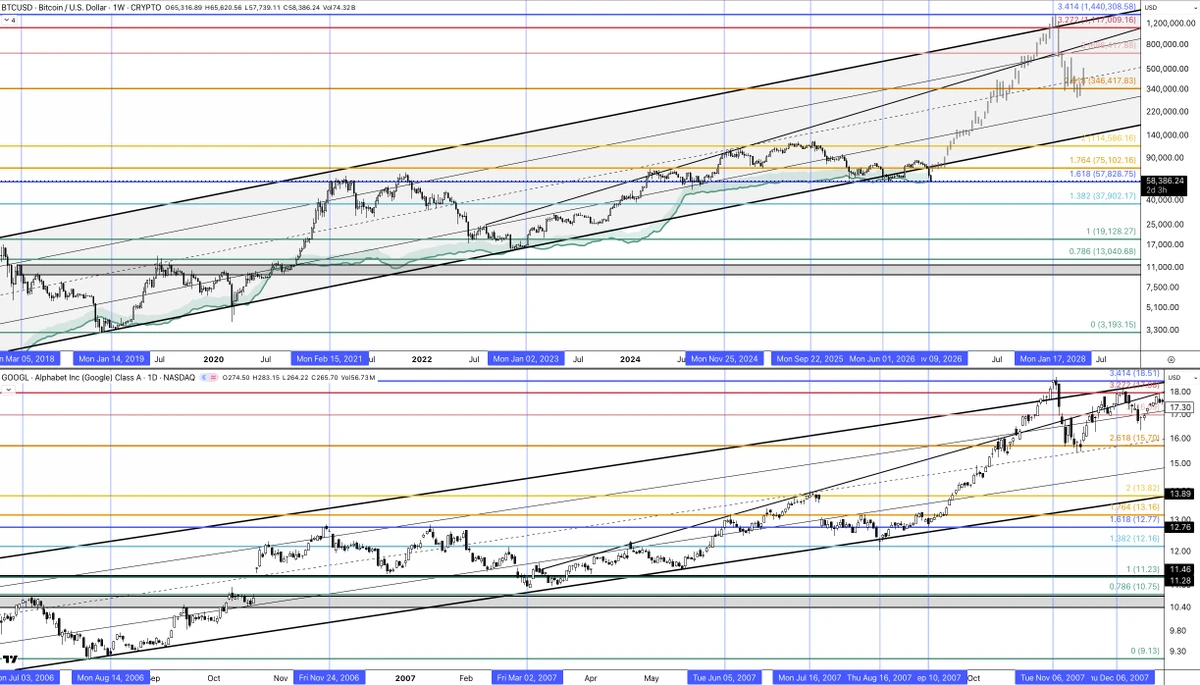
The situation regarding leverage is equally unsettling. Nearly $700 million in liquidations have occurred over the last 24 hours, with $167.21 million coming from Bitcoin long positions. In other words, the market has penalized those betting on an upward move. As shown in the screenshot, Bitcoin has fallen below the SuperTrend indicator ($59,485), presenting a technically weak outlook.
What Does Extreme Fear Signify?
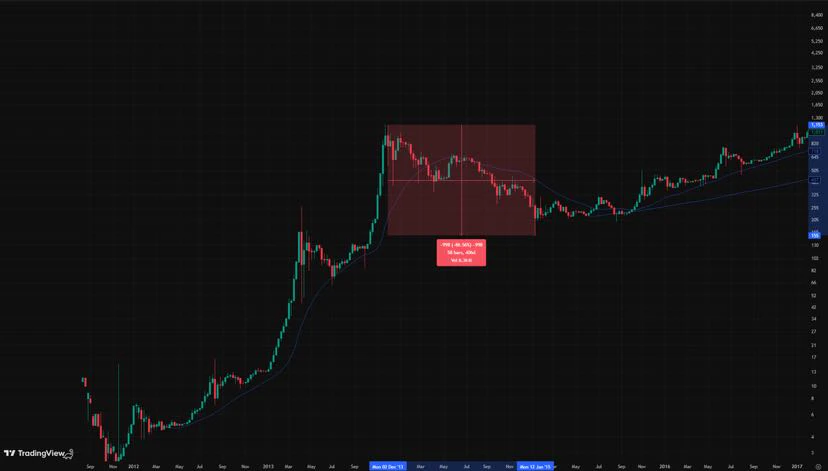
A reading of 10 on the Fear & Greed Index indicates that 90% of investors are gripped by "fear." However, a critical distinction must be made: an index value of 10 does not necessarily mean the price is near a bottom. Historically, periods of extreme fear can persist for months, with each "bottom" potentially followed by an even lower one—much like in 2022, when the fear index remained at low levels for an extended period. Bitcoin is currently experiencing its seventh consecutive weekly decline, marking its second-longest losing streak since 2022.
Yet, there is a "glimmer of hope." According to CryptoQuant data, while 30-day visible demand remains in negative territory at -247,700 BTC, large-scale holders—or "whales"—continue to increase their Bitcoin reserves. This suggests that while some institutional investors are pulling back, major long-term players are quietly accumulating. This divergence could be a signal that the market is laying the groundwork for a bottoming formation, though it is not sufficient on its own.
Why Now?
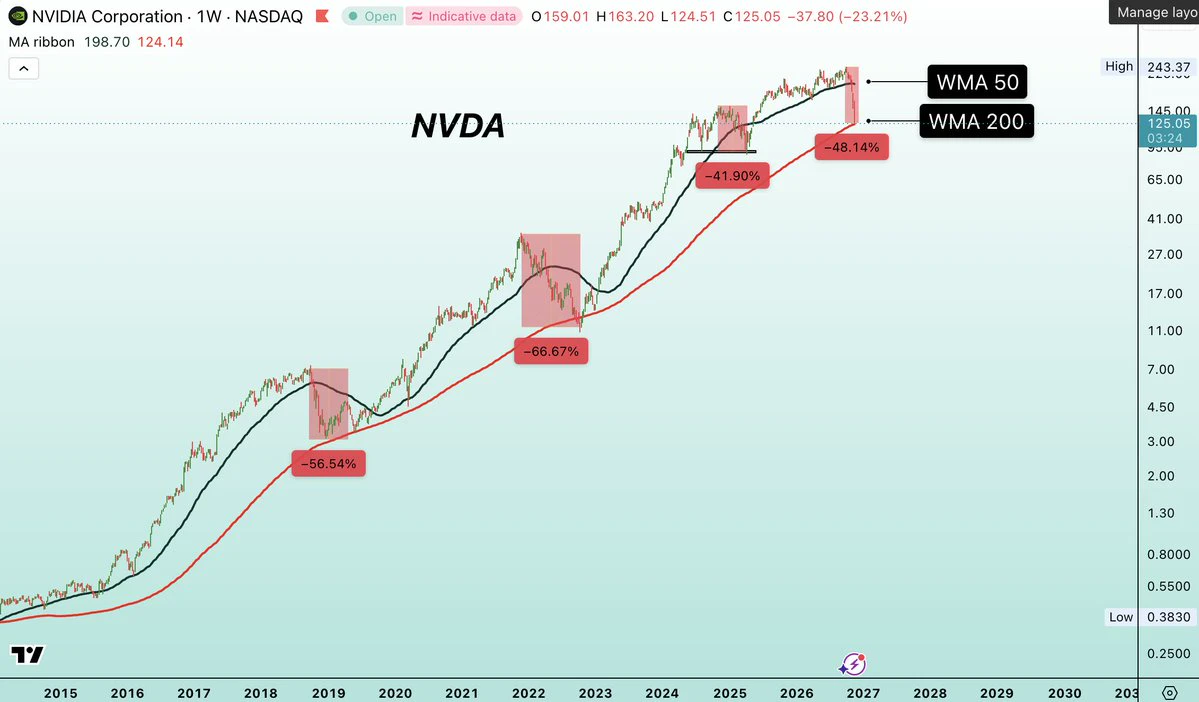
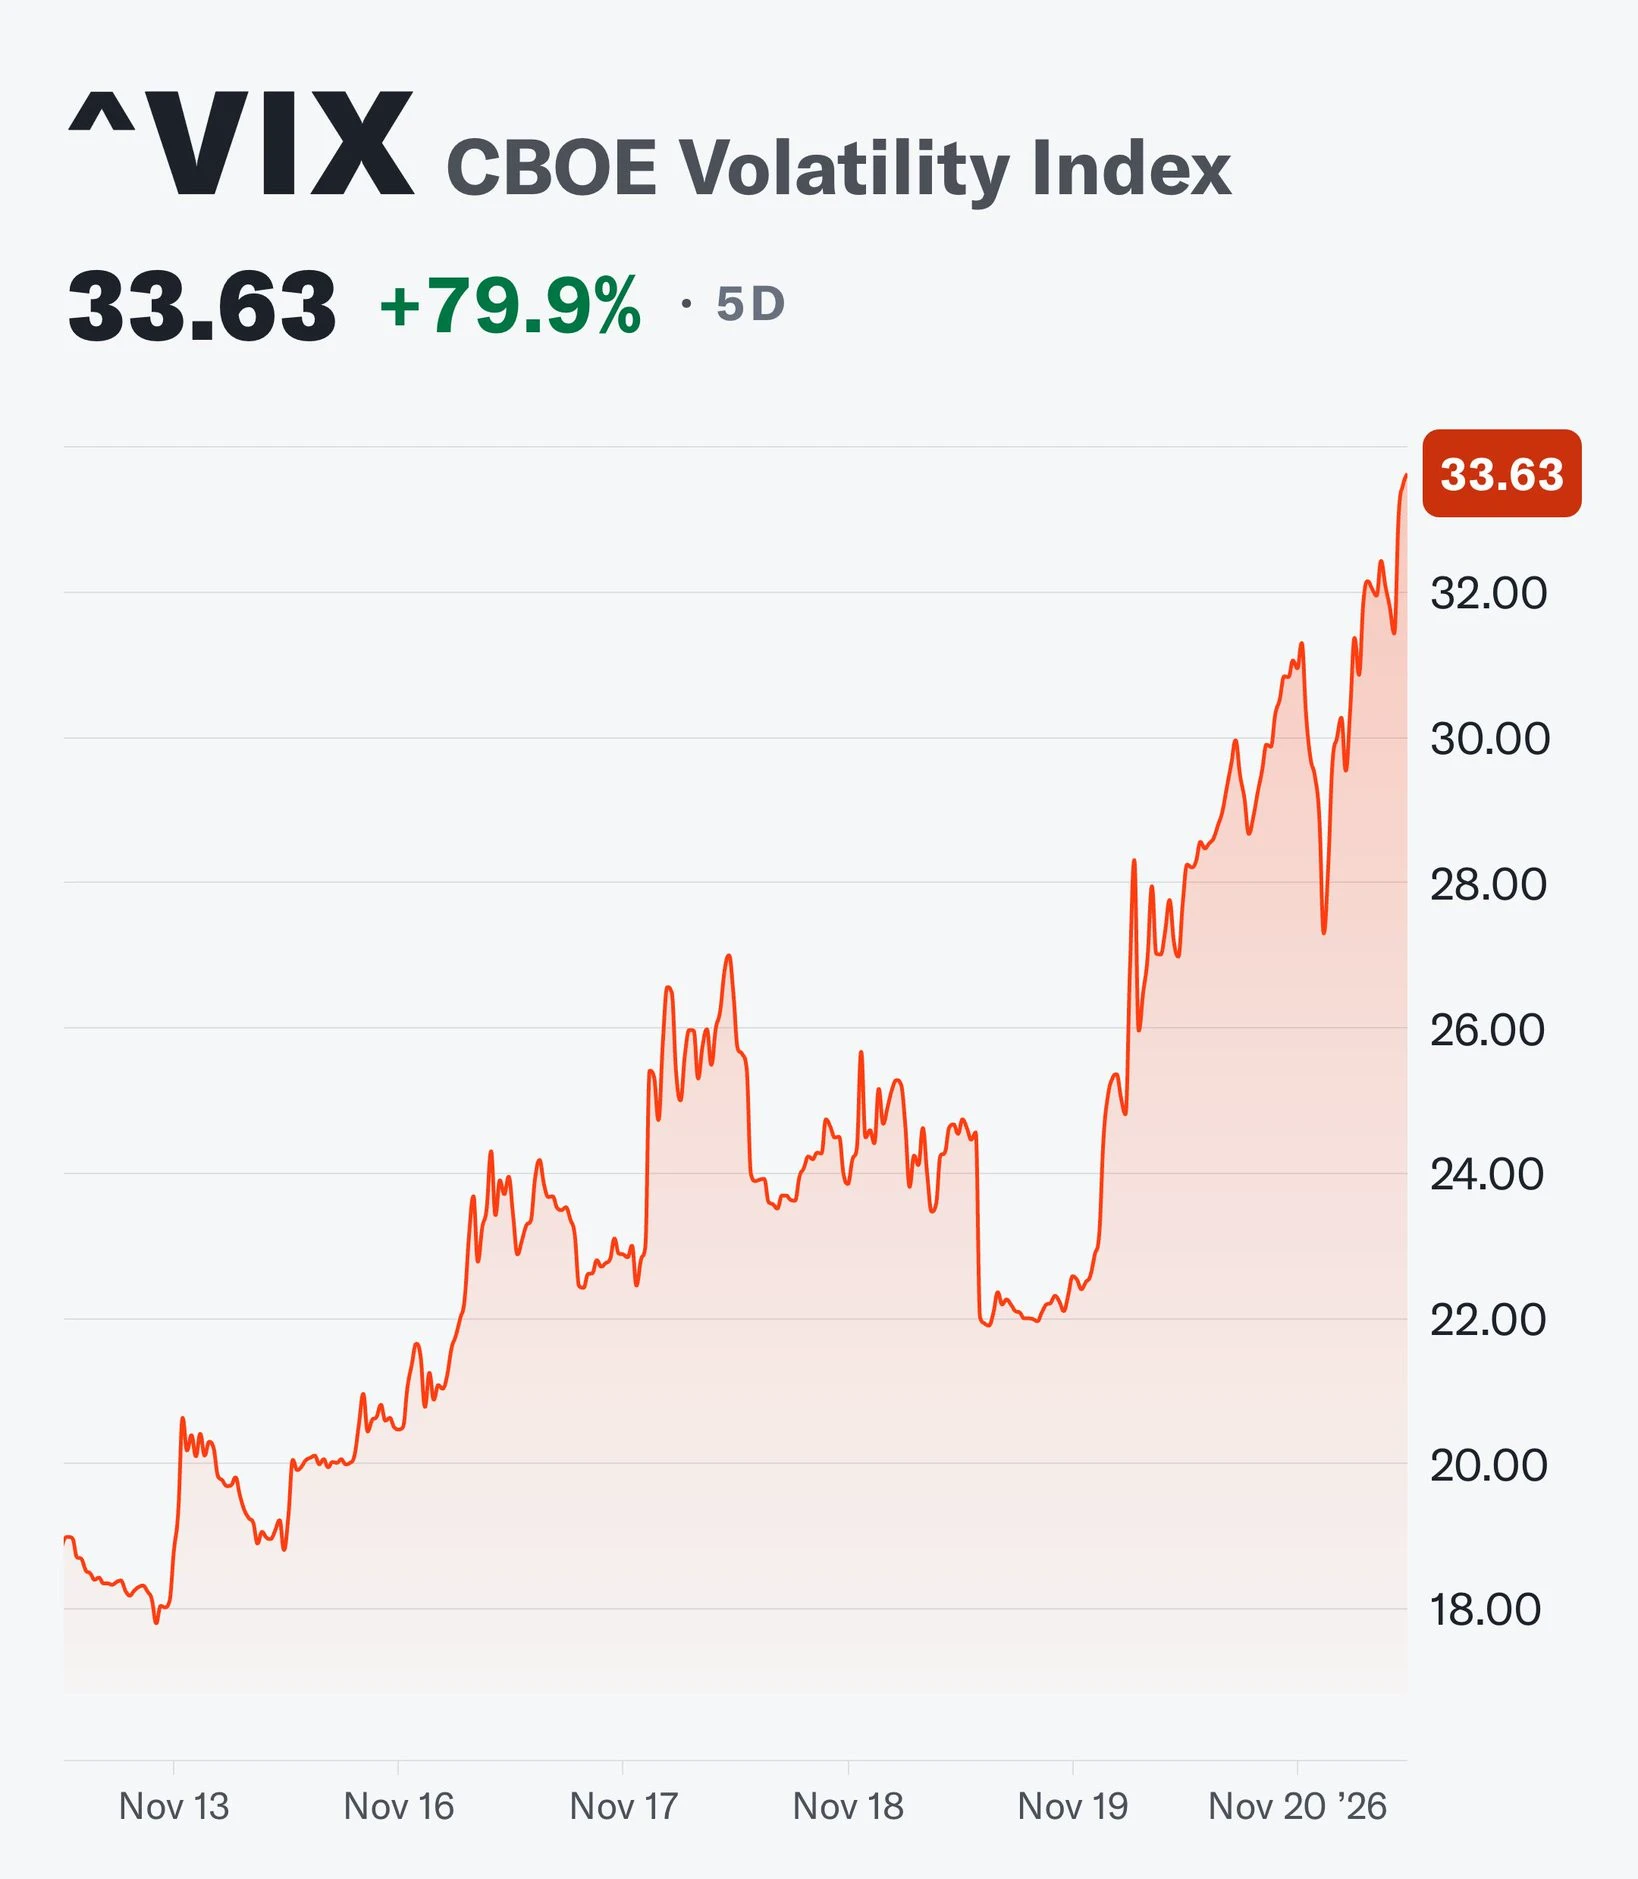
This decline is not driven solely by dynamics internal to the crypto market. The Federal Reserve’s hawkish stance and higher-than-expected inflation data are dampening the appetite for risk assets. Weakness in technology stocks is directly impacting Bitcoin; the 2.25% decline in the Nasdaq following Anthropic’s IPO, combined with a six-day losing streak for the S&P 500, has rippled through the crypto market.
Rather than panicking in the face of this situation, it is best to focus on three key questions. First: Are you using leverage? If so, your chances of maintaining your position during such waves of liquidation are slim. Second: What is your time horizon? If you are thinking in the short term, staying on the sidelines during periods like this is not an act of cowardice—it is a strategy. Third: Have you defined your price levels? If the price falls below $57,750, the next support zones may be tested; keep this level in mind.
In short, the market is currently gripped by "extreme fear." While this might look attractive to those hunting for opportunities, it also demands caution. When the Fear & Greed Index sits at 10, the smartest course of action is to stick to your plan rather than trying to make predictions.
Do you believe this environment of extreme fear presents an opportunity for long-term accumulation, or does it signal that the market is bracing for a deeper correction?
#FearAndGreed #Macro #MARKET
#WCTCS9 #ShareWeekly
$BTC $GT $ETH $XAU $NAS100
Not investment advice.
First, let’s examine the concrete data behind this downturn. As of November 20, 2026, Bitcoin is trading at approximately $58,412, having dipped as low as $57,750 during the day—its lowest level since early July. The decline stands at 15.24% over the past week and exceeds 31.02% over the past month. Market capitalization has fallen to $1.16 trillion, while trading volume hovers around $1.61 billion. Ethereum is under similar pressure, trading at $1,749, with a weekly loss of 10.8% and a monthly decline of 29%.
The primary catalyst for this decline is the withdrawal of institutional investors. On November 19, U.S. spot Bitcoin ETFs saw a net outflow of $582.3 million. Of this, $541.1 million originated from BlackRock’s IBIT fund—the largest single-day outflow since the fund’s inception. Total outflows for the month of November have reached $3.47 billion. This suggests that institutional demand has effectively come to a halt, or has even begun to reverse.
The situation regarding leverage is equally unsettling. Nearly $700 million in liquidations have occurred over the last 24 hours, with $167.21 million coming from Bitcoin long positions. In other words, the market has penalized those betting on an upward move. As shown in the screenshot, Bitcoin has fallen below the SuperTrend indicator ($59,485), presenting a technically weak outlook.
What Does Extreme Fear Signify?
A reading of 10 on the Fear & Greed Index indicates that 90% of investors are gripped by "fear." However, a critical distinction must be made: an index value of 10 does not necessarily mean the price is near a bottom. Historically, periods of extreme fear can persist for months, with each "bottom" potentially followed by an even lower one—much like in 2022, when the fear index remained at low levels for an extended period. Bitcoin is currently experiencing its seventh consecutive weekly decline, marking its second-longest losing streak since 2022.
Yet, there is a "glimmer of hope." According to CryptoQuant data, while 30-day visible demand remains in negative territory at -247,700 BTC, large-scale holders—or "whales"—continue to increase their Bitcoin reserves. This suggests that while some institutional investors are pulling back, major long-term players are quietly accumulating. This divergence could be a signal that the market is laying the groundwork for a bottoming formation, though it is not sufficient on its own.
Why Now?
This decline is not driven solely by dynamics internal to the crypto market. The Federal Reserve’s hawkish stance and higher-than-expected inflation data are dampening the appetite for risk assets. Weakness in technology stocks is directly impacting Bitcoin; the 2.25% decline in the Nasdaq following Anthropic’s IPO, combined with a six-day losing streak for the S&P 500, has rippled through the crypto market.
Rather than panicking in the face of this situation, it is best to focus on three key questions. First: Are you using leverage? If so, your chances of maintaining your position during such waves of liquidation are slim. Second: What is your time horizon? If you are thinking in the short term, staying on the sidelines during periods like this is not an act of cowardice—it is a strategy. Third: Have you defined your price levels? If the price falls below $57,750, the next support zones may be tested; keep this level in mind.
In short, the market is currently gripped by "extreme fear." While this might look attractive to those hunting for opportunities, it also demands caution. When the Fear & Greed Index sits at 10, the smartest course of action is to stick to your plan rather than trying to make predictions.
Do you believe this environment of extreme fear presents an opportunity for long-term accumulation, or does it signal that the market is bracing for a deeper correction?
#FearAndGreed #Macro #MARKET
#WCTCS9 #ShareWeekly
$BTC $GT $ETH $XAU $NAS100
Not investment advice.