Square
Following
Hot
News
Notifications
Profile
Share your thoughts
placeholder
Article
MARKET UPDATE
live-cover
LIVE75
$ZEC Short thesis update:

A rebound is an opportunity to add to positions, not a signal to buy the dip. My short entry orders are in the 1265.13–1283.06 range, with 1217.62 as the first downside target, 1172.44 as the next target, and a stop at 1321.55.
ZEC’s downtrend structure remains intact. Although the RSI has entered oversold territory, there is no sign of the bears letting up—when it comes to trends, an asset can become even more oversold. Trying to catch a falling knife against the trend is one of the most dangerous moves.
Keep in mind: oversold RSI on the 1-hour chart could trigger a
post-image
ZEC+1.29%
Trenches
ZIG
Z
bade
b
ZIG
0x8c...1145
Market Cap
$.
Change
.
24h Vol
$.
Holders
.
BTC
B
bade
b
BTC
C5xp...pump
Market Cap
$.
Change
.
24h Vol
$.
Holders
.
José
J
bade
b
José
87CQ...1UJT
Market Cap
$.
Change
.
24h Vol
$.
Holders
.
IDOL
I
bade
b
IDOL
0x3b...ab07
Market Cap
$.
Change
.
24h Vol
$.
Holders
.
scamsem
s
bade
b
scamsem
41Wp...pump
Market Cap
$.
Change
.
24h Vol
$.
Holders
.
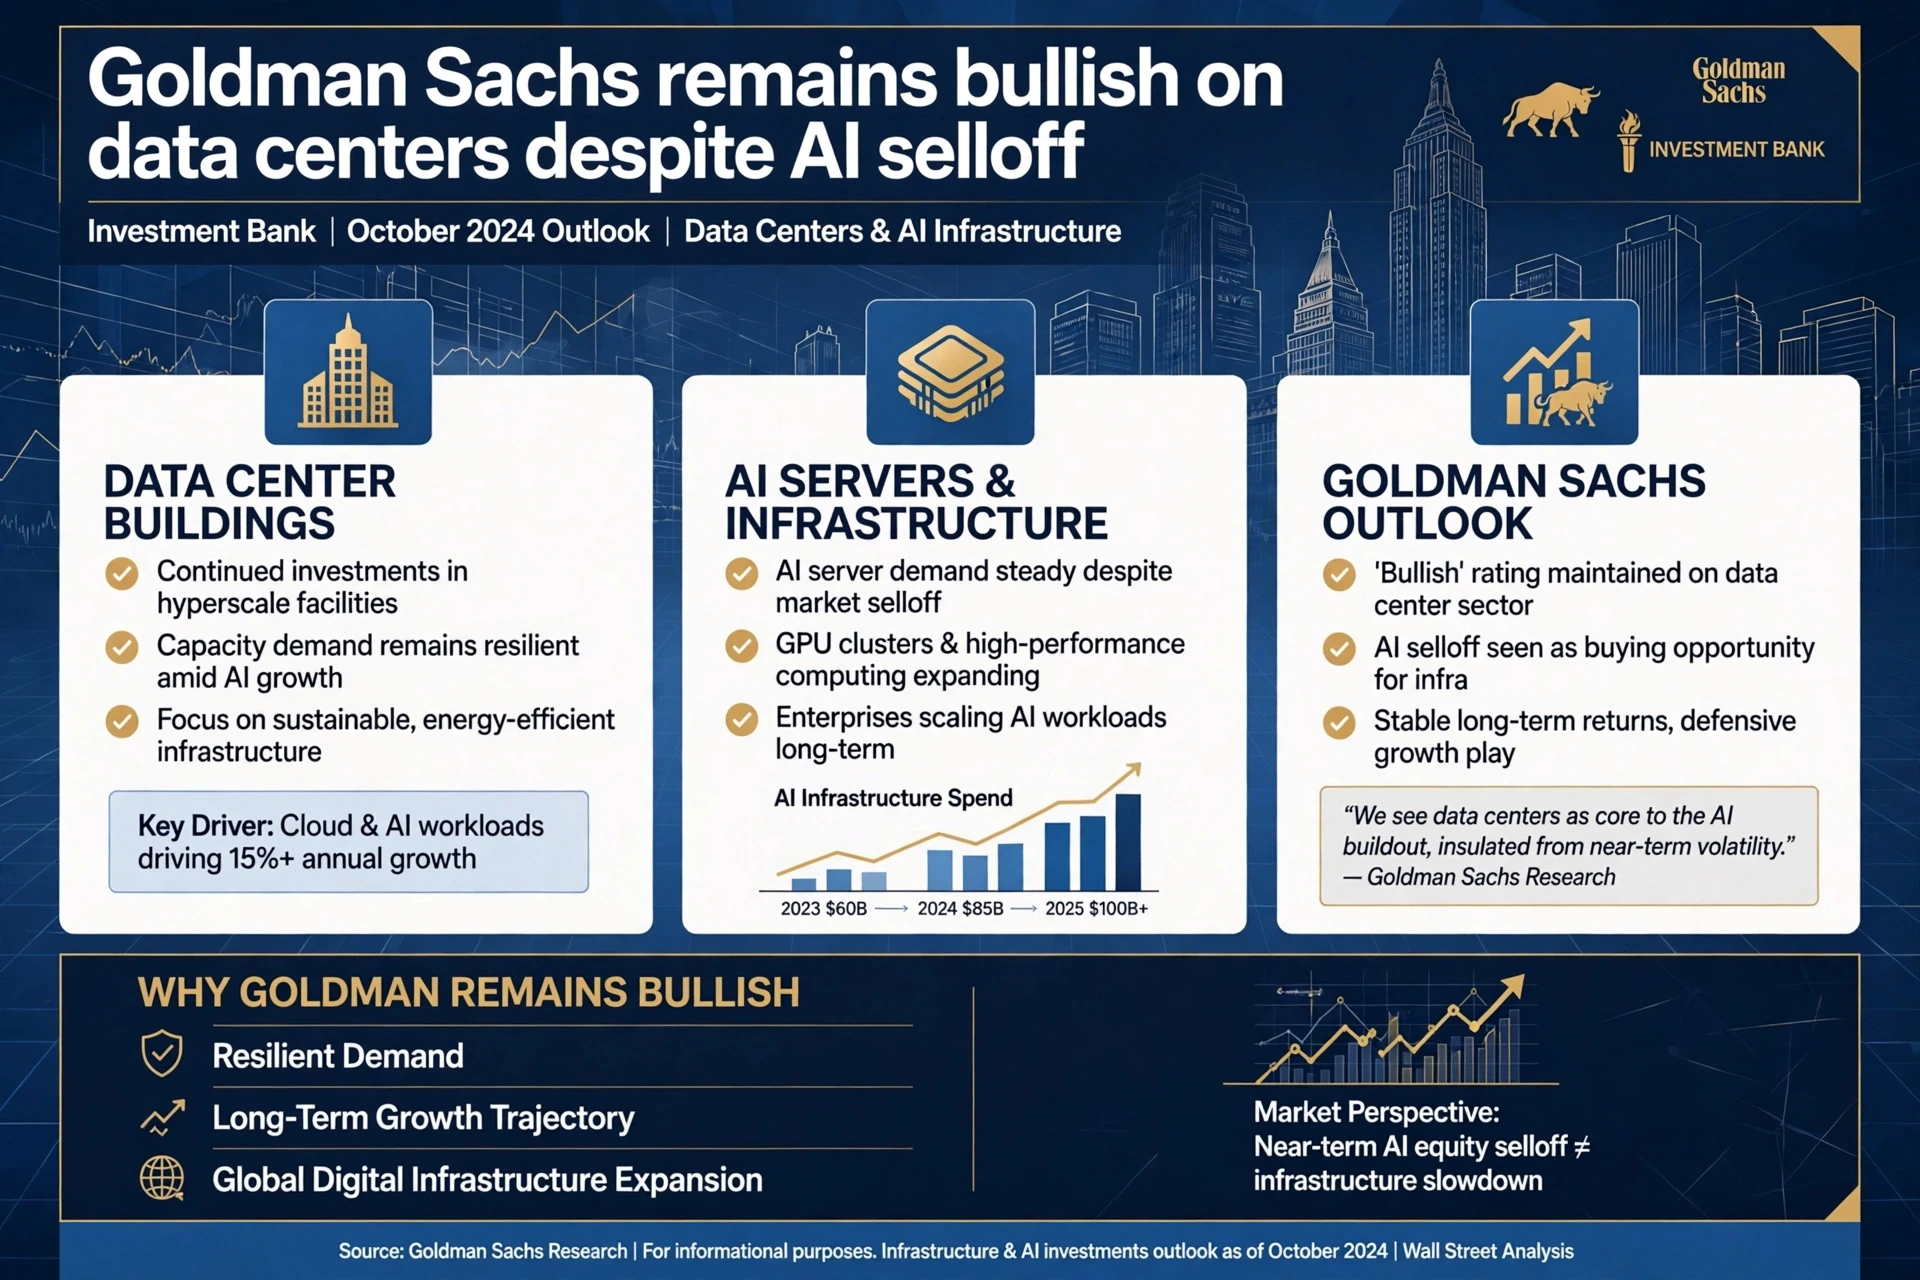
#GoldmanSachsRemainsBullishOnDataCentersDespiteTheAISelloff

*Goldman Sachs Remains Bullish on Data Centers Despite AI Selloff*
While AI equities face near-term selling pressure, Goldman Sachs is maintaining its *bullish stance on data center infrastructure.*

According to Goldman Sachs Research, the AI selloff is a market repricing, not a slowdown in underlying infrastructure demand. Data centers remain core to the AI buildout, with hyperscale capacity demand resilient and AI server spending projected to grow from *$60B in 2023 to over $100B+ in 2025.*

Key drivers: Cloud and AI workloads dri
post-image
GS-0.30%
privacy matters more than anything!
i choose privacy!
i choose @solflare
post-image
Over seven days, people buying actual $BTC on the US spot venue outspent sellers by +$331M, yet leveraged traders on the global perp market ended net sellers at -$14M. Their selling hit -$223M in the 24 hours to Nov 7.
BTC-0.67%
$ACT It posted an 11.84% green candle over the past 24 hours, and the sentiment gauge flashed two extreme readings: the Fear & Greed Index surged to 78 (the upper end of the greed range), while the funding rate hit +0.035% (longs are paying, and positioning is crowded). How do these readings compare with historical levels? Over the past three months, ACT’s funding rate has risen above 0.03% only twice: once in early February, when it spiked to 0.0145 before pulling back 18% over two days, and once in mid-March, on the eve of a sideways stretch. The pattern is clear: once longs push the funding
ACT-1.76%
At three in the morning, my phone screen was still lit, and my account balance had dropped another notch—this time, I was down more than 300 U.
I’d figured weekend liquidity was low and the market would probably just drift along, but the longer I watched, the more awake I got. This kind of slow, steady decline is the most agonizing; every time I refresh the page, it feels like I’m putting myself through a psychological test.
Here’s a look at my current positions:
$BT contract entry average price: 78596.8; the current price has already slipped to 75787.8, with an unrealized loss of -194.94U (R
post-image
SNDK-0.18%
AVAX is continuing to fall; bears are firmly in control as the price slides toward the intraday low. Shorting strategy on $AVAX . Entry range: 8.214 - 8.255 Take-profit 1: 7.834 | Take-profit 2: 7.514 Stop-loss: 8.503 Caution: If selling volume dries up, the price may rebound from the intraday low of 8.1740. Don’t go all in, friend. Keep your position size appropriate for your account.
post-image
AVAX-0.10%
Core Automation trained one AI model in two data centers 9,000 miles apart, and it came out about 1% better than training in one place on the same compute.
The US and Asian sites only had to exchange updates every 50 training steps. I like these types of tests.
Benjamin Cowen warns Bitcoin could repeat 2018 price crash
Benjamin Cowen warns that Bitcoin could face further pressure in the final months of 2026.
According to his latest analysis, a sharp sell-off in the U.S. stock market could continue to pressure Bitcoin. Cowen points to several similarities between the current environment and 2018, when U.S. stocks rose immediately after the midterm elections before quickly reversing course.
⚠️ Personal market analysis only. NFA — manage risk and DYOR.
Educational content, not investment advice or a recommendation to buy, sell, deposit, or withdraw any
post-image
BTC-0.67%
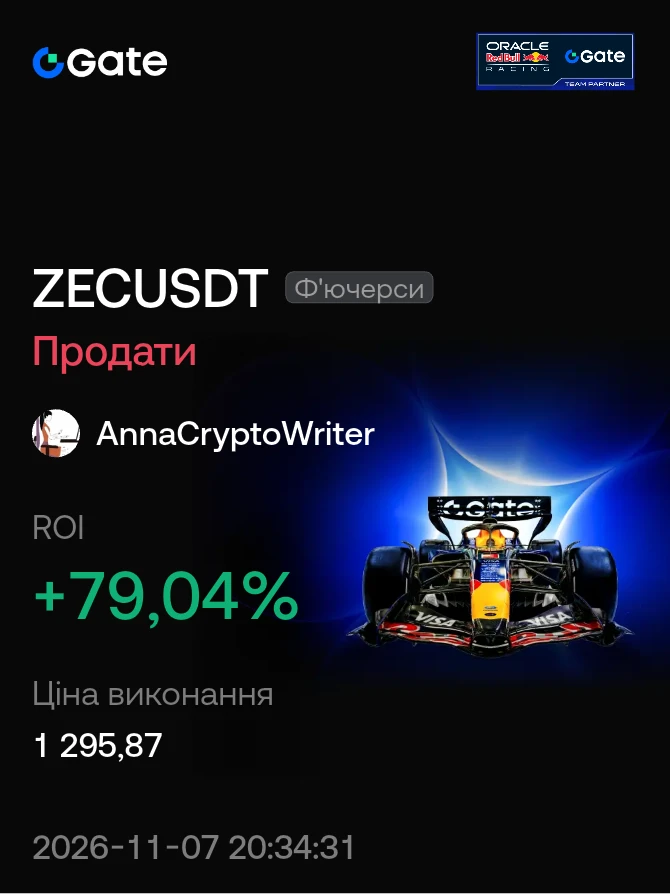
#GateSquareTradingChallenge
#ShareMyFuturesReturn

ZEC/USDT brought me a very nice result today! 📈 I opened a long position and secured a profit of 9.72 USDT with a return of 79.04 %. The average entry price was 1,295.87 USDT. I'm happy with this outcome, especially considering how quickly market conditions can change. Moments like this remind me how important it is to recognize potential upward movements and find good entry opportunities. Even a relatively short price move can bring a solid profit.

Now I'm curious to see whether ZEC has enough strength to continue its upward move. I would
post-image
ZEC+1.29%
  • 5
$ARX Down 10.68% in a day, with the current price at 0.2158—just a hair above the 24-hour low of 0.2143. This isn’t a pullback; the bulls’ defenses are being tested inch by inch. Trading volume of 3.4M suggests selling pressure isn’t particularly heavy; this looks more like a slippage-driven selloff in thin liquidity. If a candle body closes below 0.2143, there’s basically a vacuum below. My approach: don’t catch a falling knife. Wait for a high-volume, 1-hour candle showing the decline has stalled near 0.2143 before considering a small long position, capped at 5%, with a stop-loss at 0.2080 (
ARX-2.47%
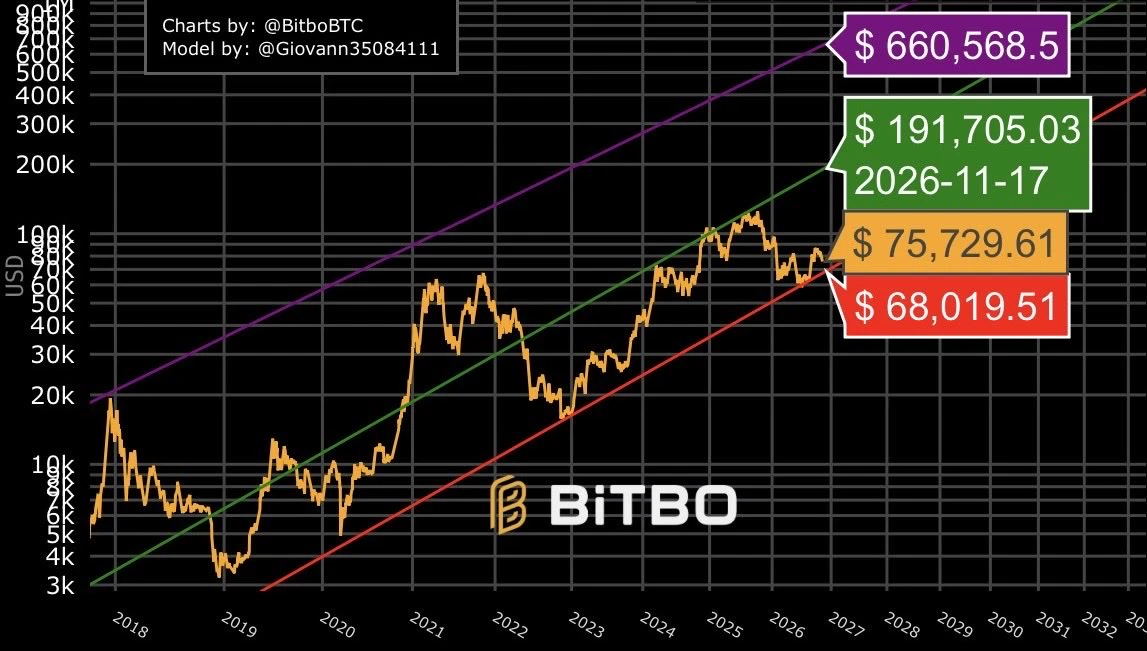
During the 2020-21 bull run bitcoin was trading significantly higher than fair value (green line) during a large portion of the cycle.
During the 2024-2025 bull run bitcoin barely even touched fair value and has been stuck between the support (red line) and fair value channel since 2022.
Today we’re sitting only 11% above support and a trip to resistance (purple line) would require a 771% price surge.
Bitcoin historically spends very little time near this red line and in the last 4 years has barely broken fair value.
No model is perfect but sentiment right now feels exactly the same as this
post-image
BTC-0.67%
$XRP On the 4-hour chart, bears are still firmly in control, with the price stuck near 1.16 while the 4-hour EMA50 has slipped to 1.24; trading below the moving average indicates that sellers are still setting the pace. My plan is to open a short in the 4-hour resistance zone, with an entry range of 1.161–1.163. As long as 1.16 is not decisively broken, I’m looking at three successive targets below: 1.157, 1.153, and 1.148. I’ll set the stop-loss at 1.171; if the price breaks above 1.17, this bearish thesis is invalidated, and I’ll exit without hesitation. Based on the risk calculation, the s
post-image
XRP-1.15%
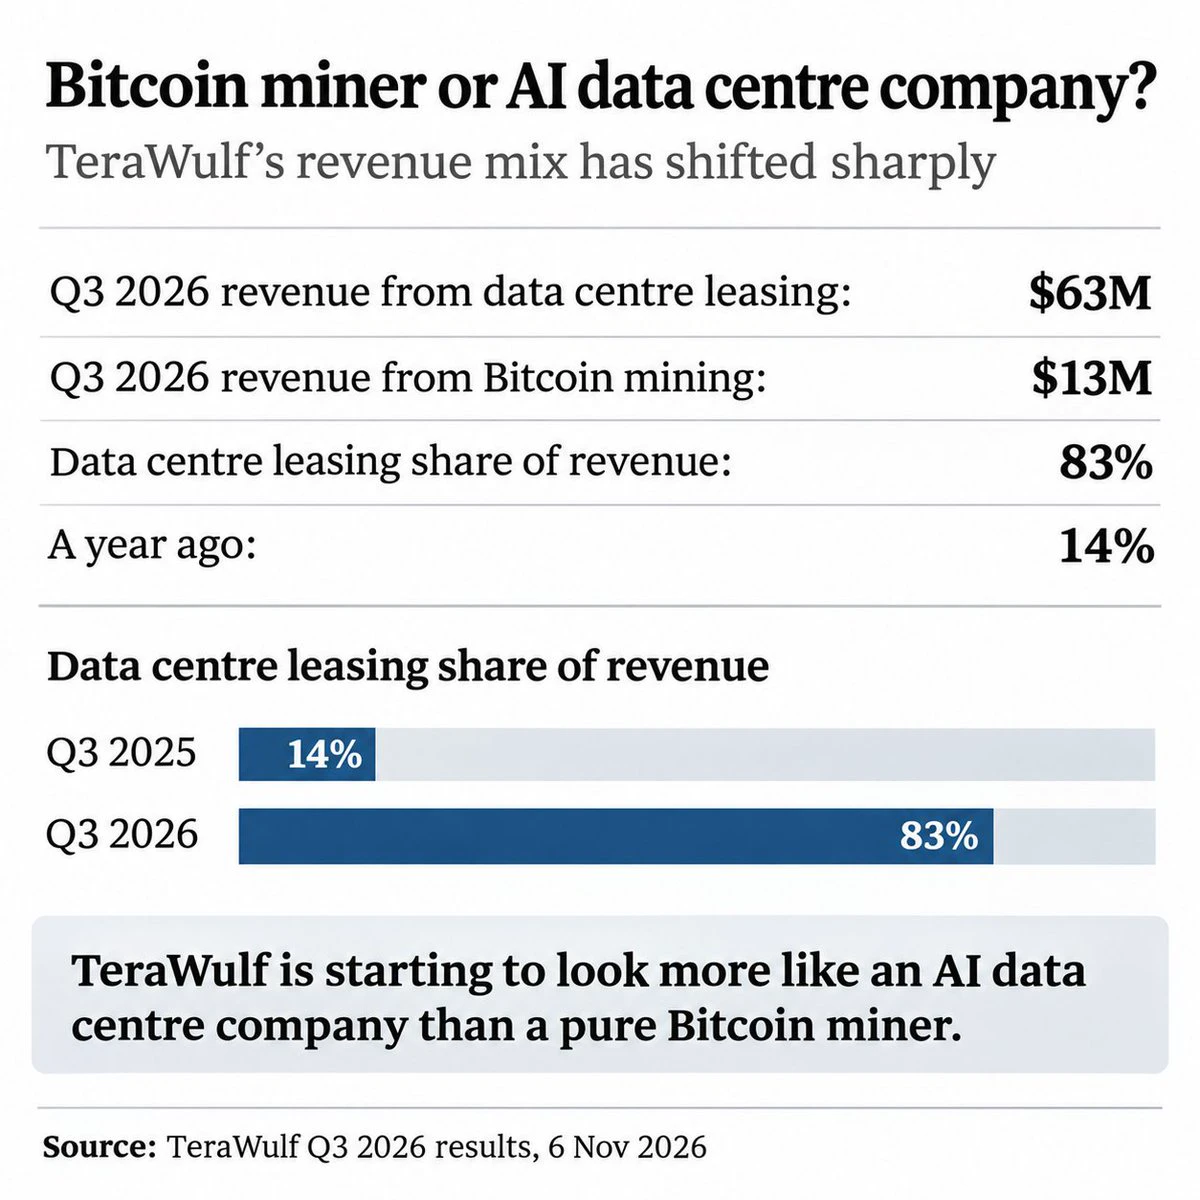
Some Bitcoin mining stocks are turning into AI infrastructure investments 👀
Look at TeraWulf. Last quarter, it made $63M from data centre leasing and just $13M from Bitcoin mining.
If you're buying mining stocks because you're bullish on BTC, it's worth checking what business you're actually investing in.
#Bitcoin #BitcoinMining #AI
post-image
BTC-0.67%
Guys, $ONE is moving exactly as I expected and successfully hit my take-profit level……‼️…… Now, I'm going to close my long position, wait for the next rejection, and then short……‼️
post-image
ONE-1.19%
11/8
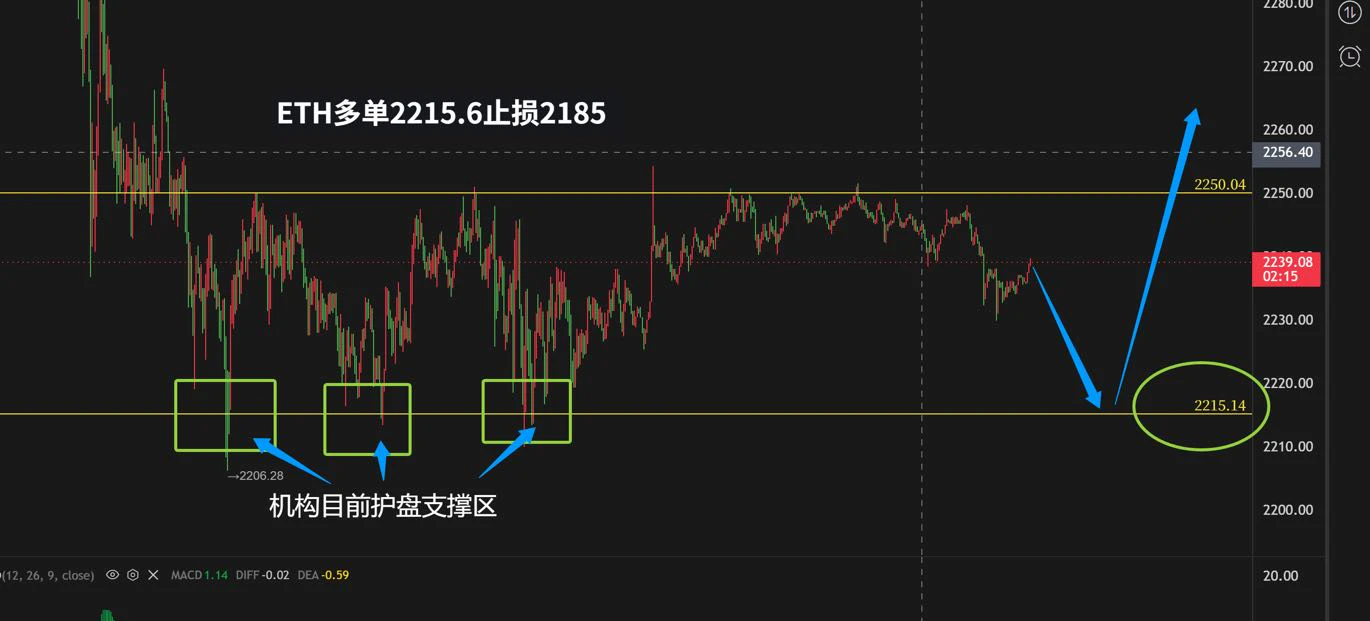
ETH wealth-making secret
Weekend market is slow; enter with long positions positioned for gains.
post-image
ETH-1.26%
Bullish momentum is strong, and the rally is rapid; the momentum behind this breakout is too strong to short. I'm building a long position on $BTW . Position plan: Entry 1.221 - 1.231 Take profit 1.2833 / 1.3291 Stop loss 1.1844 Please be cautious: the 15-minute RSI is elevated, and if volume contracts, a sharp pullback may occur. Don't go all-in, bro. Position size should be based on your own account.
post-image
BTW-7.42%
Short $XRP at the 4-hour resistance. 1.16 holds, next target 1.15. If it breaks above 1.17, I’ll abandon this setup. - Price 1.16, below the 4-hour EMA50 (1.24); sellers still control the trend - Stop-loss risk 0.77%, TP3 return 1.2%; if TP3 is reached, the risk/reward ratio is 1.6R Entry: 1.161–1.163 (short) Targets: 1.157 → 1.153 → 1.148 Invalidation: 1.171 Not investment advice · Do your own research
post-image
XRP-1.15%
Load More

Join 40 M users in our growing community

⚡️ Join 40 M users in the crypto craze discussion

💬 Engage with your favorite top creators

👍 See what interests you

Trending Topics

USAIStocksHitHard

20.78k Views3.67k Discussing

U.S. stocks sold off sharply on Thursday, November 5 (UTC). The Nasdaq closed down around 5.5%, entering correction territory, while the Philadelphia Semiconductor Index plunged roughly 12%, with chip stocks including $NVDA and $AMD posting steep losses. Beyond profit-taking, investors are growing concerned about the pace of AI data center construction, capital spending, and future returns on investment. The key question now is whether the AI sector’s lofty growth expectations need to be repriced. Where do you think the next opportunities will emerge: chip stocks, tech giants, or other sectors?

USNonfarmPayrolls

33.48k Views4.34k Discussing

StakeOnLaunchpoolToShare450KVLX

9.28k Views828 Discussing

View More