






Square
Following
Hot
News
Notifications
Profile
Share your thoughts
placeholder
Article
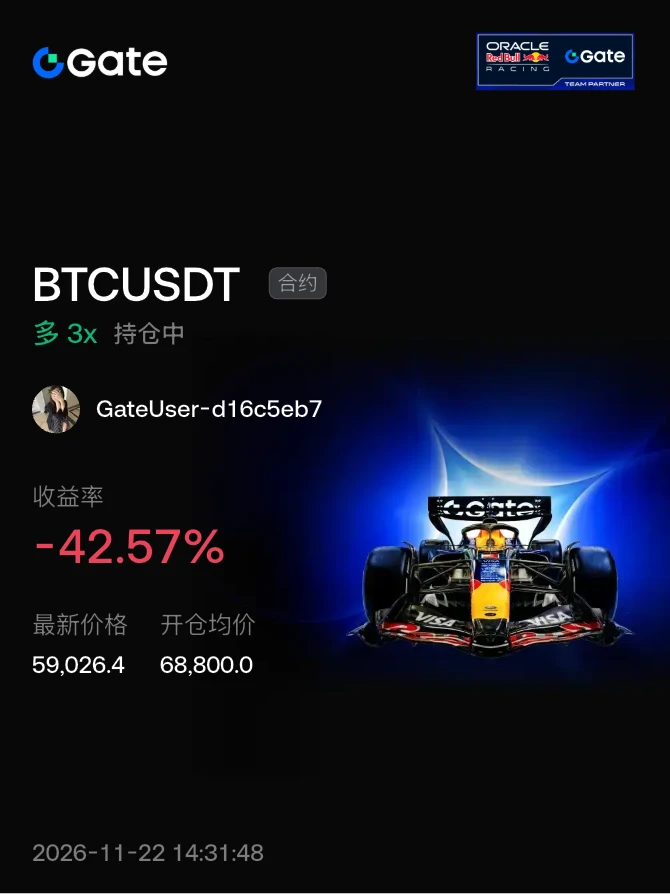
#晒出我的持仓收益 Can I still break even on this BTC?
post-image
BTC-0.65%
The Crypto Market Is Catching Its Breath — Is This the Start of a Recovery?

After seven difficult weeks of selling pressure, Bitcoin has finally delivered a meaningful rebound. The long lower wick on its daily candle suggests buyers are defending the lower price region.

However, I wouldn't rush to call this a confirmed bull market. The next phase could involve sideways movement, volatility, and another test of important support zones.

My focus is on buying strategically rather than chasing the rebound. Spot accumulation should be gradual, while leveraged positions need strict risk managemen
post-image
BTC-0.67%
ETH-1.26%
SOL-0.77%
BNB-0.76%
  • 3
Trenches
IDOL
I
bade
b
IDOL
0x3b...ab07
Market Cap
$.
Change
.
24h Vol
$.
Holders
.
JAGENT
J
bade
b
JAGENT
0x8e...ae15
Market Cap
$.
Change
.
24h Vol
$.
Holders
.
PIEVERSE
P
bade
b
PIEVERSE
0x0e...25a9
Market Cap
$.
Change
.
24h Vol
$.
Holders
.
FIONA
F
bade
b
FIONA
B34n...pump
Market Cap
$.
Change
.
24h Vol
$.
Holders
.
mihao
m
bade
b
mihao
4Cxj...pump
Market Cap
$.
Change
.
24h Vol
$.
Holders
.
Bitcoin falls below $57k
live-cover
LIVE1,847
BTC-0.67%
BTC-0.65%
SOL-0.74%
DOGE-0.18%
ZEC+1.29%
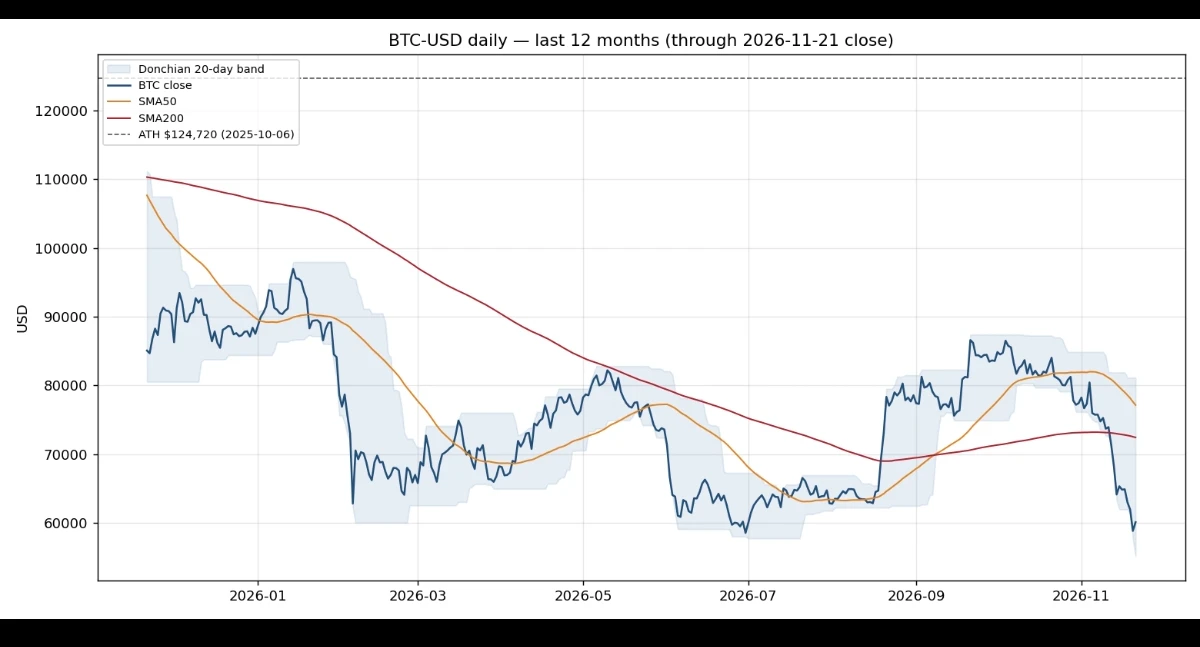
BTC daily signals, close 21 Nov $60,086, up 2.2% on the day, back above $60,000 after closing below it on Friday. 6 of 14 systems long: only 1 of 9 trend systems long, all 5 mean-reversion and sentiment systems long.

Price is 17.0% below the 200-day average of $72,426, so trend systems stay in cash.

RSI(14) 22.6, still oversold but up from 17.4, and fear and greed 12, extreme fear (latest 11 today). Donchian long trigger is a close above $81,131, far above price. 2xATR stop sits at $54,028.

No signal flips since yesterday, the split is unchanged.

$BTC ‌
post-image
BTC-0.67%
  • 2
#Gate直通IPO第三期ANT配售92100股
Gate Direct IPO Round 3 has officially delivered its allocation results for Anthropic, PBC (NASDAQ: ANT) and the numbers underscore both extraordinary retail appetite for frontier AI equity and the discipline required once primary allocations transition into live secondary trading. Finalized on November 19, 2026, the round attracted 152 million USDT in total intended subscriptions against a fixed quota of 92,100 ANT shares at an official offering price of 83 USDT per share, distributing 7,644,300 USDT in equity value at an overall pro-rata allocation rate of approxima
post-image
ANT-8.68%
SPCX-7.38%
NVDA-13.84%
NDAQ-0.95%
#每周来晒 #美联储或需加息50个基点
When the Federal Reserve released the minutes from its October 27–28, 2026 FOMC meeting on November 18, one line immediately rattled global risk markets: while the central bank held its benchmark target range steady at 3.75%–4.00%, "a couple of participants" explicitly noted that an interest-rate increase larger than 25 basis points a 50-basis-point hike could be warranted at the December 8–9, 2026 meeting if inflation data fails to cooperate.
Yet treating a 50-basis-point shock as a done deal misses the true macro picture. The minutes capture an active internal policy deb
BTC-0.67%
ETH-1.26%
NVDA-13.84%
CME+0.41%
NDAQ-0.95%
#PCEAndGDPDataNextWeek
#ShareWeekly
PCE and GDP Data Next Week: Will Inflation and Economic Growth Trigger the Next Global Market Move?
Global financial markets are approaching another major economic turning point as investors prepare for the upcoming US Personal Consumption Expenditures (PCE) inflation report and Gross Domestic Product (GDP) data. These two releases could significantly influence expectations surrounding Federal Reserve interest-rate decisions and determine the direction of financial markets heading into December.
From Bitcoin and Ethereum to Wall Street equities, gold, bonds
BTC-0.67%
ETH-1.26%
XAU+0.38%
XRP-1.15%
SOL-0.77%
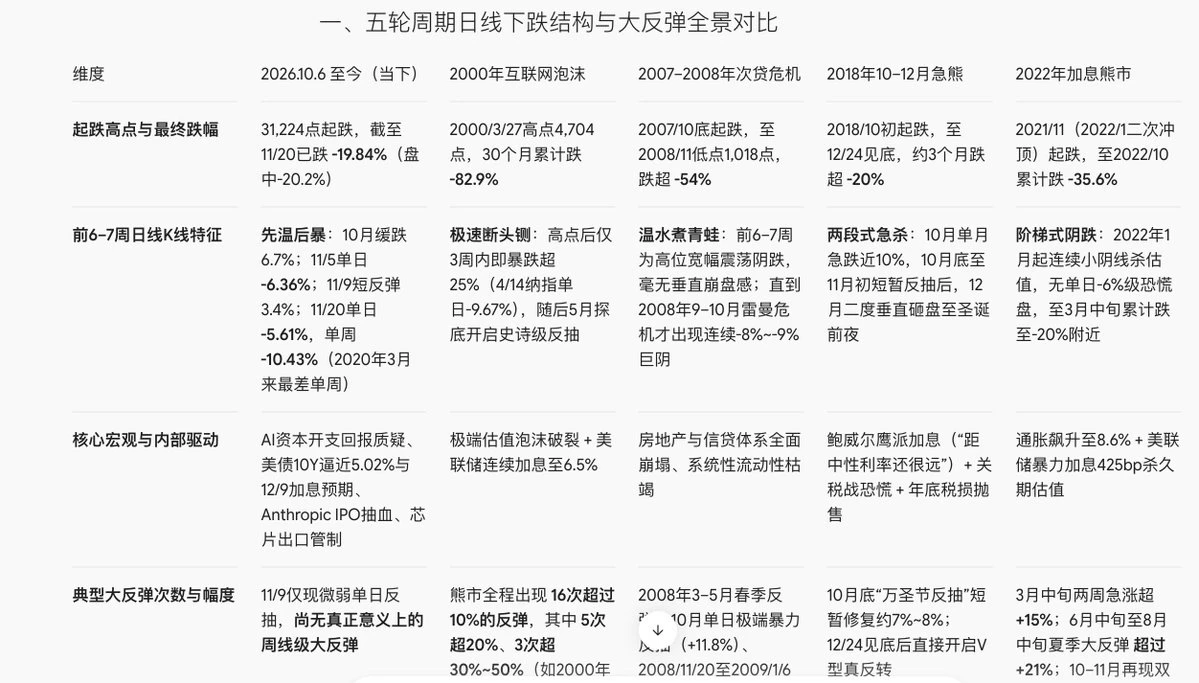
Comparison of the decline from NAS100’s October 2026 peak with declines beginning at the 2000, 2007, 2018, and 2022 peaks.
1) Speed of decline: The second-fastest of the five, numerically close to 2022.
2) Rally before the peak: On the same scale as 2007, 2018, and 2022, lacking the parabolic rise of 2000.
3) Candlestick pattern similarity: Most similar to 2018, but the differences among the four comparisons are small.
4) Subsequent moves: The decline in the first 33 days cannot determine the final depth; markets keep extending and evolving.
The current decline is close to the path of the Q4 2
post-image
NAS100-0.07%
new market update
live-cover
LIVE2,304
BTC-0.67%
ETH-1.26%
USDC+0.01%
SOL-0.77%
#BTC反弹后再争6万美元关口 To be precise, this Bitcoin rebound looks more like a short-term recovery after a sharp drop and cannot yet be considered stabilization. $60,000 is the threshold for judging whether the rebound can continue, but whether to treat it as stabilization also depends on whether trading volume and capital flows follow through.

Why it should initially be viewed as a recovery
The rebound is driven mainly by passive factors: on November 21, Bitcoin bounced from a low of $55,127 to $60,523, with about $68.82 million in short liquidations in one hour, versus only $1.64 million in long liq
post-image
ThisIsTranslateContent:
#BTC反弹后再争6万美元关口 To be precise, this Bitcoin rebound looks more like a short-term recovery after a sharp drop than a sign of stabilization. $60,000 is the threshold for judging whether the rebound can continue, but whether it marks stabilization also depends on whether trading volume and fund flows follow through.
Why it should first be viewed as a recovery
The rebound is driven mainly by passive forces: On November 21, Bitcoin bounced from a low of $55,127 to $60,523. One-hour short liquidations totaled about $68.82 million, while long liquidations were only $1.64 million. The move was driven mainly by shorts closing positions, not by sustained buying from new buyers.
The funding picture has yet to strengthen: From November 2 to 17, U.S. spot Bitcoin ETFs saw cumulative net outflows of about $2.579 billion, while stablecoin market capitalization also contracted[8]. How to assess $60,000 alongside fund flows
$60,000 is just a threshold: Reclaiming it and then holding it on a retest would show that bears are temporarily unable to keep prices down. But reclaiming it could also be only a brief reprieve after short covering.
Trading volume needs to be strong and healthy: Rising volume during advances and declining volume during pullbacks would show that buyers are willing to step in at higher prices. If prices rise without volume following suit, the rally lacks a solid foundation.
Fund flows need to turn positive and stay that way: ETFs should shift from net outflows to net inflows for several consecutive days, with inflows gradually increasing; stablecoin market capitalization should stop falling and recover. A return to inflows for just one day followed immediately by a shift back to net outflows would indicate only a tentative move.
So: Only if Bitcoin holds above $60,000, ETFs see consecutive days of net inflows, and pullbacks come on lower volume can the move be considered a shift from a short-term recovery to stabilization. If it only reclaims $60,000, treat it as an oversold rebound for now.#WCTCS9 $BTC ‌

repost-content-media
BTC-0.67%
  • 2
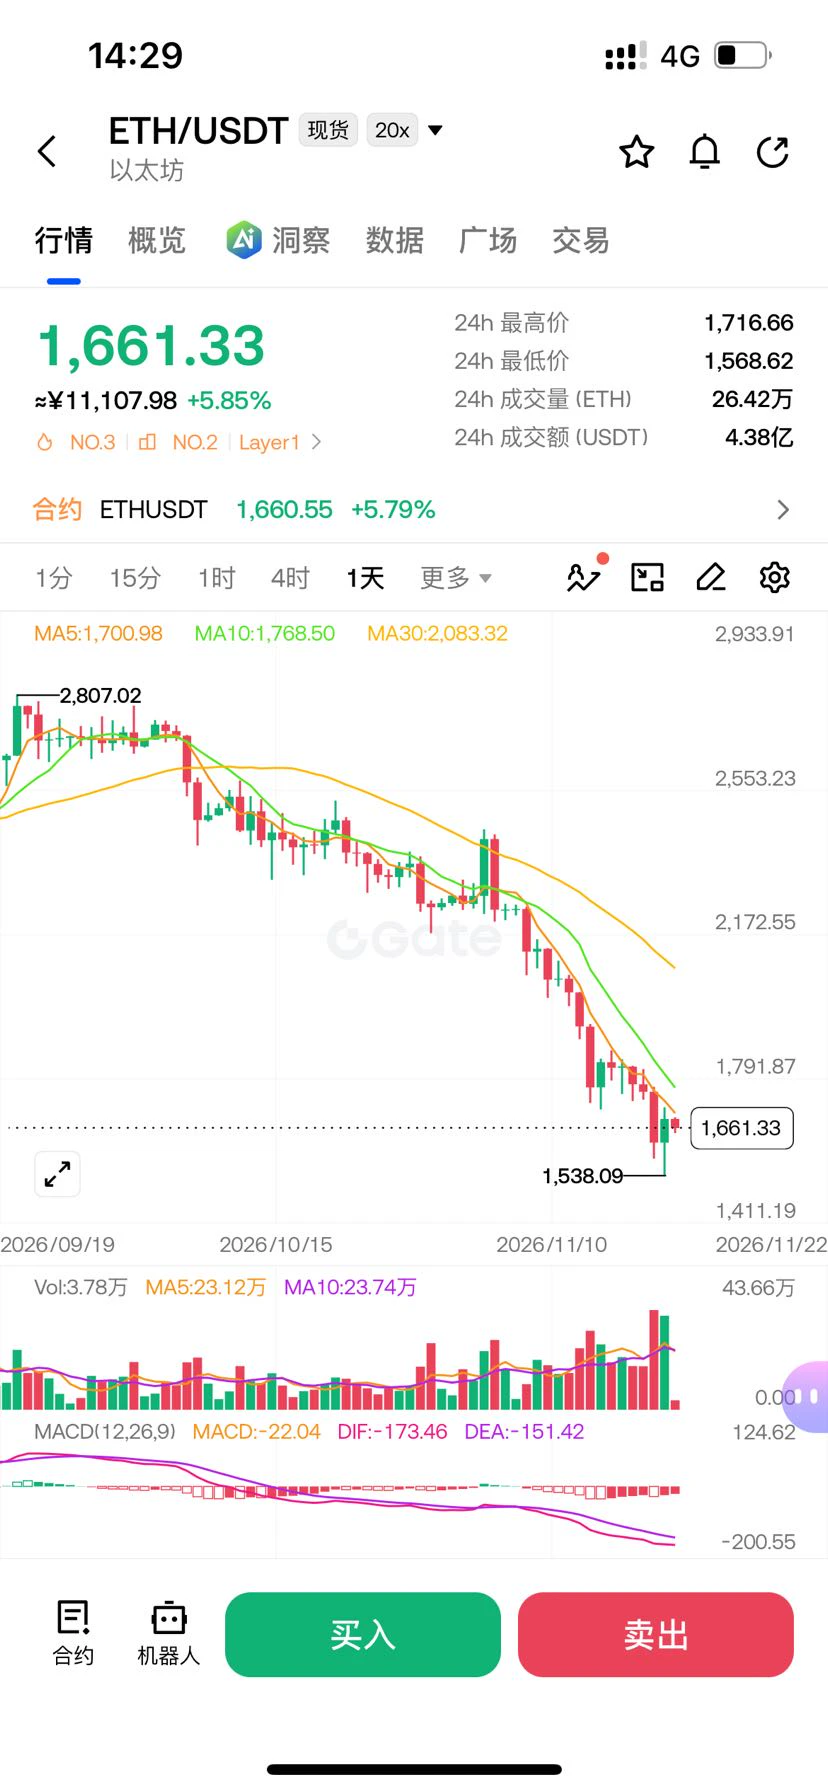
November 22, 2026 (Sunday) ETH Futures Strategy Analysis for Today (reference current range of approximately $1,660–$1,690)
Core view (bearish bias; caution on oversold bounce)
ETH has pulled back sharply from above $2,000, touching around $1,540 over the past two days before rebounding to around $1,680. The daily structure is bearish, and RSI is in oversold territory. A short-term technical rebound is possible, but overhead resistance is significant. Sunday liquidity is low, so prioritize watching for a blocked rebound to short, or consider going long only after a pullback to lower support. K
post-image
ETH-1.23%
  • 1
#GoldNears3500 Spot gold (XAU/USD) is staging a sharp technical rebound toward $3,578 per ounce on November 22, 2026 bouncing cleanly off Friday’s multi-month capitulation low near $3,514 after testing the critical $3,500 psychological floor. For active traders, this high-volatility inflection between $3,500 support and $3,600 resistance highlights why Gold Contracts for Difference (CFDs) on Gate TradFi paired with the Gate Card Points System have become a premier toolkit for capturing two-way precious-metal momentum while turning everyday expenses into digital assets (BTC, ETH, USDT, and GT).
post-image
XAUUSD-2.40%
BTC-0.67%
ETH-1.26%
GT-2.41%
XAGUSD-3.80%
#美国11月初请失业金人数高于预期
At first glance, a softer U.S. employment reading should give beaten-down risk assets room to breathe. Yet when the U.S. Department of Labor reported that initial jobless claims rose to 203,000 for the week ending November 14 coming in above Wall Street’s 197,000–198,000 consensus forecast the Nasdaq Composite still dropped roughly 2.25%–2.3% that session (before plunging another 5.28% on Friday, November 20), while Bitcoin broke decisively below $60,000 to test the $55,123–$58,914 zone into November 22, 2026.
Understanding why mildly cooler labor data failed to spark a reli
post-image
NDAQ-0.95%
NVDA-13.84%
BTC-0.67%
BLK-3.02%
IBIT-5.97%
#GateAnnualGala 🎉 Gate Annual Gala Is Here!

The Gate Annual Gala is bringing the community together for a special celebration of another exciting year in crypto! 🚀

🏆 From memorable moments and achievements to creators, streamers, and community members, the Gala is a chance to celebrate everyone who has been part of the journey.

✨ Stay tuned for exciting highlights, recognition, rewards, and unforgettable moments from the event.

💙 Let’s celebrate the progress, passion, and future of the crypto community together!

#Gate #GateAnnualGala #Crypto #Web3
post-image
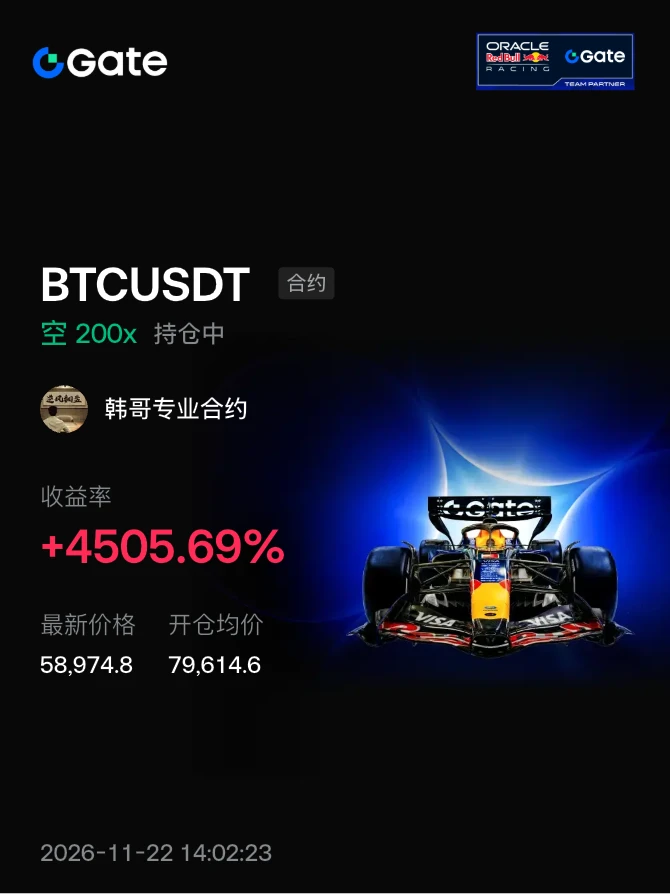
A 4507% short position, entered at 79614.6, currently at 58974.9. Discipline: stop-loss at 62000; take profits in stages at 55000 and 52000; position size no more than 10%.

Looking at the bigger picture: $BTC failed to break 80,000, with lower highs marking the start of a correction cycle. Macroeconomic rate expectations are weighing on risk assets.

The risk is that 200x leverage is extremely sensitive—a tiny wick can trigger liquidation. It is currently deeply oversold, making the position very unpleasant to hold.

Trend-wise, if it breaks below 55,000, 50,000 is in sight; otherwise, expec
post-image
BTC-0.65%
ETH-1.23%
SOL-0.74%
  • 2
  • 1
#BTCReboundFaces60KTest

CAN BITCOIN HOLD ABOVE $60,000 AFTER BOUNCING OFF $55,300 AND SLIPPING BACK NEAR $59,300?

Will Bitcoin's quick jump back above $60,000 on November 21 turn into real stability, or is the pullback toward $59,300 a sign that sellers are still waiting overhead? After touching lows around $55,300—its weakest stretch since September 2024—Bitcoin rebounded above $60,000 before easing back toward the $59,300 area. Because round numbers act like magnets for both buyers and sellers, watching how price behaves around $60,000 gives a clear window into market strength.
CEO Econom
BTC-0.67%
Now, every day the group says it’s “up” again!
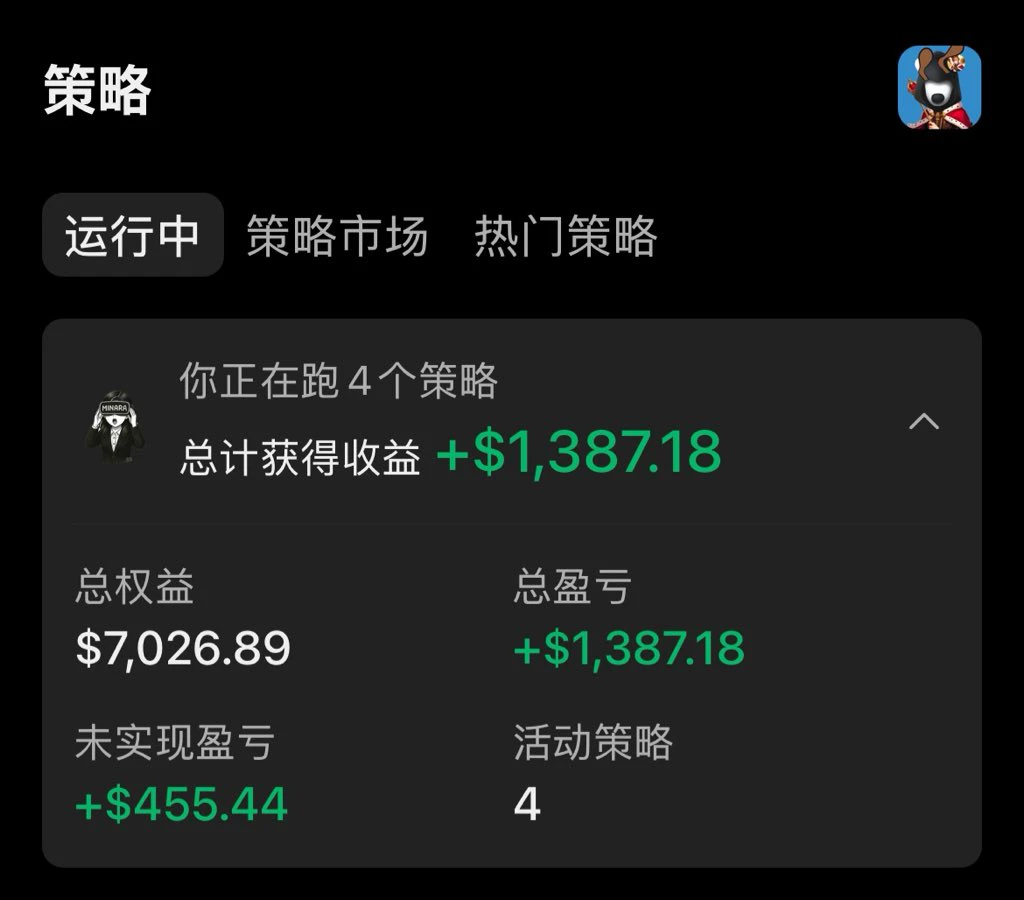
I haven’t traded manually in ages. AI has taken over my work and is even better at trading than I am. I just open my phone every day to check my profits!
I’ve got four AI strategies running right now, and they’re all profitable! But that’s not my end goal. Next, I’ll research new ways to make money, all using AI!
I’m going to make money with AI—that’s the only way to justify all the tokens I’m burning!
post-image
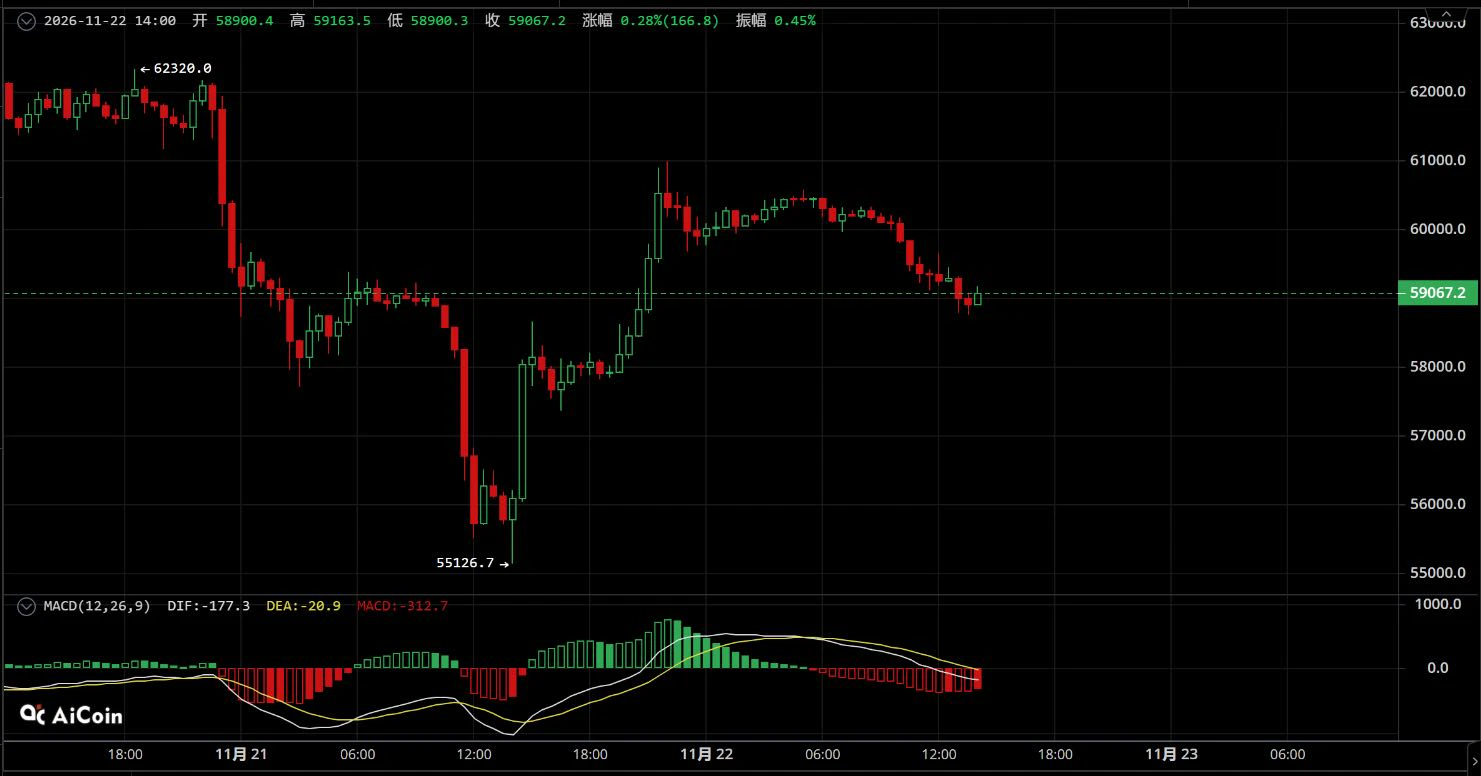
A Long bit | November 22 $BTC A weak rebound cannot reverse the downtrend; shorting at higher levels is the way to go

【Trading Plan】
Short entry zone: Set up positions on a rebound to 59800-60300
Stop-loss: Above 60800
Take-profit targets: First target 58200-57900, second target 57000-56500

【Core Rationale】
On the 30-minute chart, this is a textbook oversold recovery after a sharp plunge. The price rebounded from a low of 55126 to around 60500, where it met resistance and turned lower. The broader downtrend structure remains completely intact, and bears are still in control of the overall ma
post-image
BTC-0.65%
Whoa, no way!
I had no idea a folding steering wheel could free up that much space!
post-image
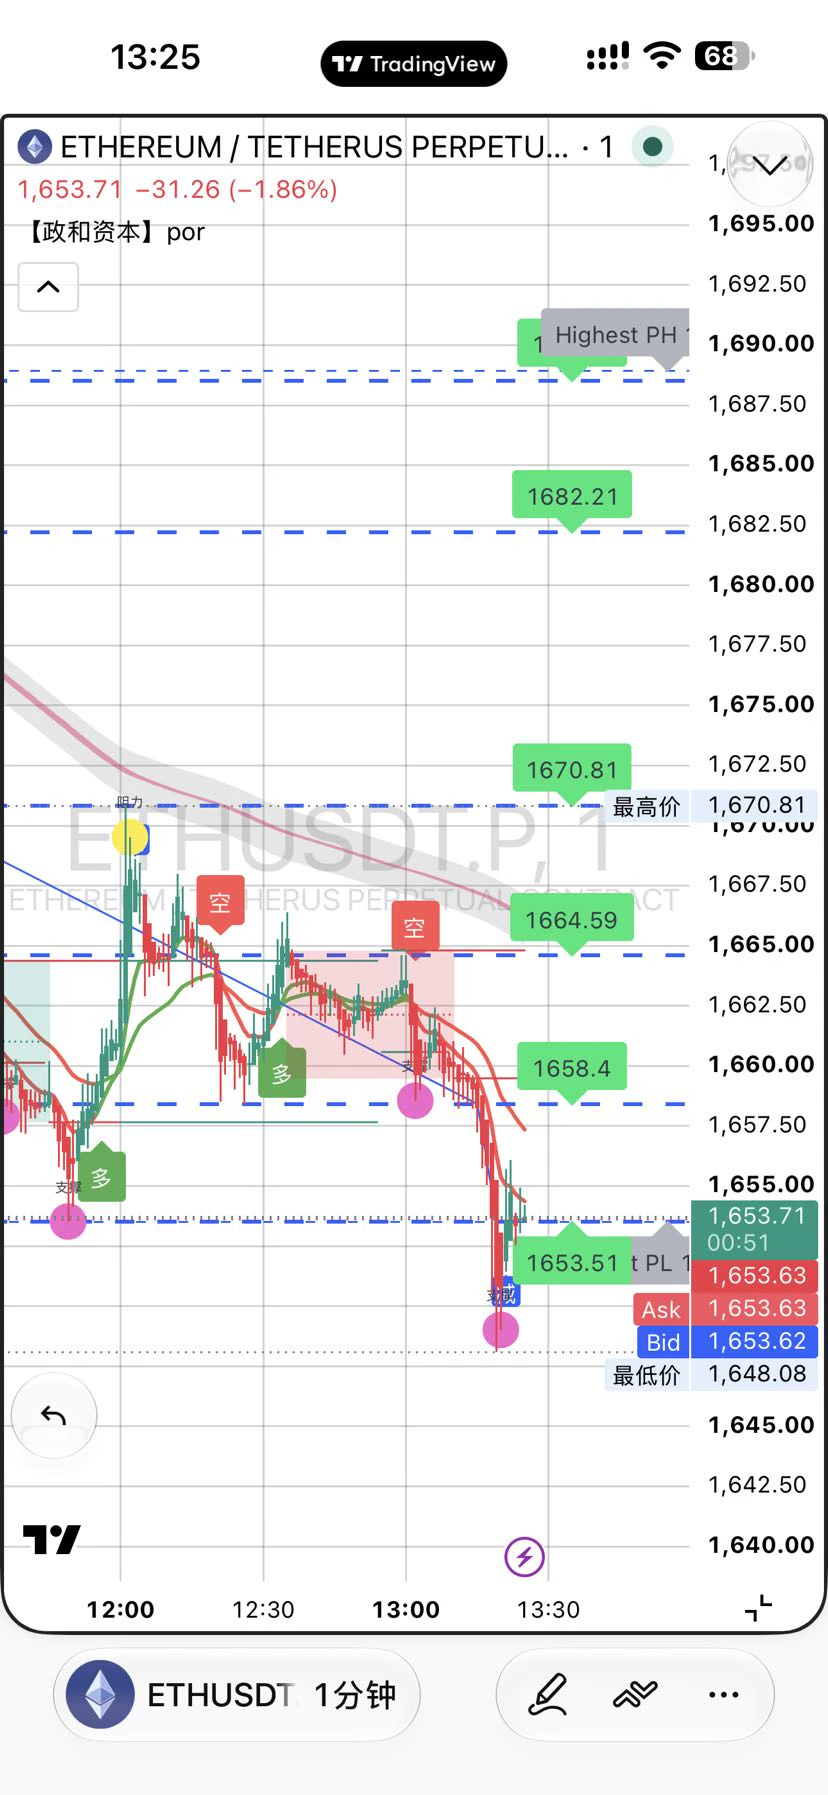
$ETH That guy who collateralized 180k ETH to borrow 214 million U—the one whose liquidation price I checked at noon, 1401—is still sitting right where he was.

Today I spotted another whale transferring 65 million U to an exchange, clearly ready to buy. Put the two side by side and it’s absurd: one has the market at his throat, watching how far ETH is from 1190; the other is sitting on bullets, waiting for a lower price. Same chart, two fates.

ETH bounced more than 6% today, closing at 1663, but looking back, it was still above 2300 a month ago. This rally feels like no rally at all—just anot
post-image
ETH-1.26%
Load More

Join 40 M users in our growing community

⚡️ Join 40 M users in the crypto craze discussion

💬 Engage with your favorite top creators

👍 See what interests you

Trending Topics

BTCReboundFaces60KTest

2.1M Views30.1K Discussing

BTC rebounded from around $55,300 on November 21, briefly reclaiming $60,000 before pulling back to around $59,300. The $60K level is back in focus as traders assess whether the recovery can last. Is this rebound a sign of stabilization or a short-lived recovery? Would reclaiming and holding $60K be enough, or do you need confirmation from trading volume and fund flows?

PCEAndGDPDataNextWeek

258.2K Views2.6K Discussing

GateDirectIPOPhase3ANTAllocates92100Shares

817.6K Views5K Discussing

View More