


Square
Following
Hot
News
Notifications
Profile
Share your thoughts
placeholder
Article
Bitcoin and Ethereum plunge together! Is the crypto bull market running out of steam? This time, even dip buyers are starting to hesitate!

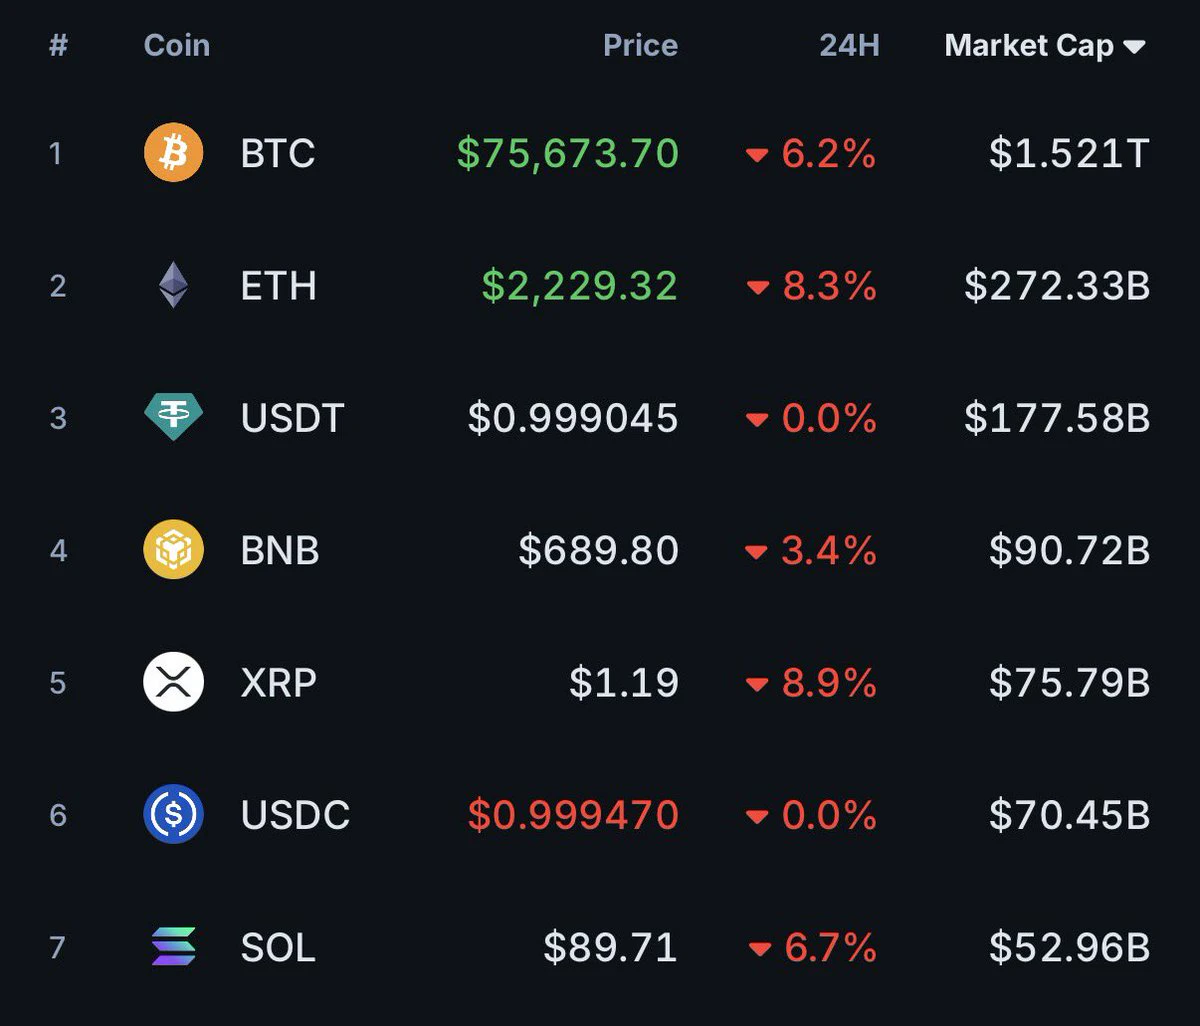
When U.S. stocks fall, crypto gets dragged down too! BTC and ETH have recently come under pressure alongside global risk assets, as risk aversion intensifies and investors begin to reassess the crypto assets they hold.
When prices were rising, everyone thought Bitcoin was digital gold; but when market winds shift, it often behaves more like a high-volatility tech stock. Its supposed safe-haven status still has to stand the test of the market when it matter
BTC-0.67%
ETH-1.26%
  • 13
What Is Position Sizing, and Why Can Oversized Positions Knock You Out Early Even If Your Trading Strategy Has an Edge?

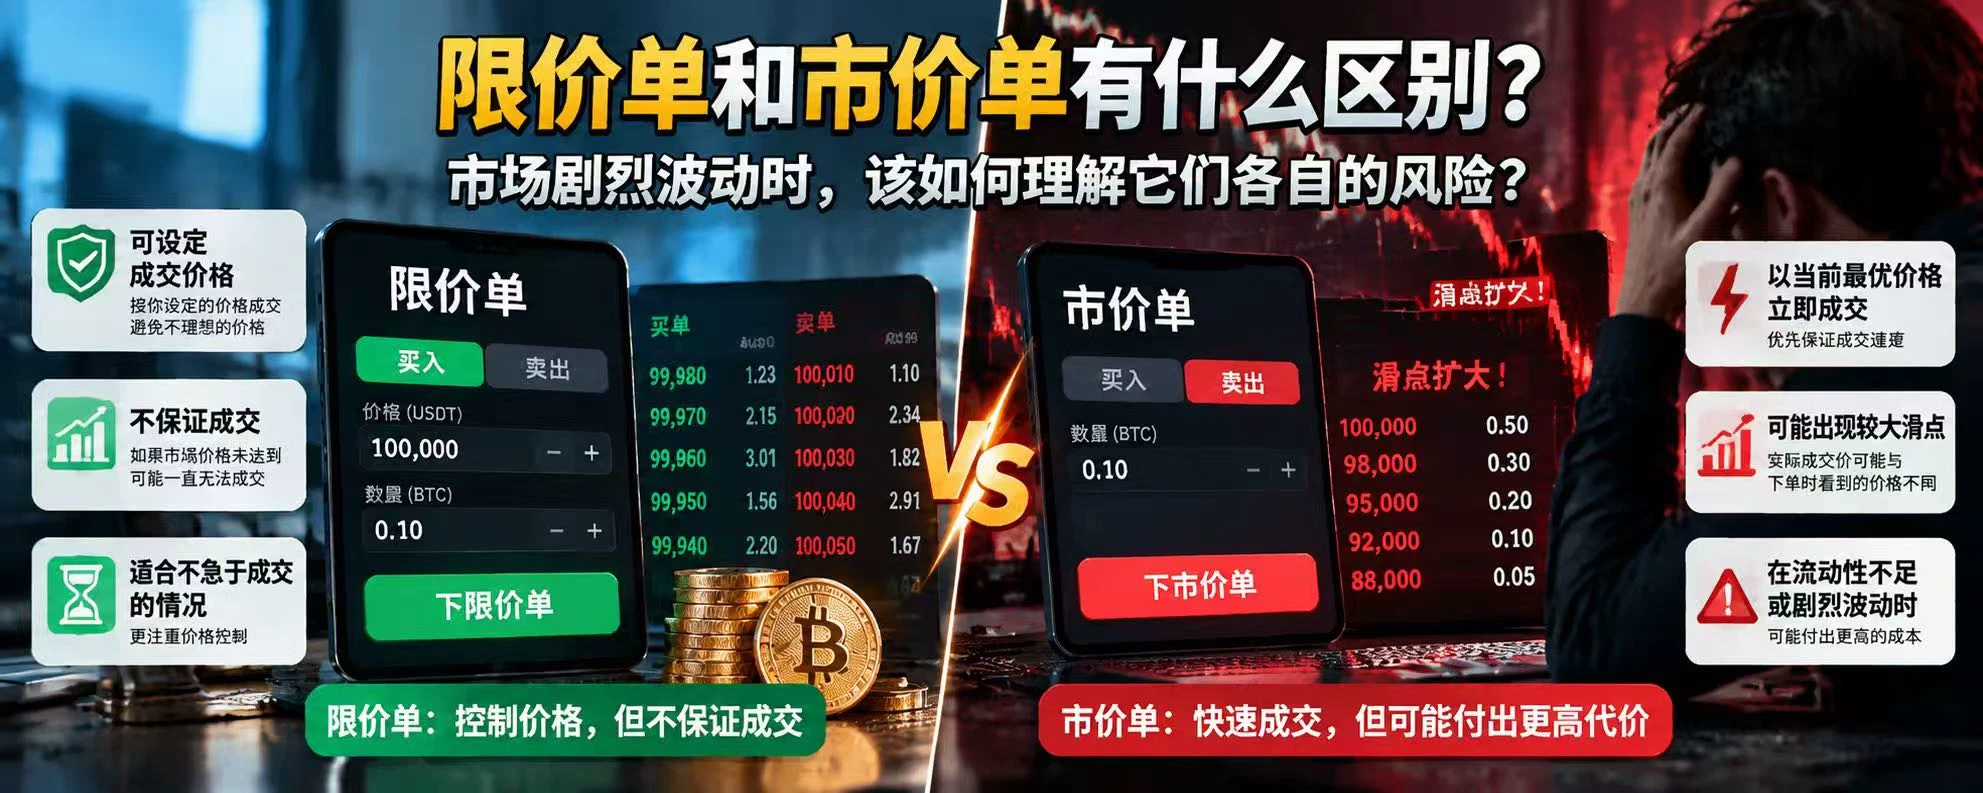
In crypto trading, correctly predicting market direction is important, but how much capital you commit to each trade also determines whether your account can survive over the long term. Even a strategy with positive expected returns can cause losses that are difficult to recover from if your position is too large and an unexpected price swing or a string of losses occurs.

First, what is position sizing?

Position sizing is the process of deciding how much capital to allocat
post-image
Trenches
ZIG
Z
bade
b
ZIG
0x8c...1145
Market Cap
$.
Change
.
24h Vol
$.
Holders
.
BTC
B
bade
b
BTC
C5xp...pump
Market Cap
$.
Change
.
24h Vol
$.
Holders
.
STONK
S
bade
b
STONK
6GmA...UNgx
Market Cap
$.
Change
.
24h Vol
$.
Holders
.
DESSA
D
bade
b
DESSA
npz2...pump
Market Cap
$.
Change
.
24h Vol
$.
Holders
Diamond
D
bade
b
Diamond
5VCE...pump
Market Cap
$.
Change
.
24h Vol
$.
Holders
.
Long-term market outlook reference

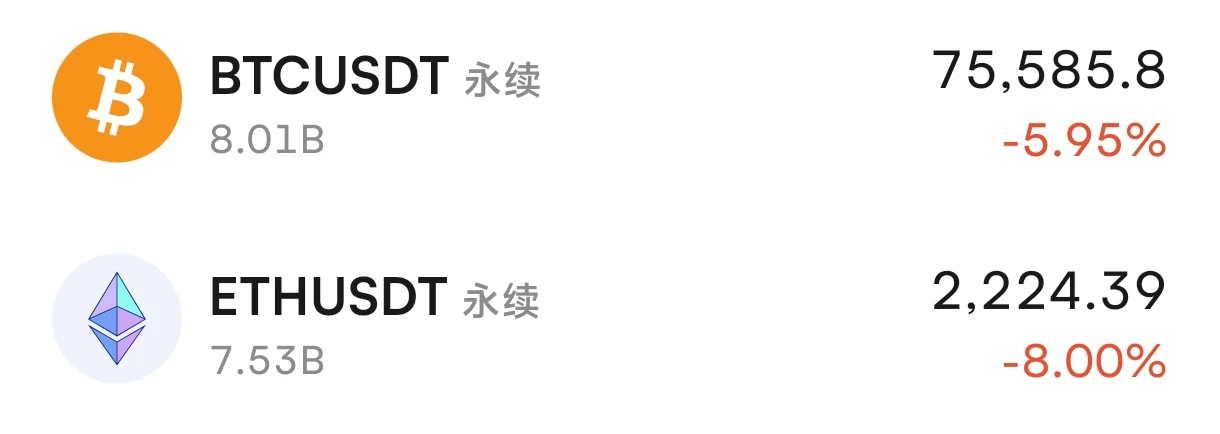
BTC currently at 75585.1, ETH currently at 2221.00
Both major assets have completed a pullback after a rally over the larger time frame. This is a cyclical consolidation following an upswing; the long-term bottom structure remains intact, and downside room is gradually narrowing, making it unsuitable to chase shorts. Wait for a retest of the long-term support zone and, once signs of stabilization emerge, build a core position in batches to position for a new upward trend.

Long-term strategy: scale in on pullbacks
BTC: wait for a pullback to 73000‑74500; fir
BTC-0.67%
ETH-1.26%
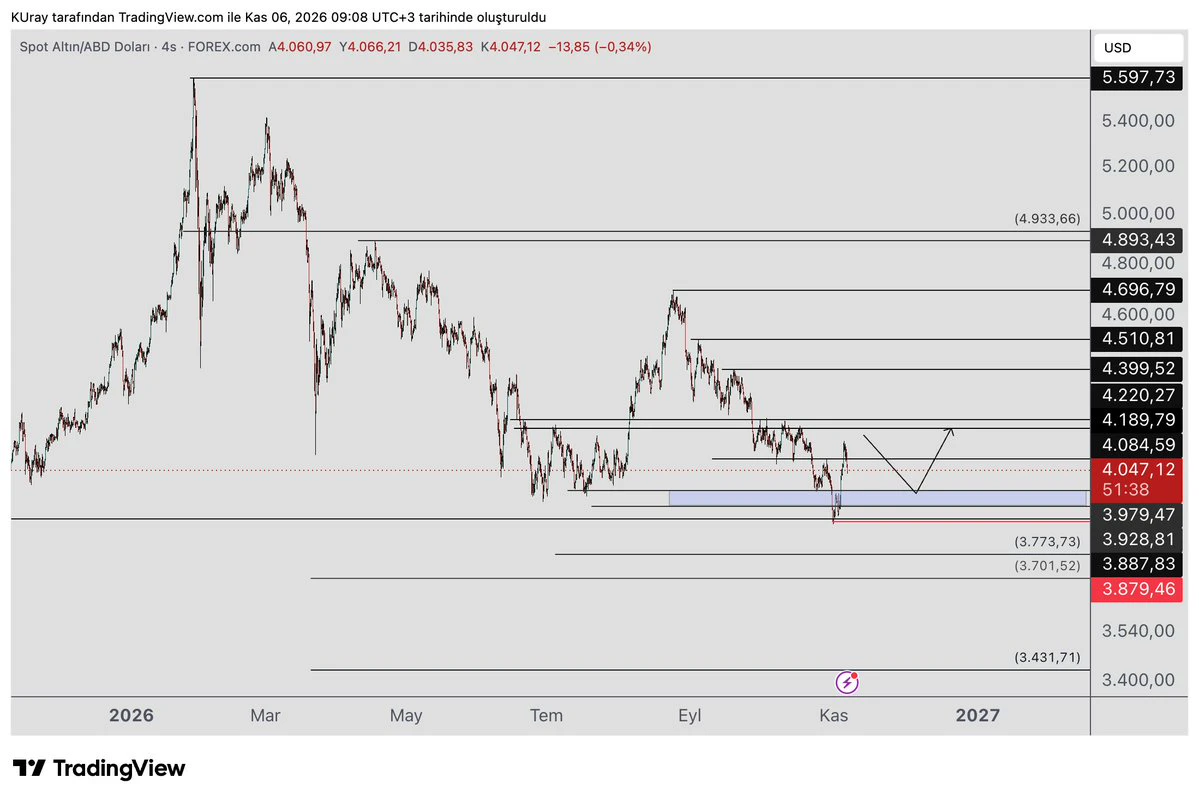
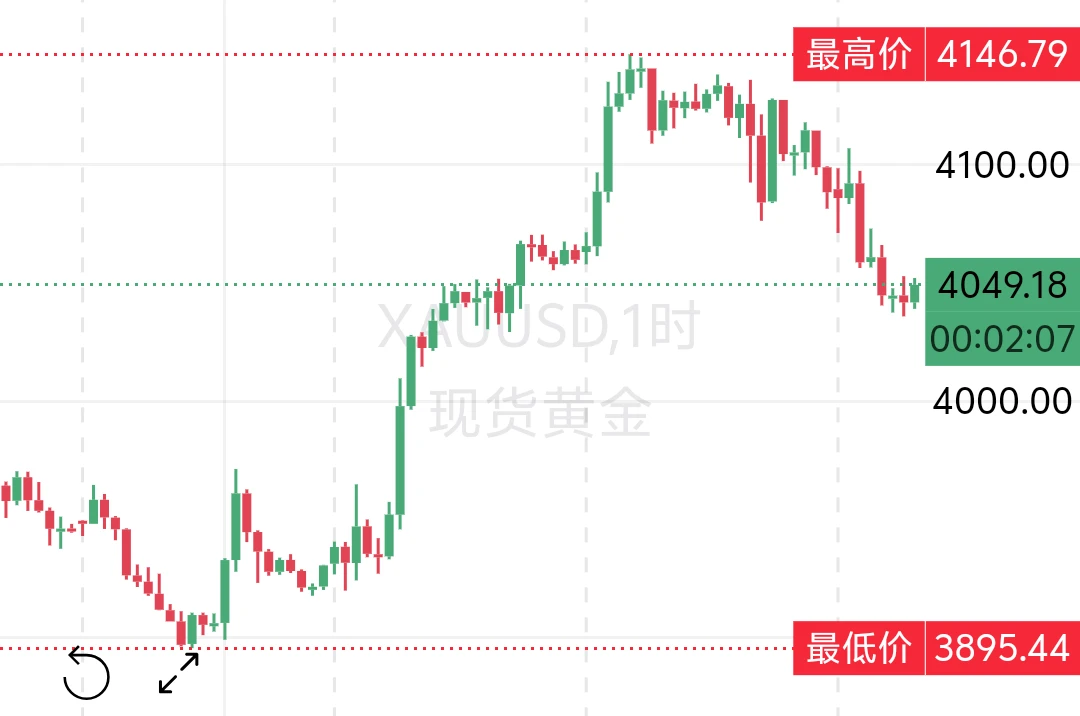
#xauusd #Altın A pullback is occurring after yesterday's rise. The pullback is forming a bullish Libra pattern.
The pattern's entry zone is the blue box at 3979-3928.
Stop: 3879. The first target is 4143, with the next targets at 4220 -4399. After that, as resistance levels are broken, the stop can be raised and the 4510- 4696- 4893-4995-5597 resistance levels can be monitored.
If the decline deepens and price stays below 3880, we can monitor the 3773-3701 zone and the 3431-3301 levels as support. A renewed attempt to rise may come if price holds at any of the support levels.
post-image
XAUUSD-1.00%
  • 1
  • 1
The data looks off. $UVXY is currently at 22.67, up 36.32% in 24 hours, with a high of 24.82 and a low of 16.25—going from 16 to 24 in a single day isn't ordinary volatility; panic buyers are scrambling to get in. Trading volume hit 175.4 million, with volume exploding.
Three possibilities: first, the market is pricing in a tail risk, and smart money is hedging early; second, a short squeeze combined with volatility mean reversion—once an asset like UVXY takes off, the rally can be explosive; third, someone is using UVXY as a short-term panic hedge, suggesting institutions are reducing spot e
UVXY+44.07%
  • 9
  • 2
🏆 Gate Social Year-End Community Gala | Annual Streamer & Creator Awards Now Open for Entries!

🎁 Top 20 rewards revealed for both Chinese-language categories!
🥇 TOP 1: DJI Osmo Pocket 4
🥈 TOP 2–3: AirPods Pro 3
🥉 TOP 4–6: Honor AI Projector
🎁 TOP 7–10: Anker 3-in-1 Power Bank
🏎️ TOP 11–20: LEGO Red Bull Racing Car
🌟 All TOP 20 winners receive an annual honor trophy + exclusive VIP5 badge!

🔥 Annual Streamer × Annual Creator: Compete for annual honors in two categories!
⏰ Entry deadline: November 10
🚀 Enter now and compete for a spot in the annual TOP 20!
👉 https://www.gate.com/zh/a
post-image
  • 5
  • 1
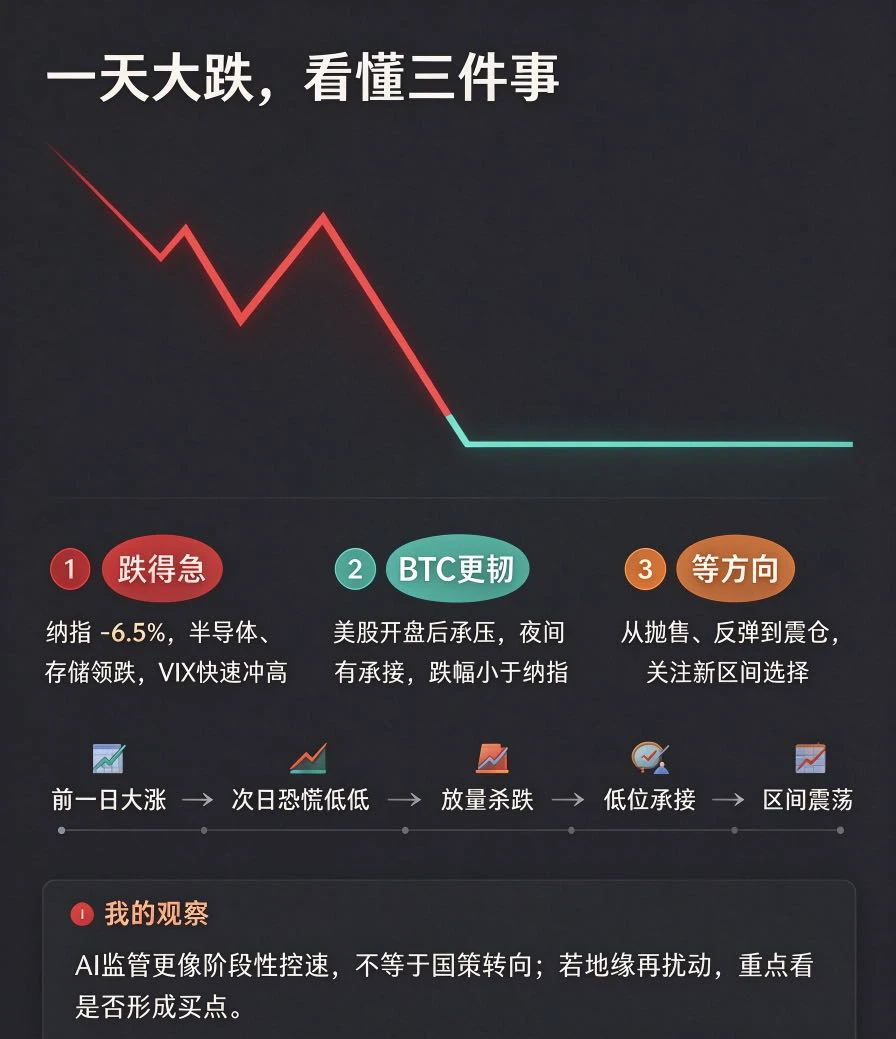
The sharp drop yesterday was simple: the market had just surged the day before, then turned around and plunged hard.
The Nasdaq fell 6.5% in a day, with memory and semiconductor stocks hit even harder. The fear index surged, trading volume swelled, and everyone panicked. There were two main triggers: the US plans to restrict data centers and tighten AI expansion, and rumors of war in the Middle East. Risk assets were all sold off.
As for Bitcoin, the drop wasn’t mainly due to heavy internal selling pressure. It was mostly dragged down after the US stock market opened, when panicked investors s
post-image
BTC-0.65%
Friday, how should we respond to continued market pressure?
On the 4-hour chart, after consecutive corrections, the overall trend remains weak, but the decline has failed to extend further. Bollinger Bands are moving sideways; MACD has formed a bullish crossover and is moving up, while the three KDJ lines are diverging downward in a bearish formation, showing clear disagreement between bullish and bearish indicators. The current price is in a low range, with no signs of further downside for now. After a short-term wick rebound, we are temporarily not bearish and expect a slight continued rebo
post-image
BTC-0.67%
May be we are staying here for these days…
Bitcoin Bull Run?
Altcoin Season?
End Goal: Portfolio BEP…
post-image
BTC-0.67%
Friday afternoon, Nov. 6: Zhongling Gold Strategy — NFP night tonight!

After a sustained decline, bears have been releasing downside momentum for some time, and the market may be due for a short-term oversold rebound. Gold has retreated in steps from its previous high of 4138. After probing lower repeatedly, it has tested support around 4035 several times without a decisive break. The support has held up, creating an opportunity for an oversold rebound.

Although MACD remains below the zero line, the expansion of the green bars has slowed, showing signs that bearish momentum is fading. The ba
post-image
XAU+0.38%
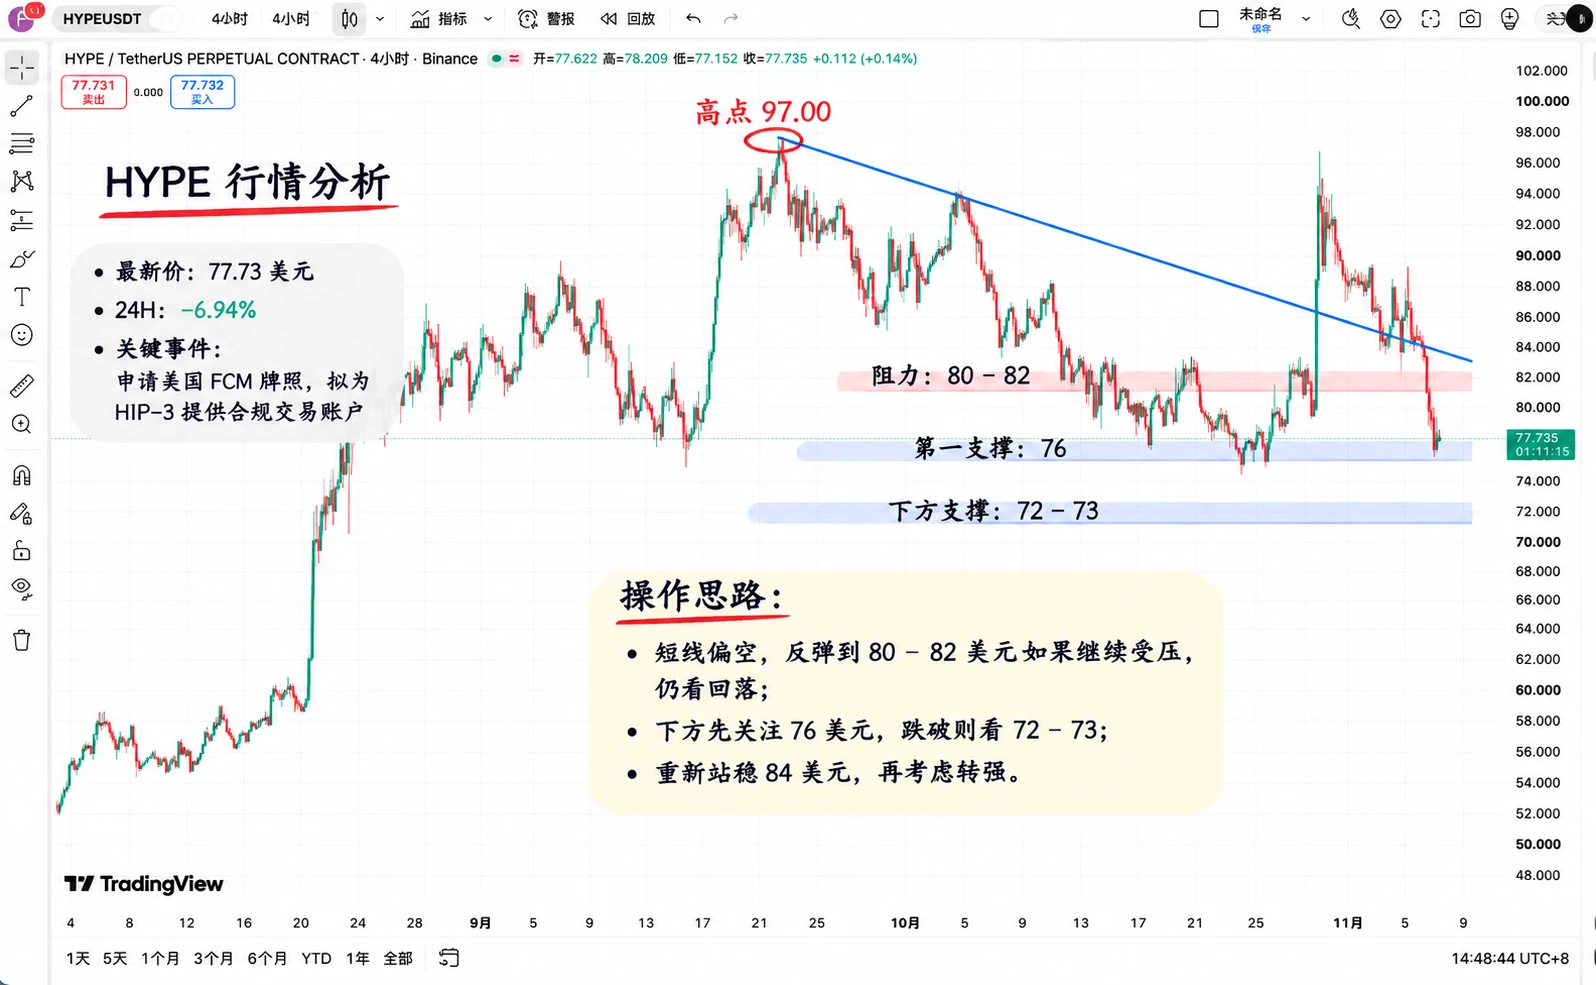
$HYPE This time it's genuinely a bit awkward! More good news from the U.S. regulated market, yet the token price fell nearly 7% and couldn't even hold $80.

On November 6, HYPE was trading at around $77.64, after falling as low as $76.24. Just a few days ago, it surged to $97; now it's given back about one-fifth of its gains.

First, the news.

Hyperliquid Strategies recently disclosed that a subsidiary is applying for U.S. futures commission merchant (FCM) status, preparing to offer compliant trading accounts for HIP-3 markets.

This is significant, but note that it's only an application and
post-image
HYPE+0.33%
BTC-0.65%
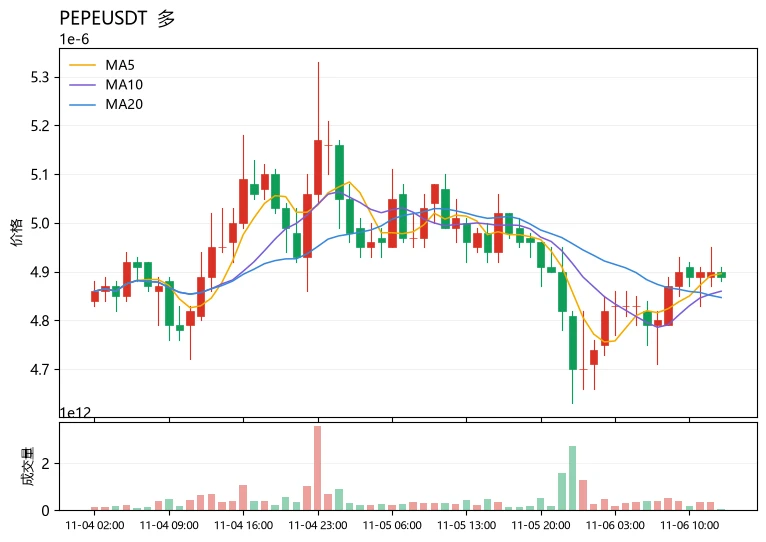
Amid fear, which way is capital leaning? The answer is bullish—$PEPE 's contract structure is quietly shifting.
At around the current price of 4.89e-06, MA5 (4.896e-06) has crossed above MA20 (4.847e-06). The short-term moving average turning upward is the first sign of capital returning; the MACD histogram at +1.433e-08 remains bullish, while RSI at 51 is neutral-to-warm, indicating that bulls are not overheated and still have room to add positions. The Fear & Greed Index at 28 is in the fear zone, with retail sentiment bearish, yet the price has not broken down. This divergence of “cold sent
post-image
MSTRB
MSTRBMSTRB
Four.meme
MC:$3.29KHolders:4
0.07%
PEPE+0.97%
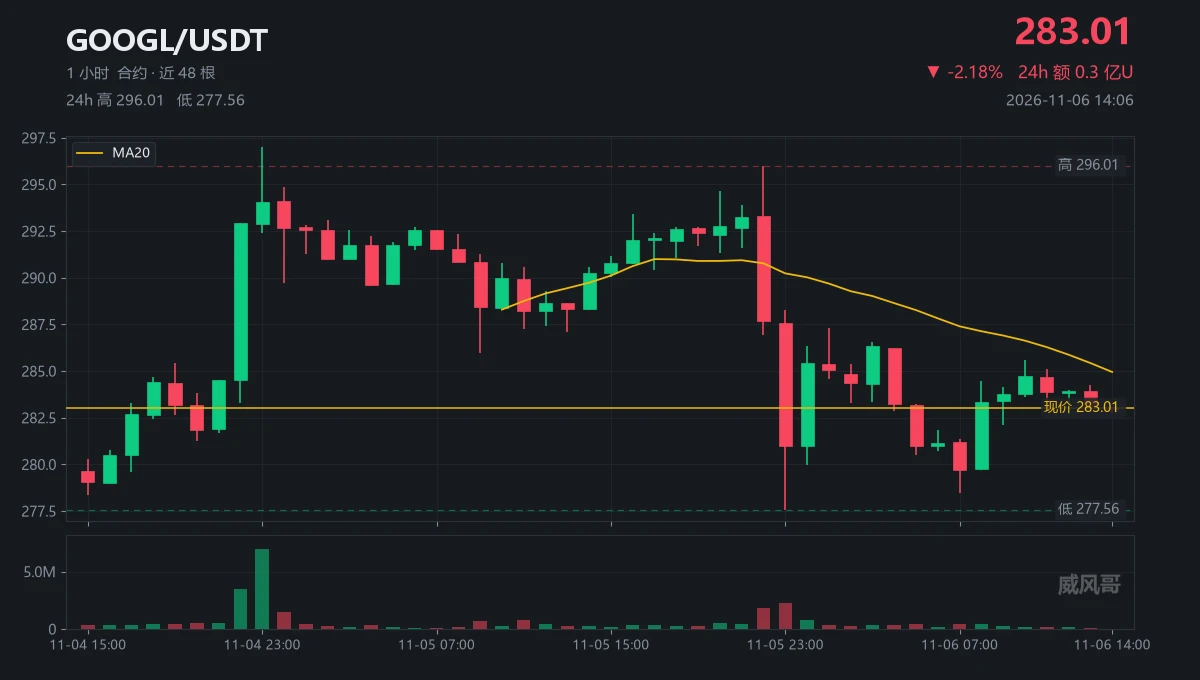
$GOOGL is down 2.38% now; don’t be too quick to read this as a U.S. stock move.
The U.S. stock market closed at 5 a.m.; it opens again at 10:30 tonight.
Who is the token price being set for during these eight-plus hours?
Market makers, not the company.
Q: Where does this price come from while the market is closed?
A: $31 million—that’s its total trading volume over 24 hours.
Q: Can that little money price a stock with a $2 trillion market cap?
A: No. It can only set a shadow price.
Q: Then what does it mean that it fell to 277.56 overnight?
A: Someone placed an order in a thin market; the six
post-image
GOOGL+0.11%
  • 6
#10月非农数据聚焦
The October US Nonfarm Payrolls Report is becoming one of the most closely watched economic events of the week. Investors, traders, economists, and financial institutions are preparing for fresh employment figures that could provide important clues about the strength of the American economy and the Federal Reserve's future monetary policy.

The US labor market has become an important source of uncertainty for financial markets. Although the economy continues to demonstrate resilience in several areas, hiring activity has shown signs of slowing. This makes the October employment repo
BTC-0.67%
  • 3
BTC UPDATES
live-cover
LIVE2,088
$BTC
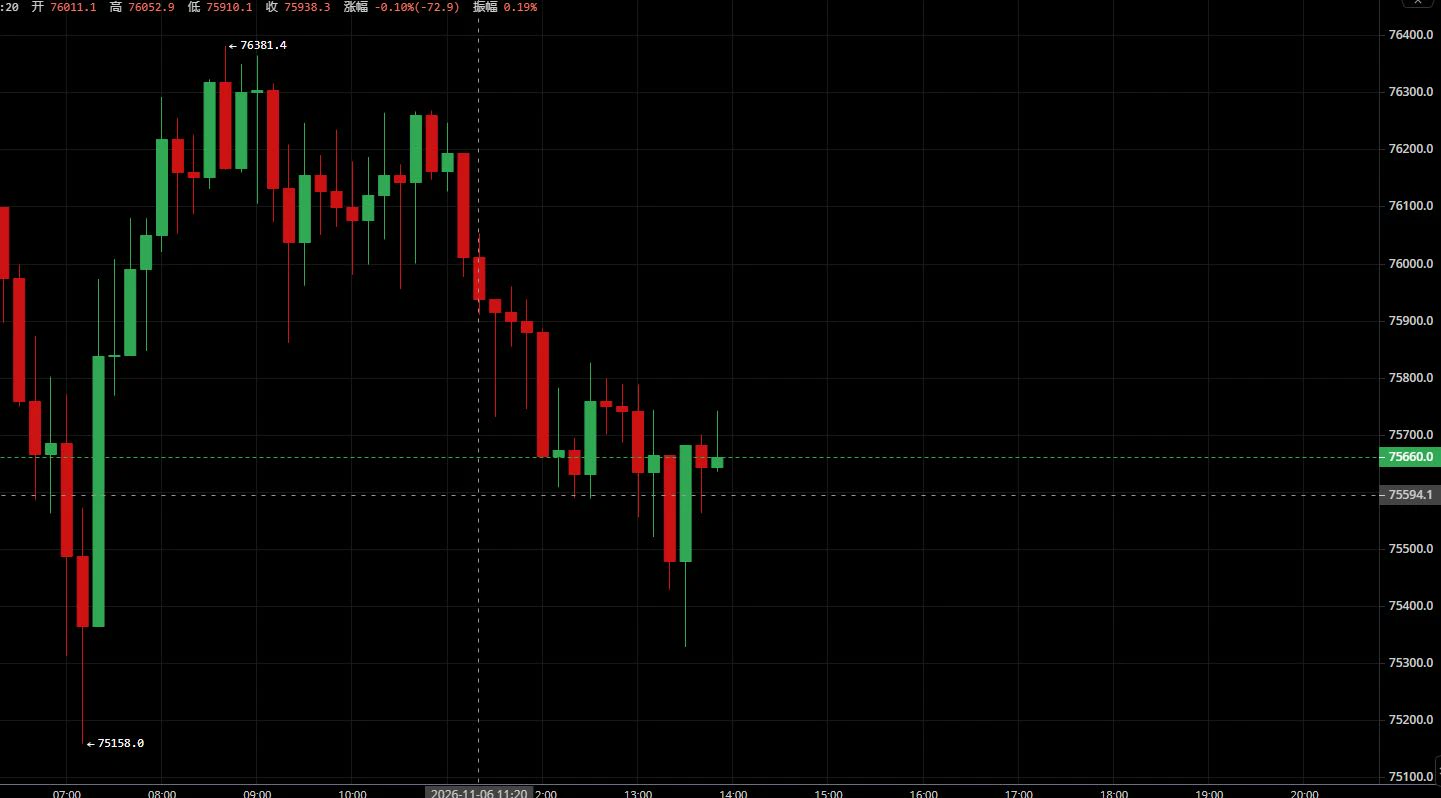
The shorting-at-higher-levels strategy played out precisely; the rebound met resistance and sold off as expected.
The early-session plan called for short positions in the 76400-76500 range. Price peaked at 76381.4, met resistance precisely, and pulled back. The first target at 75700 was reached for a smooth take-profit, with the price level and pace of the decline perfectly matching the forecast.
#美股史诗级抛售
The broader bearish trend remains unchanged, and every rebound presents an opportunity to enter short positions at higher levels.
If the price subsequently breaks decisively below the
post-image
Top-OutMemo
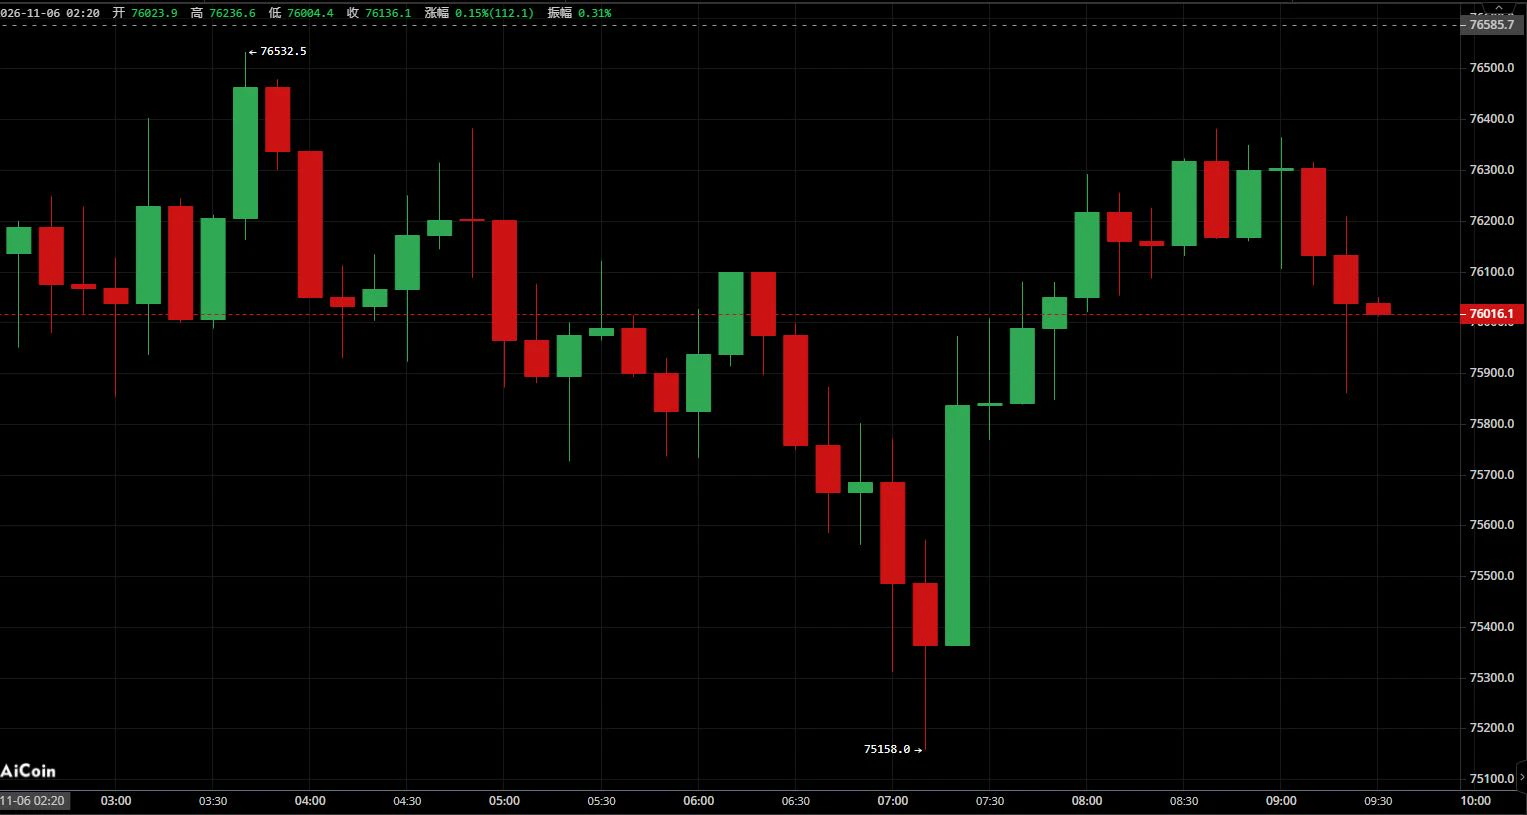
11.6 $BTC Today's outlook
After dipping overnight to a low of 75158, the market saw an oversold rebound. It is currently in a weak recovery phase, while the broader bearish trend remains unchanged. Further downside is expected after the rebound meets resistance. The strategy is to focus on shorting rallies, with short-term longs at support as a secondary approach.
#Gate股票畅聊季
Support: 75600-75700, 75100-75200
Resistance: 76400-76500, 76800-77000
Shorts: Enter in batches on a rebound into the 76400-76500 range, with a stop-loss at 77050 and a first target of 75700; if support breaks, look for 75200
Short-term longs: If the price stabilizes after retesting the 75600-75700 range, consider a small long position. Move quickly in and out, with a stop-loss at 75100 and a target of 76200-76400
repost-content-media
BTC-0.67%
  • 1
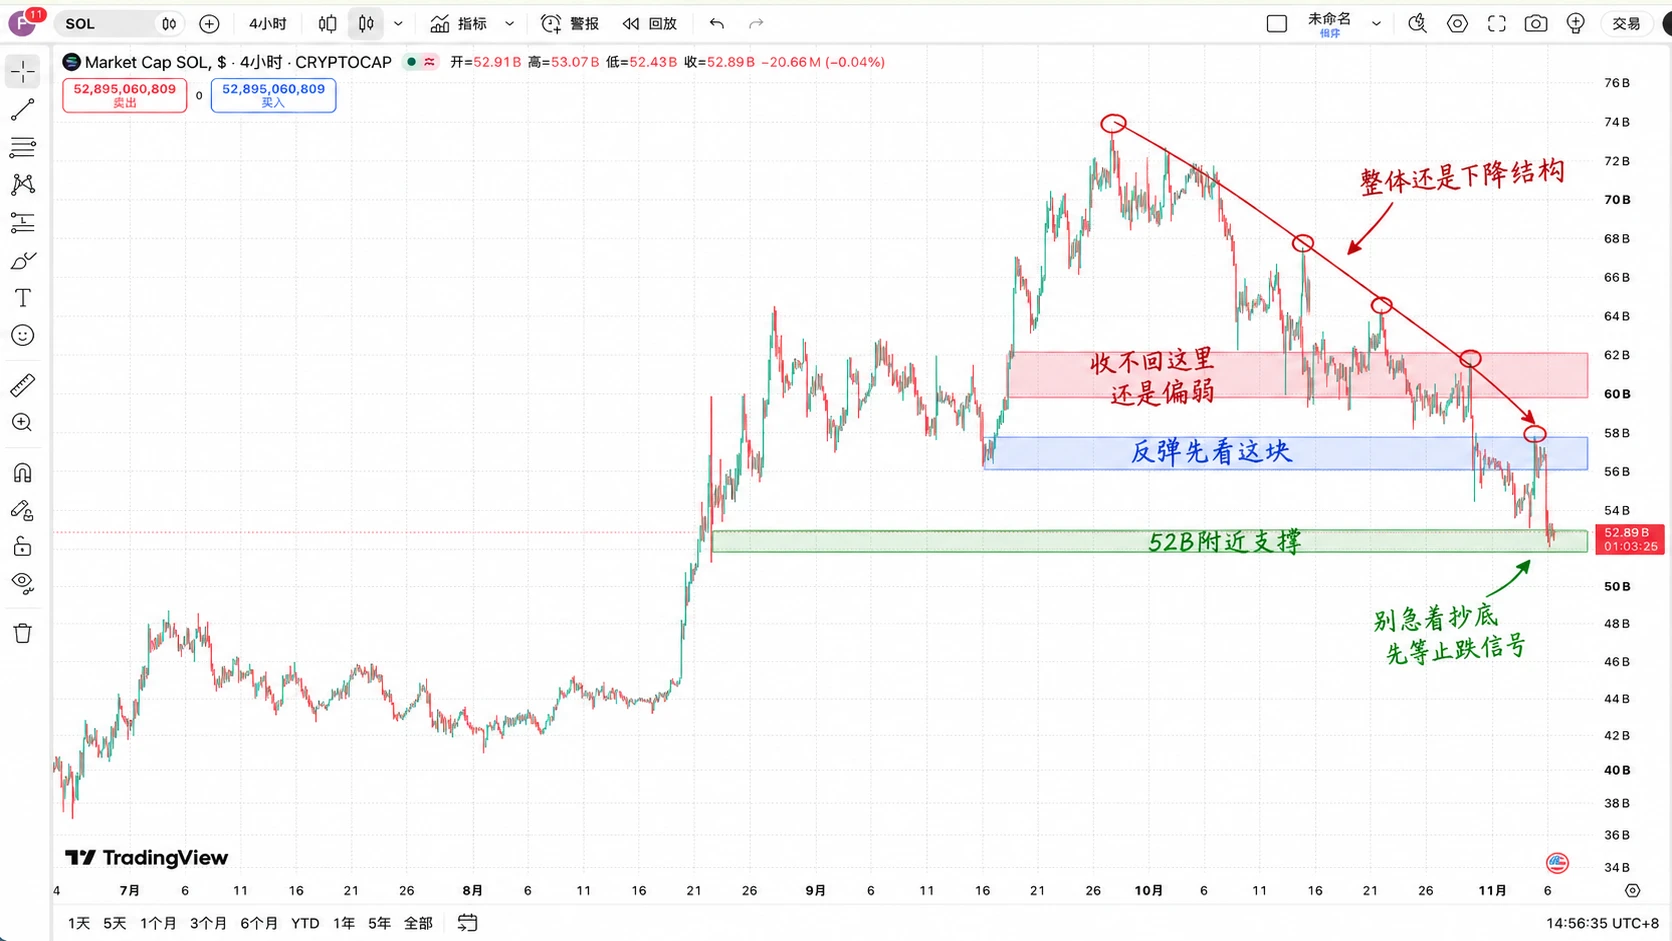
$SOL Can't even hold $90 anymore! It was pushing toward $97 yesterday, and today it plunged to a low of $88.24. It’s down more than 20% in a month, and this one really hurts.

Bottom line: I remain bearish in the short term. Don’t rush to buy the dip just because it’s fallen so much.

This downturn isn’t just a SOL problem. U.S. tech stocks are being sold off, BTC has fallen back to around $75,000, and the entire crypto market is under pressure.

But SOL has another, more troubling issue.

The latest price is $89.7, down 6.8% over 24 hours, with futures trading volume of about $2.375 billion.
post-image
SOL-0.74%
📢 Live Signal Card · Repost Edition
Source: Brother Sanma futures direction: $BTC Long entry: 82388 Target: 84888 / 87200 Stop-loss: 81000
Speaking of which, I reposted Brother Sanma’s $BTC trade earlier today, and here we go again. It’s happening so often I’m almost embarrassed to say “just reposted” 🫠
Same as always: I’m only here to repost; whether to follow and how much to put in is up to you, babes. The market can go crazy, but don’t let your position get out of hand 😤
Personal records shared for reference only, not investment advice. #adp US private employment increased by 86,000 in
BTC-0.65%
ADP+1.21%
Load More

Join 40 M users in our growing community

⚡️ Join 40 M users in the crypto craze discussion

💬 Engage with your favorite top creators

👍 See what interests you

Trending Topics

USStocksFaceHistoricSelloff

2.23k Views3.59k Discussing

U.S. stocks suffered a sharp selloff on Thursday, with the Nasdaq closing down more than 5% and the Philadelphia Semiconductor Index falling over 12%. AI and chip stocks including $NVDA and $AMD were hit especially hard. Markets are reassessing AI valuations, data-center spending and future returns. Is this just short-term deleveraging, or the start of a deeper correction in the AI trade? Which sectors are you watching next?

GateLaunchesPoSECProofOfSecurity

13.06k Views580 Discussing

USNonfarmPayrolls

11.25k Views4.03k Discussing

View More