Square
Following
Hot
News
Notifications
Profile
Share your thoughts
placeholder
Article
Price Action Essentials: How to Read One Candlestick and Align Three Timeframes 1. First, dissect a candlestick: four prices, four kinds of information. Open: the handoff point reflecting the result of yesterday’s battle between bulls and bears. High/low: who tested the waters and who pushed them back. Close: the verdict on who won the battle—the closing price is always the most important. Wick length: the degree of rejection. The longer the wick, the less conviction in that direction. The same large bullish candle: closes at the high → strong, likely to continue tomorrow; closes in the middle
post-image
BTC-0.65%
ETH-1.23%
SOL | Short 🔴 | Bearish | 15m 24h: -1.14% | Volume: 490.2M USDT. Short rationale: Price is below EMA200; EMA20/50/200 are bearishly aligned; RSI14 is 39.5; the MACD histogram is negative; ADX14 is 28.2; volume is 1.49 times the 20-candle average; trend pullback/continuation. Entry price: 89.1. Stop-loss: 89.7158. Take-profit 1: 88.3303 | Take-profit 2: 87.8685 | Take-profit 3: 87.2527. Entry is for reference only; do not chase the trade. The strategy is invalidated if the stop-loss level is hit. This is a technical analysis plan only and does not constitute investment advice. $SOL
post-image
SOL-0.77%
Trenches
ZIG
Z
bade
b
ZIG
0x8c...1145
Market Cap
$.
Change
.
24h Vol
$.
Holders
.
BTC
B
bade
b
BTC
C5xp...pump
Market Cap
$.
Change
.
24h Vol
$.
Holders
.
STONK
S
bade
b
STONK
6GmA...UNgx
Market Cap
$.
Change
.
24h Vol
$.
Holders
.
IDOL
I
bade
b
IDOL
0x3b...ab07
Market Cap
$.
Change
.
24h Vol
$.
Holders
.
scamsem
s
bade
b
scamsem
41Wp...pump
Market Cap
$.
Change
.
24h Vol
$.
Holders
.
$ETH ‌ Bearish (Downward Bias) Weakly bearish The current price of ETH at 2,235 USDT indicates selling pressure. The MA5 is positioned below the MA10 and MA30. The MACD is negative, signaling bearish momentum. Volume is low, suggesting that any upward movement lacks strength. Conclusion: ETH has the potential to continue its decline toward the 2,223–2,206 USDT range. If it manages to break through the 2,240–2,254 level, there is a possibility for a rebound.

Note: Crypto and stock transactions carry the risk of loss. Please conduct your own research (DYOR) before trading. This information is
post-image
ETH-1.23%
$BTC ‌ shows a weakening trend and is moving sideways, with the potential for further decline. The price is trading below the MA10 and MA30, indicating that selling pressure remains dominant. The MACD is approaching the neutral zone, but bullish momentum is not yet strong. Conclusion: BTC may test the support level at 75,570–75,000. If this support is broken, the decline could continue. If it holds, there is a possibility of a limited rebound.

Note: Crypto and stock transactions carry the risk of loss. Please conduct your own research (DYOR) before trading. This information is for general pu
post-image
BTC-0.65%
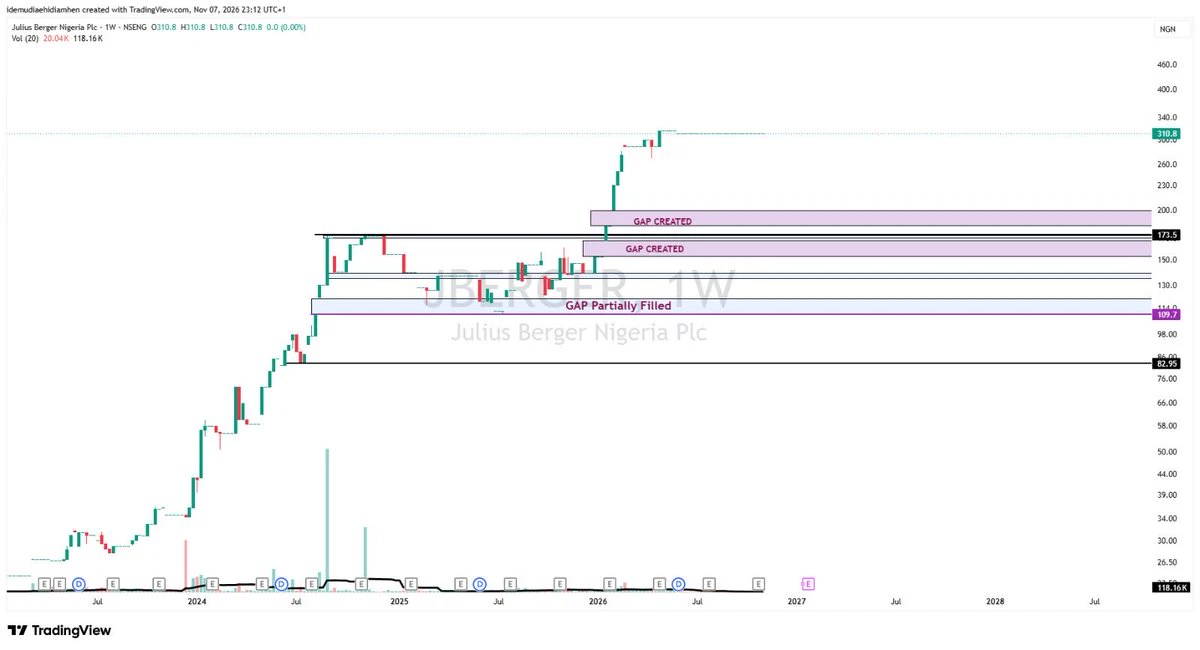
JBERGER
High time JBERGER undergoes some corrections.
Time to start paying attention to our former NAGASHEKU stock.
Hit an ATH of N315/share.
The only region I am watching is the gap of N183-N199.6 created in January 2026 which led to the ATH.
If I do not see that correction then I will not play this
#NFA
post-image
How do you build your own trading system in crypto?
Finding a trading system is not really about finding a method; it’s about finding “yourself.”
1. Give yourself a checkup first (to decide your direction)
How many hours a day can you watch the charts? Less than 2 hours → trade 4H/daily swings; if you can watch all day → then you’re suited to intraday trading.
Would losing 5% keep you up at night? If so → cut your position size in half again and lower your leverage.
Are you impatient or steady? Impatient traders will inevitably get shaken out of trends, so they can only scalp.
Don’t copy someo
post-image
BTC-0.65%
ETH-1.23%
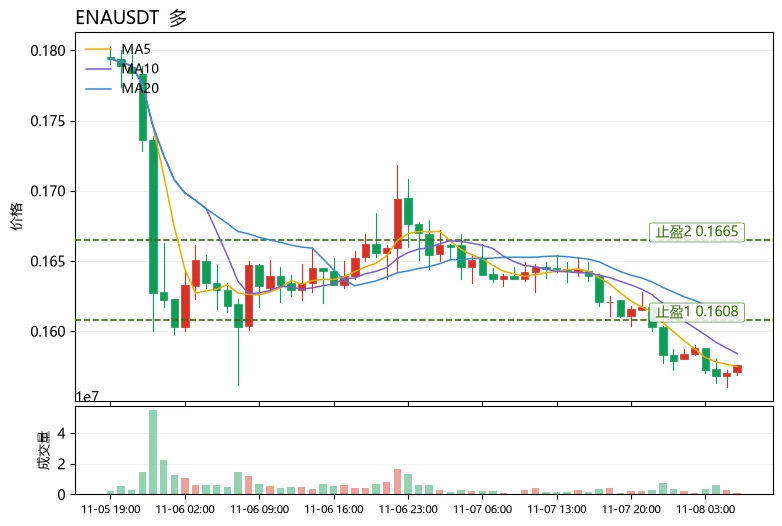
$ENA Current price is 0.1576, close to the lower Bollinger Band at 0.1552. MA5 (0.15748) remains below MA20 (0.160845), and the bearish alignment is intact. RSI at 31.5 is approaching oversold territory. The MACD histogram at -0.0002589 shows bearish momentum, but it is narrowing. The funding rate of +0.0050% indicates longs are still paying to hold positions, while the Fear & Greed Index at 25 is in the extreme fear zone. Structurally, this is a weak equilibrium near the end of a downtrend: the lower band at 0.1552 and oversold RSI form the first support; MA5 at 0.1575 is the short-term divi
post-image
ENA+8.04%
PEPE+0.97%
BNB-0.76%
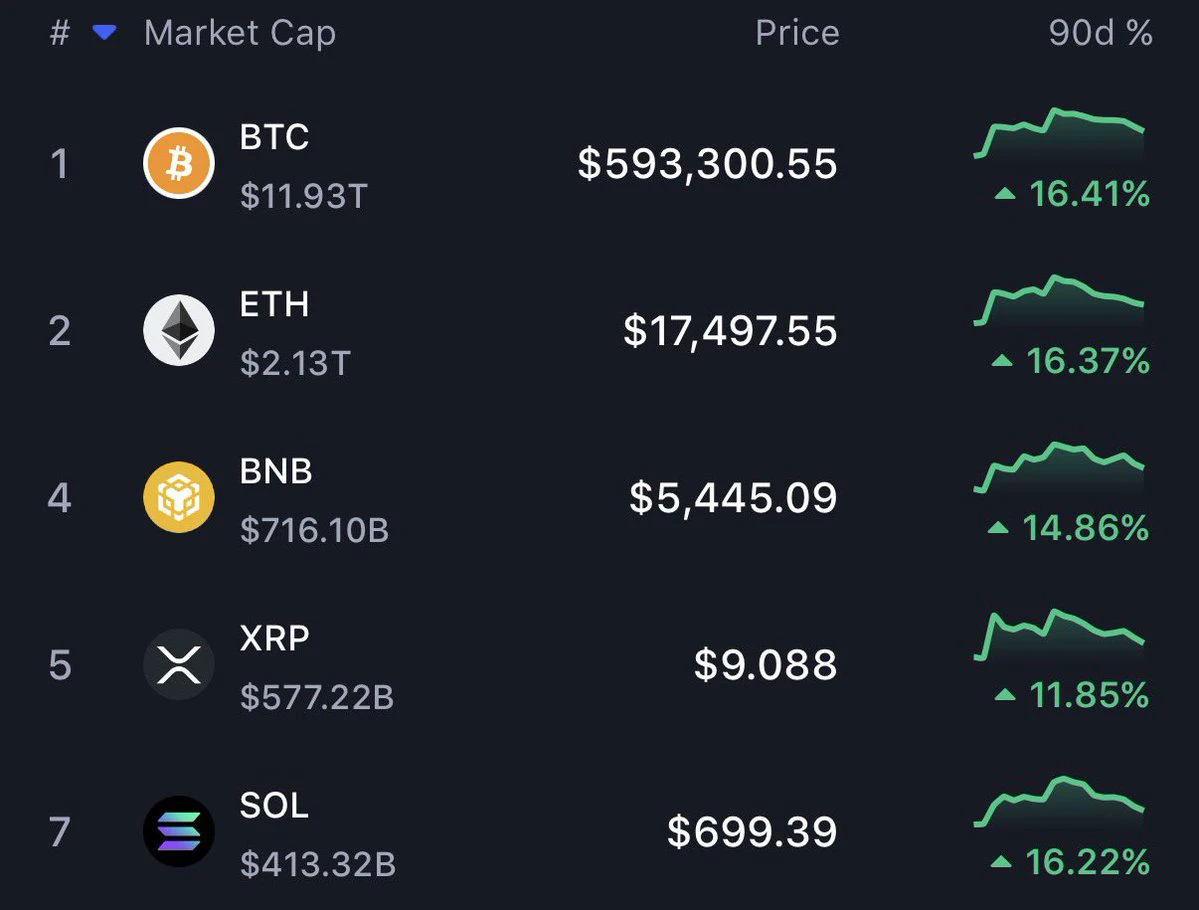
pov: crypto prices after republicans win in 2028
post-image
Crypto Market update
live-cover
LIVE82
A Trading System Isn’t “Designed”—It’s “Found Through Filtering”

Step 1: Track your behavior for 30 days before settling on a system. Each day, note three things: when you have time to watch the charts, what signals make you itch to trade, and how much of a loss makes you uncomfortable. After 30 days, you’ll discover your “physiological parameters”—some people can only trade the Asian session, while others panic as soon as they hold a position overnight. Your system has to fit those parameters; otherwise, even the best strategy will be impossible to follow.

Step 2: Use elimination to narrow
BTC-0.65%
GN weekend crew 🌙 Quiet tape tonight.
US cash is closed, crypto just chopping. $BTC near $75.7K, $ETH around $2.23K, basically flat after Friday's dip into the mid-75s. Spot BTC ETFs saw about $1.3B leave this week, and Fear & Greed is still Extreme Fear. Thin books. I'm not forcing size.
Monday: Fed speakers (Bowman, Goolsbee, Barkin), China CPI/PPI in Asia hours. Real event is Tuesday CPI.
Weekend liquidity loves fakeouts. Leaving room for the open.
#Bitcoin #Crypto
post-image
BTC-0.67%
ETH-1.26%
BTC ETH MARKET PREDICTION
live-cover
LIVE73
$SOL ‌ has the potential to weaken toward the 88.80–88.30 area. The price is currently below the MA5, MA10, and MA30. The MACD remains in negative territory, indicating bearish pressure. Buying volume is not yet strong enough to reverse the trend. Conclusion: SOL maintains a bearish bias. A minor rebound is possible, but the downtrend remains dominant as long as the price fails to break through the 89.60–90.00 range.

Note: Crypto and stock transactions carry the risk of loss. Please conduct your own research (DYOR) before trading. This information is for general purposes only and does not co
post-image
SOL-0.74%
The real power brokers in the climate policy game have never been at the ballot box. The agenda laid out in 1985 has carried through to today, with NGOs as the capillaries, tax-exempt funding as the blood, and feedback loops growing ever tighter. Ordinary people see only the emissions figures, not who’s making the rules. No need to jump to conclusions just yet—let’s see how things unfold.
post-image
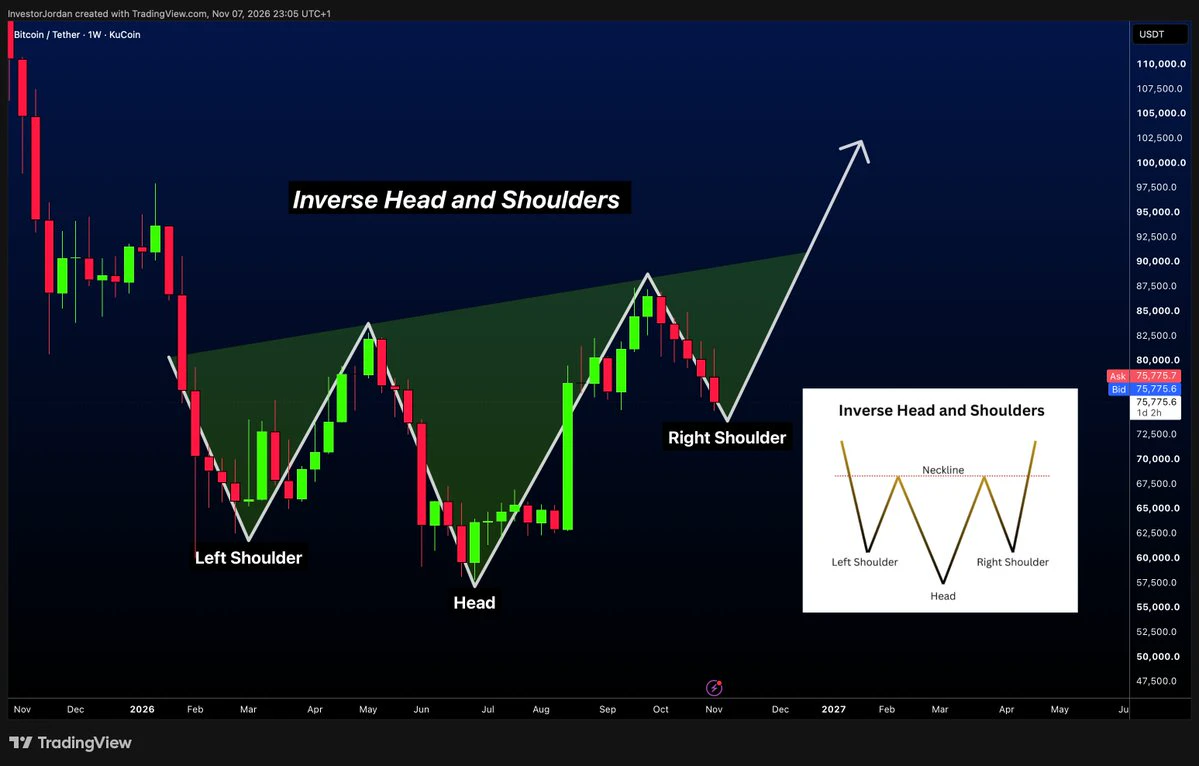
I AM SHAKING.
We have a PERFECT Inverse head and shoulders setting up on Bitcoin.
The same pattern that sent $BTC from $50k to $126k last year.
GET READY...🚀
post-image
BTC-0.67%
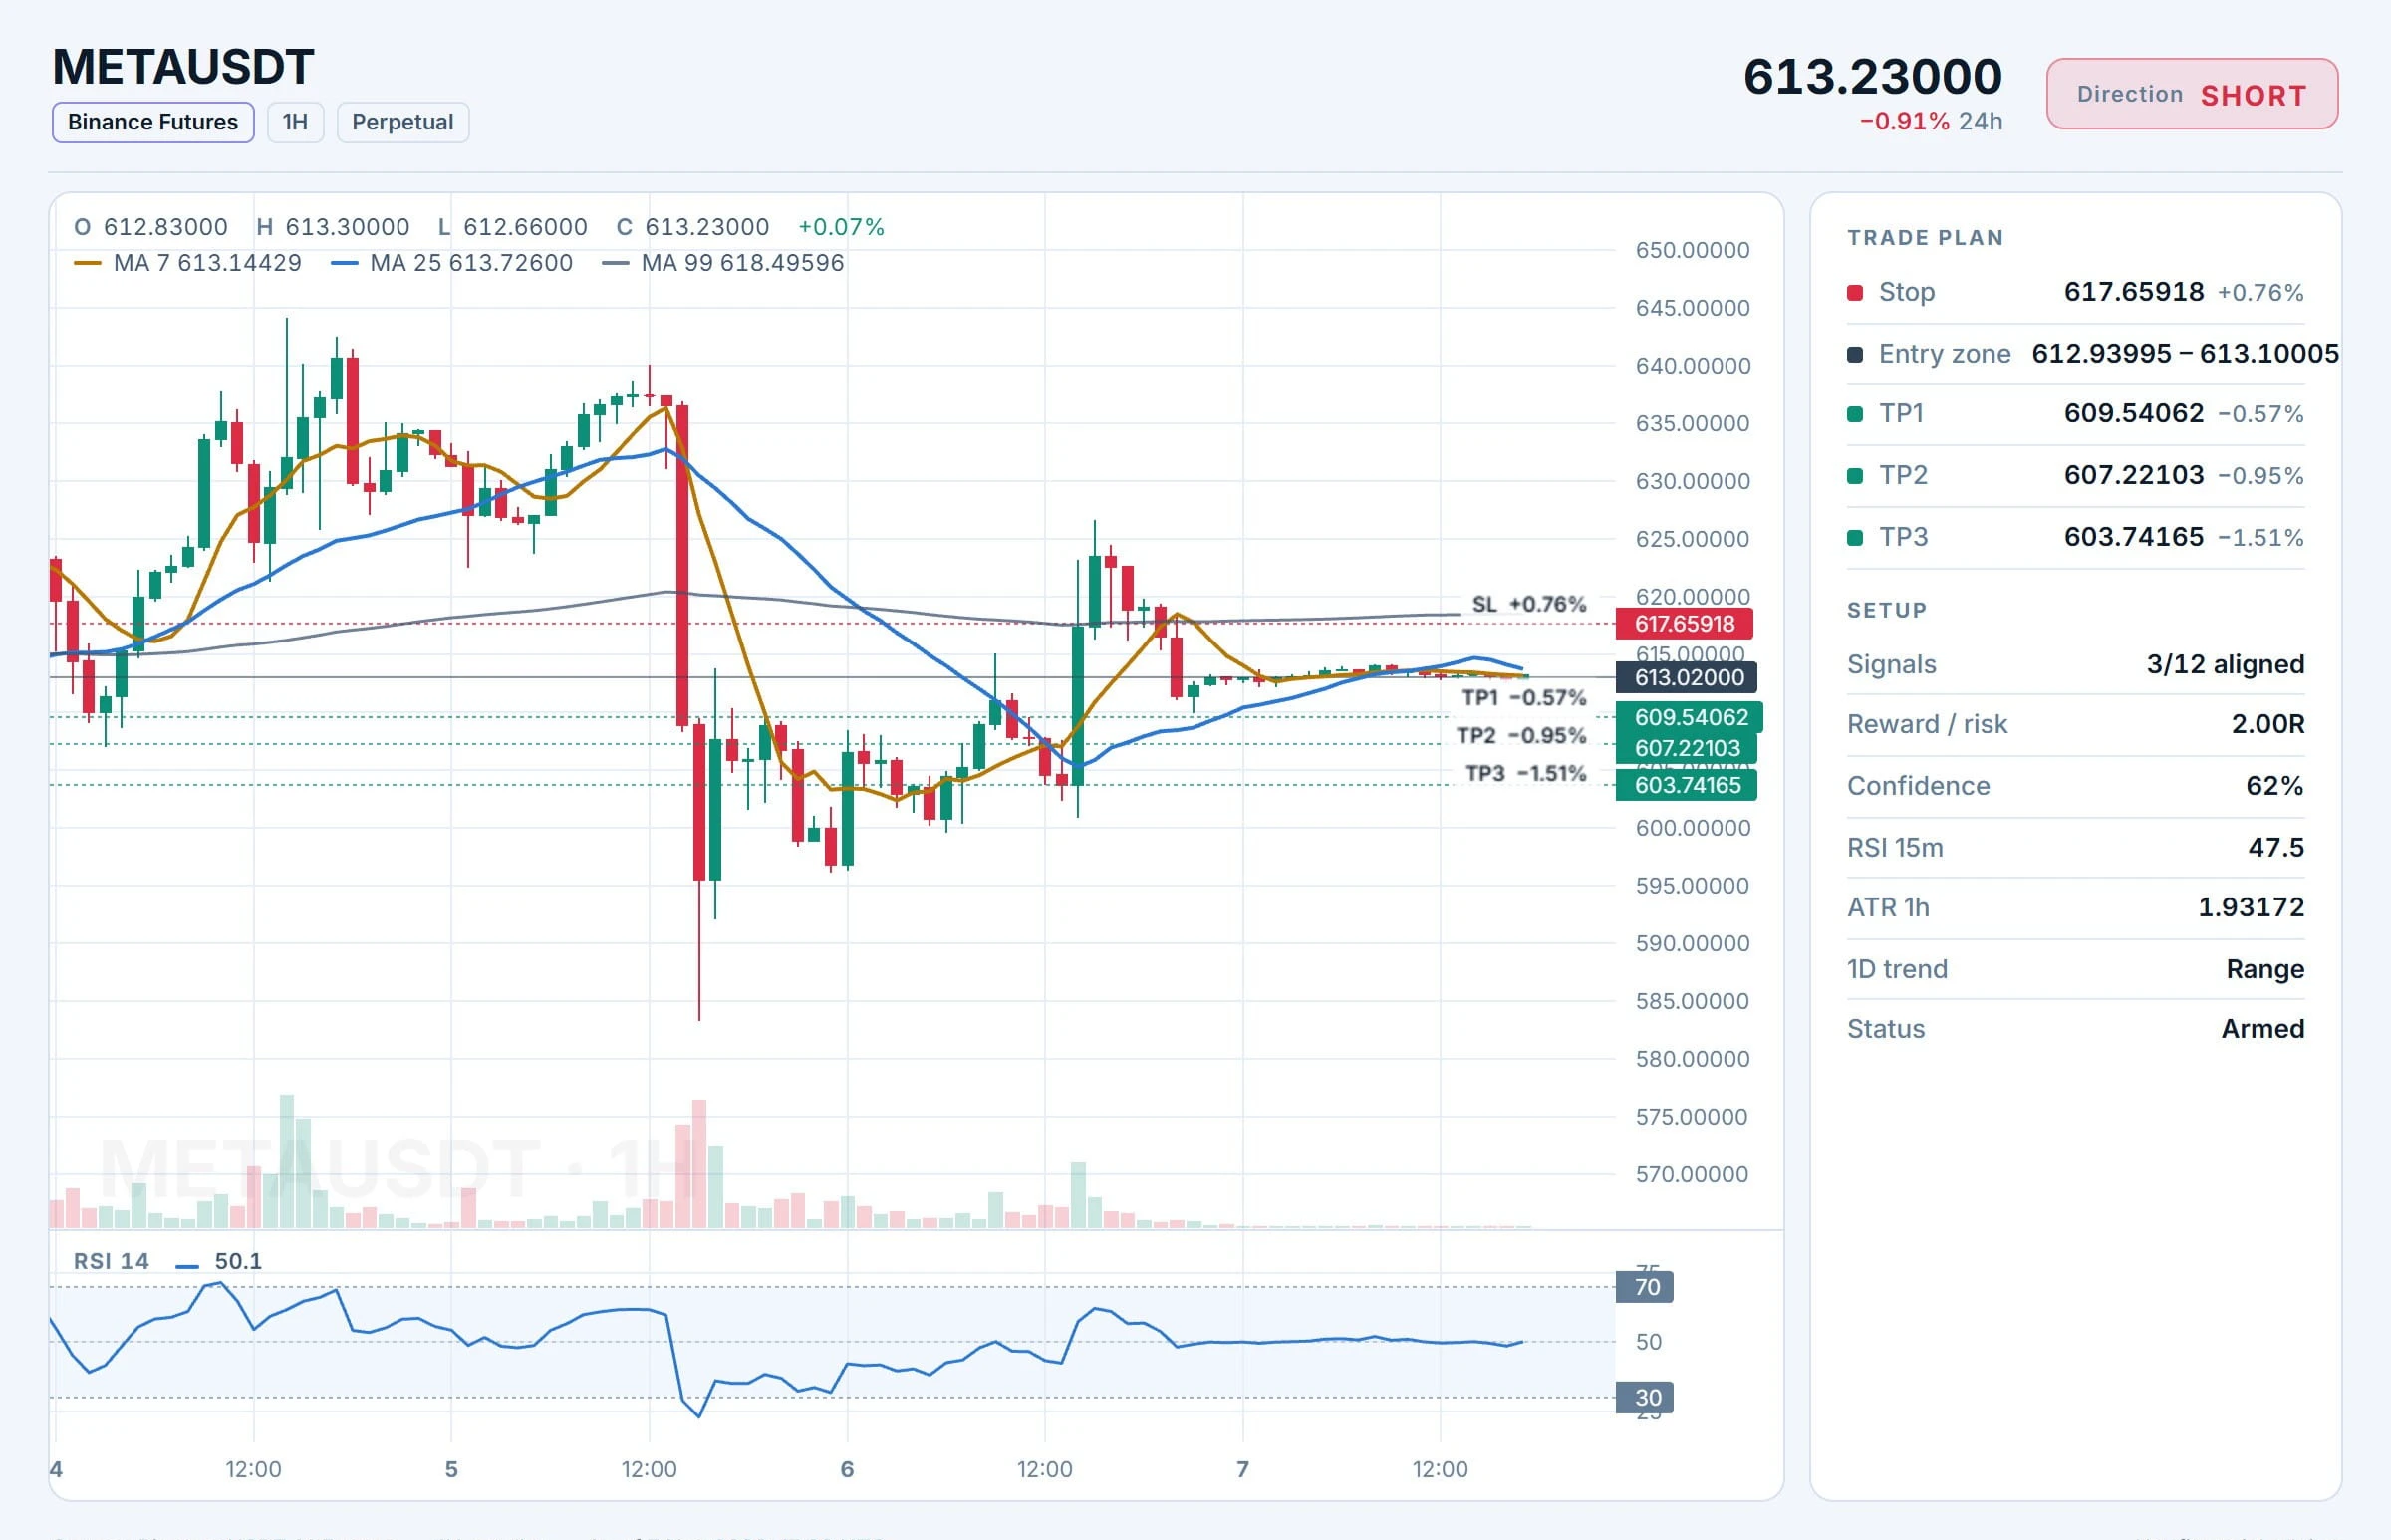
BULLS CAUGHT IN A TRAP — $META USDT SHORT SETUP READY TO GO

$META /USDT

Position: SHORT

Entry Range: 612.93995 – 613.10005

Take-Profit Levels
🔹 TP1: 609.54062
🔹 TP2: 607.22103
🔹 TP3: 603.74165

🛑 Stop-Loss: 617.65918

$META ‌
post-image
META-0.07%
This guy has a really strong mentality. He's long BTC and ETH and sitting on a combined unrealized loss of over $2 million, yet he's still so calm. But looking at his liquidation price, he doesn't seem to have much to worry about. $BTC $ETH
post-image
BTC-0.65%
ETH-1.23%
$BTC Testing The Neckline Of AKA Trigger Line Of The Head & Shoulder Reversal Pattern
A breakdown below will activate the target and lock it in.
NFA, DYOR ⚠️
#Crypto #Trading #BTC
post-image
BTC-0.67%
Axiym, which ran the rails for Hyundai Card's stablecoin pilot, moved a record $529M in stablecoin payments on Avalanche in Q3, 4.4 times a year earlier.
That is more than $5.7M a day.
@avax
AVAX-0.10%
Load More

Join 40 M users in our growing community

⚡️ Join 40 M users in the crypto craze discussion

💬 Engage with your favorite top creators

👍 See what interests you

Trending Topics

USAIStocksHitHard

21.44k Views3.68k Discussing

U.S. stocks sold off sharply on Thursday, November 5 (UTC). The Nasdaq closed down around 5.5%, entering correction territory, while the Philadelphia Semiconductor Index plunged roughly 12%, with chip stocks including $NVDA and $AMD posting steep losses. Beyond profit-taking, investors are growing concerned about the pace of AI data center construction, capital spending, and future returns on investment. The key question now is whether the AI sector’s lofty growth expectations need to be repriced. Where do you think the next opportunities will emerge: chip stocks, tech giants, or other sectors?

USNonfarmPayrolls

35.66k Views4.35k Discussing

StakeOnLaunchpoolToShare450KVLX

10.5k Views832 Discussing

View More