




Square
Following
Hot
News
Notifications
Profile
Share your thoughts
placeholder
Article
BTC ETH CRYPTO MARKET UPDATE
live-cover
LIVE1,421
#AnthropicIPO6xOversubscribed

Anthropic IPO Demand Signals Growing Investor Confidence in the Artificial Intelligence Industry

The reported sixfold oversubscription of Anthropic's anticipated initial public offering highlights the extraordinary level of investor interest surrounding the artificial intelligence industry. As one of the prominent companies developing advanced AI technologies, Anthropic has attracted attention from investors seeking exposure to the next generation of technological innovation. Strong demand for a potential public offering reflects expectations that artificial in
post-image
ANT
ANT蚂蚁
Gate.Fun
MC:$0.1Holders:0
0%
Trenches
mihao
m
bade
b
mihao
4Cxj...pump
Market Cap
$.
Change
.
24h Vol
$.
Holders
.
FOOD
F
bade
b
FOOD
FTu5...pump
Market Cap
$.
Change
.
24h Vol
$.
Holders
.
IDOL
I
bade
b
IDOL
0x3b...ab07
Market Cap
$.
Change
.
24h Vol
$.
Holders
.
AGT
A
bade
b
AGT
0x5d...e274
Market Cap
$.
Change
.
24h Vol
$.
Holders
.
NIO
N
bade
b
NIO
7SL2...pump
Market Cap
$.
Change
.
24h Vol
$.
Holders
.
Many traders, after losing money in their accounts, immediately think about making it back as quickly as possible. But there’s a very important mathematical point that is often overlooked: the percentage loss and the percentage gain needed to break even are not symmetrical.

Suppose your account originally had 1000 USDT.

If you lose 10%, your account will have only 900 USDT left. To get from 900 USDT back to 1000 USDT, you need to make 100 USDT, or gain about 11.11%—not 10%.

If you lose 20%, your account will have 800 USDT left, and you need a 25% gain to break even.

If you lose 30%, your a
post-image
The accounts created this month are gradually improving, and we’re optimistic about the trend as we move forward steadily
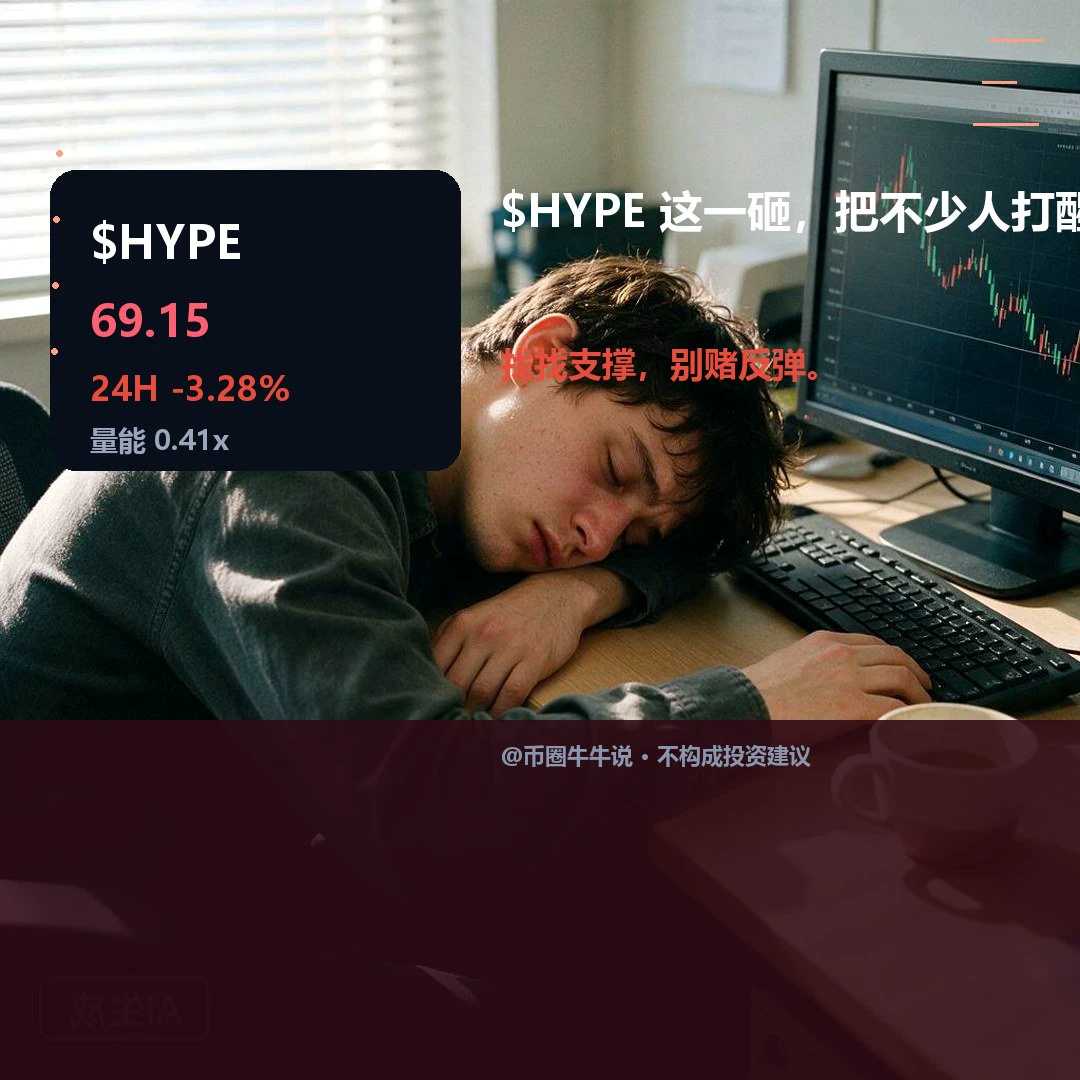
$HYPE Currently at 69.152, 24H -3.28% (range: 67.095–75.301). The 1H trend is weak, with an RSI of 26; the 4H trend is weak, with an RSI of 41. If it breaks above 75.301 decisively, watch for further upside; if it falls below the 67.095 support, the short-term structure may weaken. Markets are volatile; for observation only.
post-image
HYPE+0.24%
is BTC Losing ita Status
live-cover
LIVE1,221
November 14: ETH shorts continue; short the rebound in line with the trend
【Today's Plan】
Entry: If the price rebounds to the 1925–1945 range
Stop loss: 1965,
Staggered take-profit levels:
First: 1895–1900
Second: 1875–1855
【Key Takeaway】
However, safe-haven funds are not currently flowing into the crypto market. ETH is still priced as a high-risk asset, and weaker risk appetite is increasingly unfavorable for it. In financial markets, tech stocks remain under pressure, with the Nasdaq leading losses, while risk appetite remains weak. On-chain and fund flows: BTC spot ETFs recorded net outflow
post-image
ETH-1.26%
  • 1
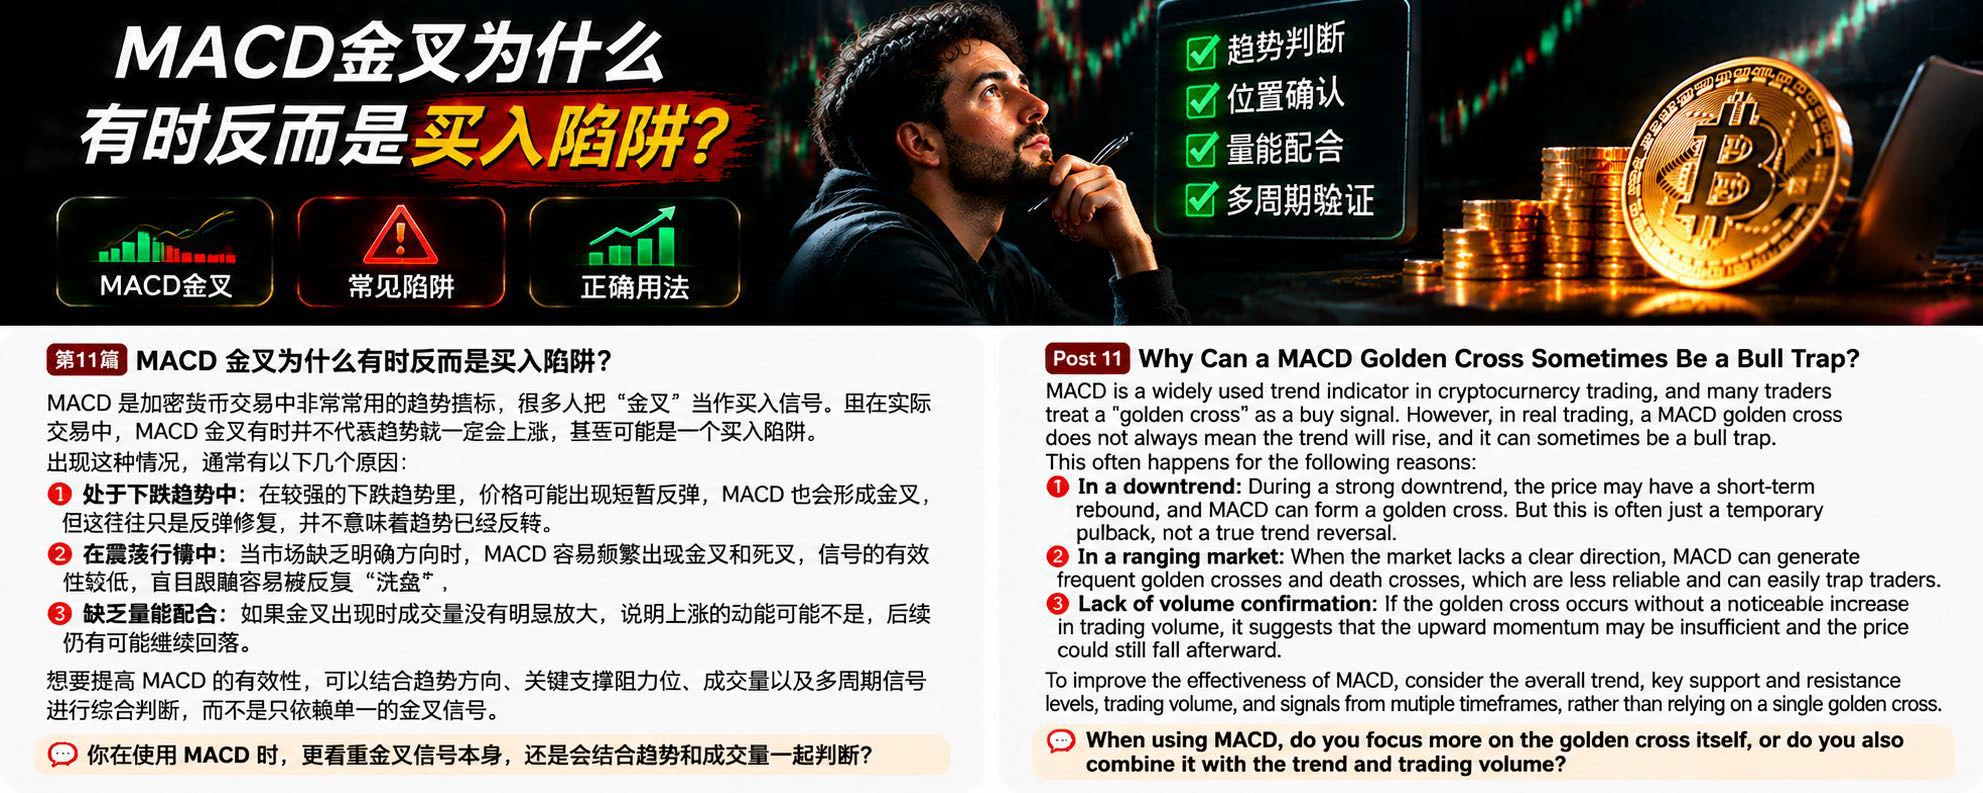
MACD is a commonly used trend indicator in cryptocurrency trading, and many people treat a golden cross as a buy signal. But in actual trading, an MACD golden cross does not always mean the trend will rise; it may even be a buy trap.

This usually happens for the following reasons:

First, the market is in a downtrend. In a strong downtrend, prices may see a brief rebound, and MACD may also form a golden cross, but this is often just a corrective bounce and does not mean the trend has reversed.

Second, the market is moving sideways. When the market lacks a clear direction, MACD can frequently
post-image
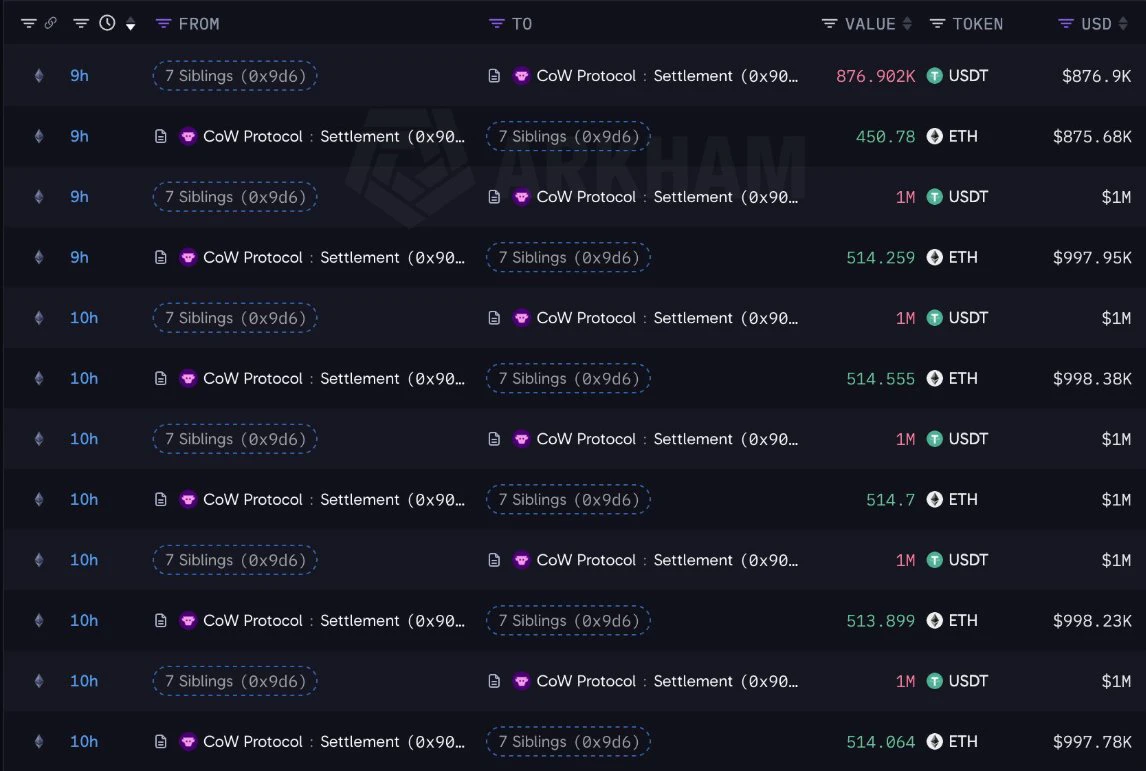
🐋 WHALE WATCH : THE 7 SIBLINGS ARE BUYING THE $ETH DIP AGAIN.
They just purchased another 9766 $ETH worth $18.88 MILLION at an average price of $1933.
And this happened just 9 hours ago.
While retail is panicking these big players are accumulating.
The real question is:
Are they positioning for the next major Ethereum move ?
Smart money is worth watching.
post-image
ETH-1.26%
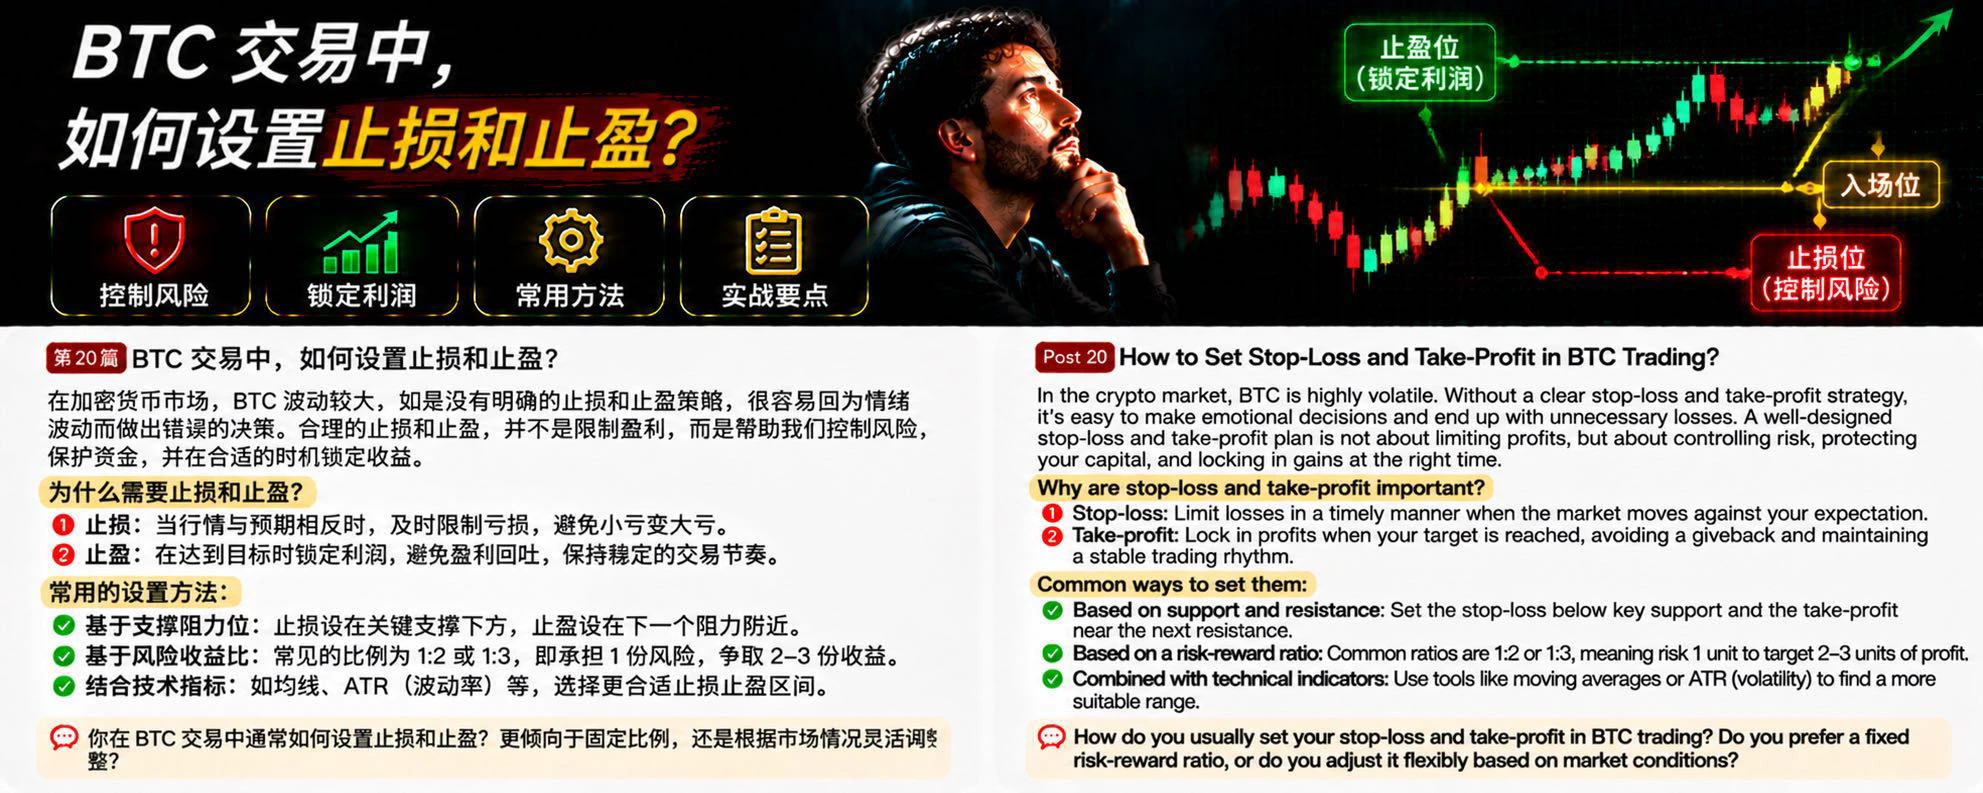
In cryptocurrency trading, many people spend a lot of time studying whether BTC will rise or fall, but overlook a more important question: even if your prediction is correct, without a sound stop-loss and take-profit plan, you may still end up making no money.

Why are stop-losses and take-profits so important?

First, stop-losses are about controlling risk. When the market moves against your view, exiting in time can prevent small losses from growing. This is especially important in futures trading, where leverage amplifies the impact of price fluctuations on your account, so it is crucial to
post-image
BTC-0.65%
🚀 AKE/USDT Explosive Rebound: Bullish Momentum or Short-Term Spike? Comprehensive Technical Breakdown! 📊🔥

The AKE/USDT trading pair has captured the entire market's attention with a phenomenal massive surge, displaying aggressive bullish action across multiple timeframes. Let’s dive deep into the numbers and technical indicators to see what’s fueling this rally and where the price could head next!

📈 Key Market Statistics
Current Price: $0.012589 USDT

24h Performance: Up by an impressive +251.94% (Spot) / +265.87% (Futures)

24h Range: High of $0.014200 vs. Low of $0.003560

AKE+6.39%
  • 1
This is also a form of cutthroat competition, except the business owners are the ones caught up in it. It does make consumers happy, but in the long run, it’s not a good approach.
post-image
$AKE Up 239% in 24 hours, with $1.3 billion in trading volume, but the Fear & Greed Index reads 88 on my end—extreme greed. The funding rate is +0.18%, and long positioning has surged to an extreme level, in the top 3% of readings over the past three months. Historical comparison: the last time the funding rate topped 0.15% was during January’s meme coin wave, followed by a pullback of over 40% within 48 hours. Technically, 0.0143 is both the 24-hour high and a dense overhead resistance zone where holders are underwater. On-chain data shows large holders have placed plenty of sell orders in th
AKE+6.39%
  • 1
  • 2
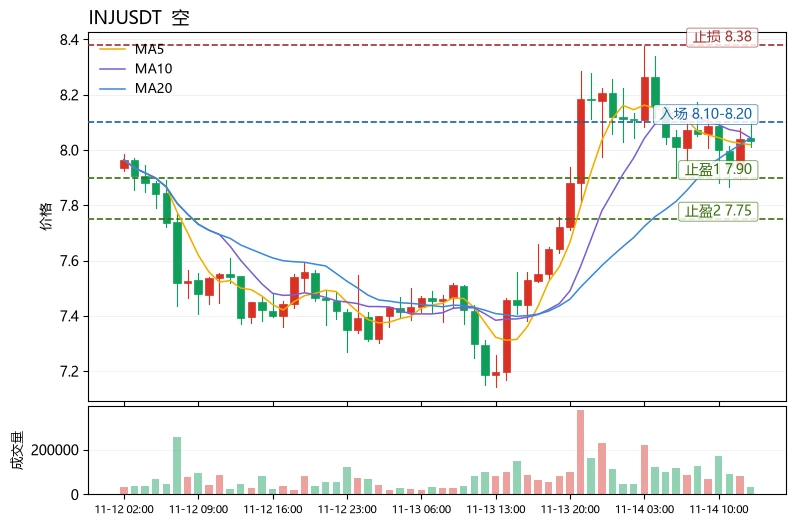
$INJ Current price 8.031, 24h +11.06%, trading volume 22.9M USDT, funding rate +0.0100%, Fear & Greed Index 13 (Extreme Fear). On the moving-average front, MA5=8.019 remains below MA20=8.043; the short-term average has just crossed above but not held, indicating a rebound recovery rather than a trend reversal. The MACD histogram at -0.02654 remains bearish, with momentum yet to turn positive. RSI 56.5 is neutral to bullish, leaving room to rise but not yet overbought. Bollinger Bands [7.74377, 8.34233]: price is trading just above the middle band, with the upper band at 8.34 as the first resi
post-image
INJ-1.67%
UNI+3.05%
HYPE+0.24%
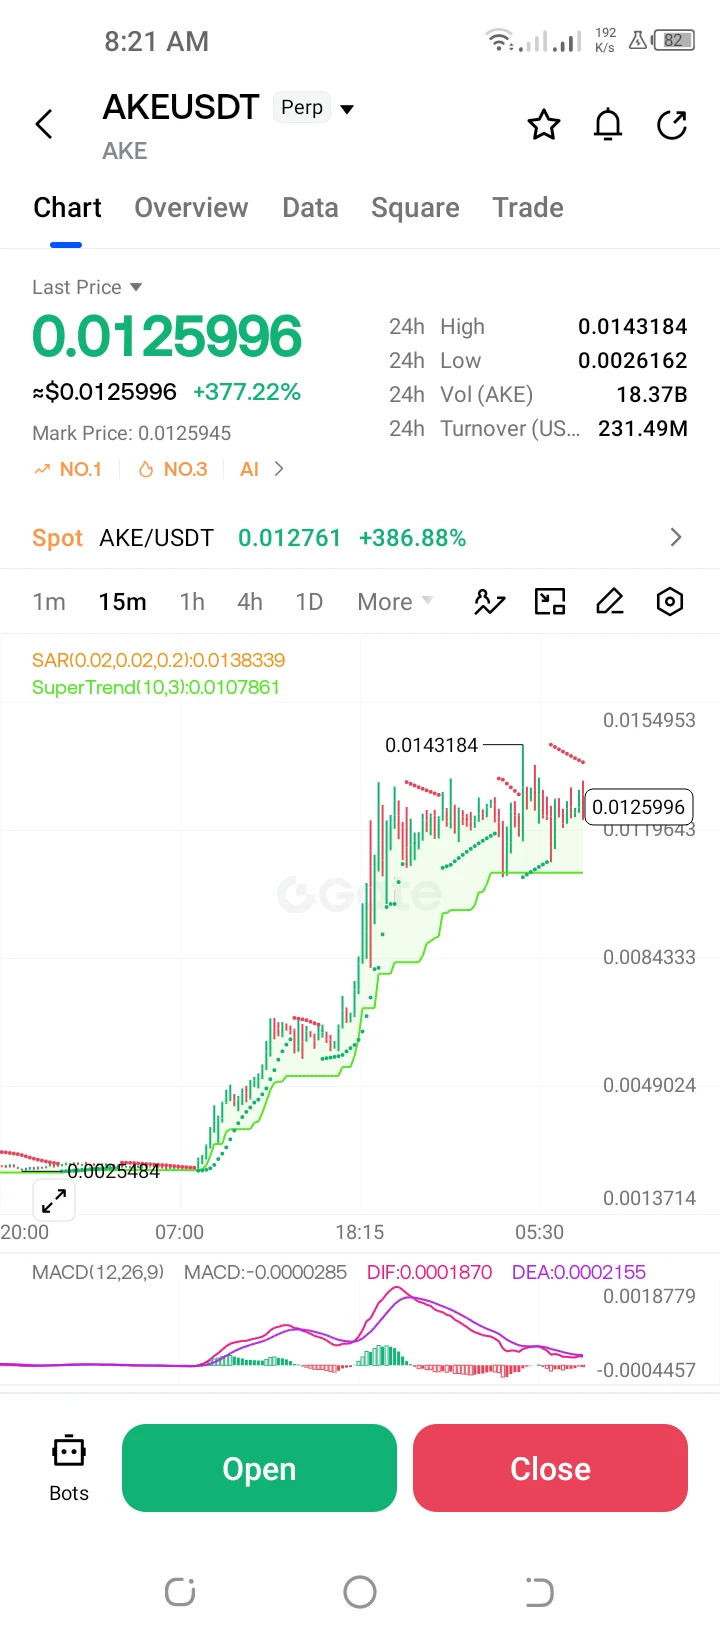
**$AKE /USDT Perp – "Hyper-Parabolic Extension – Long"**
Trading Plan Long $AKE
Entry: 0.0125996
SL: 0.0107861
TP1: 0.0143184
TP2: 0.0154953
AKE is up an astronomical +377.22%. MACD remains highly elevated. Targeting a retest of the 0.0143184 high. Use extreme caution and very tight risk management due to parabolic volatility.
#ShareWeekly.
post-image
AKE+6.39%
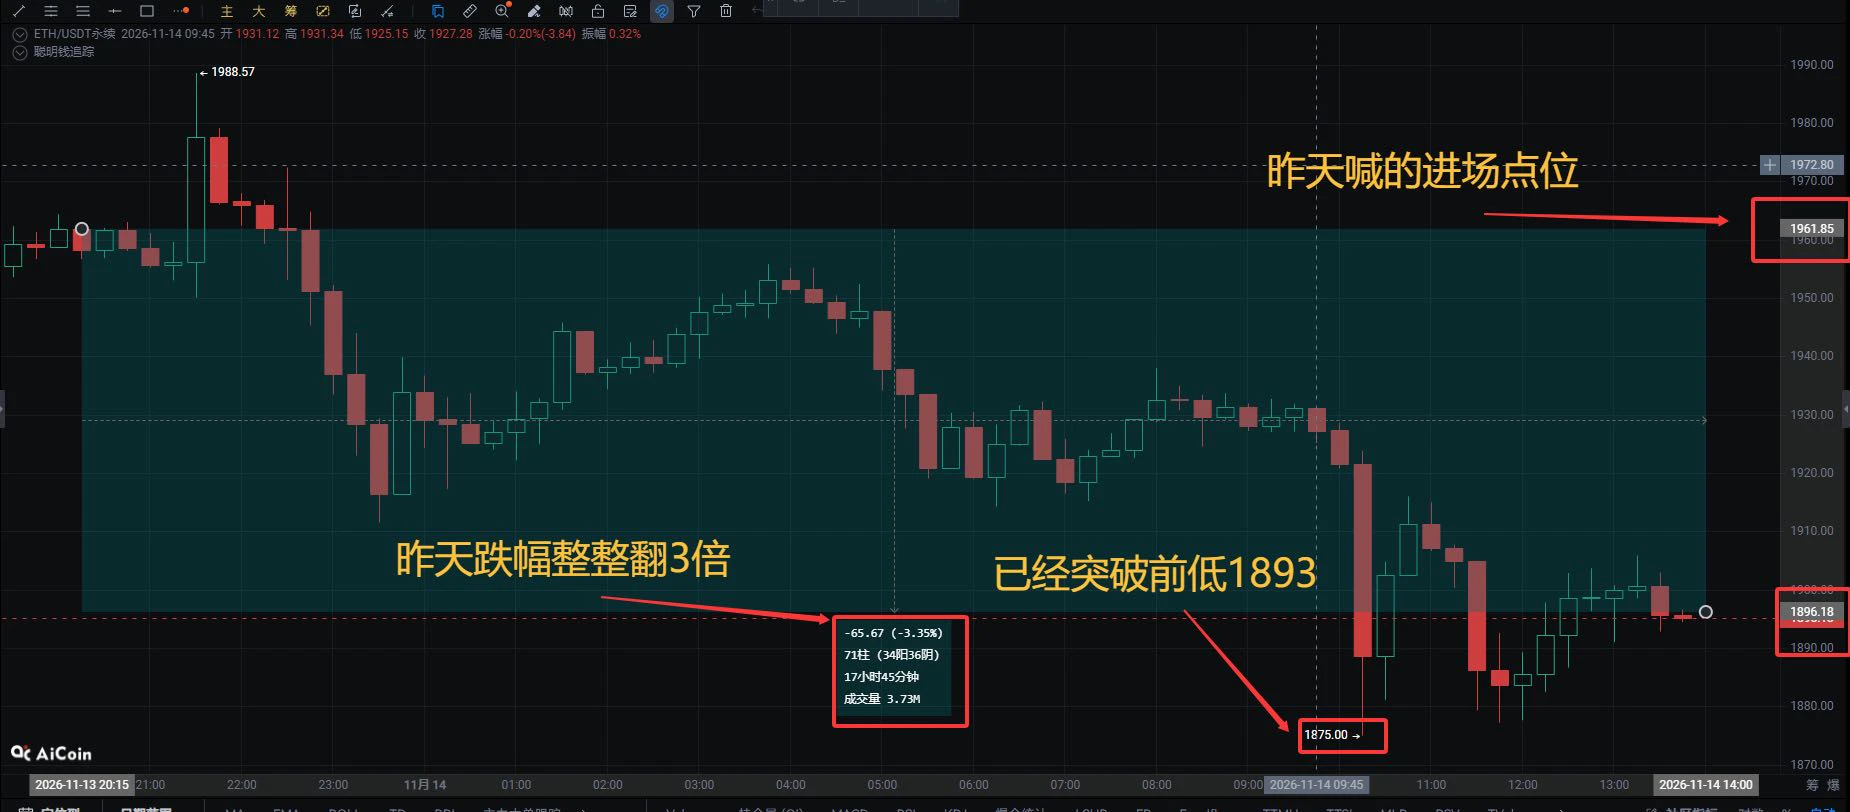
I shared $ETH ’s shorting strategy with everyone early yesterday morning. Did you follow Dui Dui’s strategy and take action?

Looking at the market today, although it initially rallied to a high of 1988, some people were asking whether Dui Dui had gotten the direction wrong. But 1988 didn’t hold for long before the price plunged to a low of 1875, generating more than 3x profit.

If you’re still hitting walls in crypto and every trade ends in a loss, why not follow Dui Dui? Stay tuned for first-hand news and signals! 💥
post-image
TradeSignalDiary
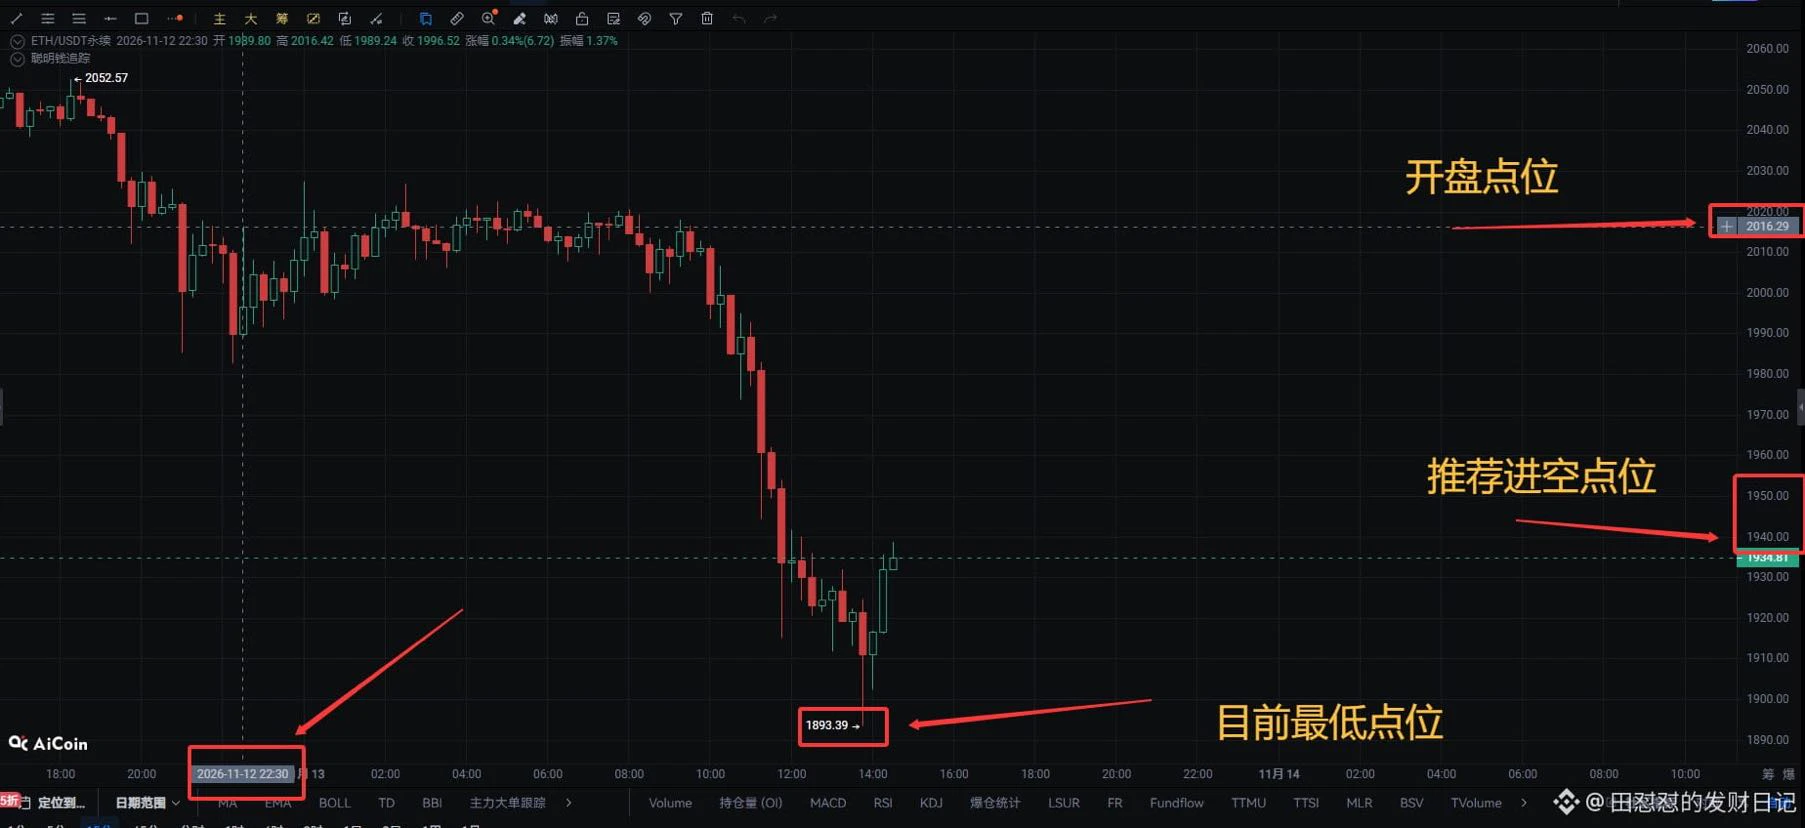
$ETH The rebound is merely a correction; the bear market isn’t over!
Yesterday, ETH plunged from around 2064, successively breaking key levels like 2000 and 1950, and hit a low of 1893. The bears launched a powerful move, breaking straight through the bulls’ defenses!
Although it has rebounded from the lows, this looks more like a technical correction after the sharp drop and does not mean the trend has reversed.
That’s right—I’m still bearish for now. The 1940–1950 range is a key short-term resistance zone. If the rebound fails to break through it decisively, ETH could still retest the previous low of 1893.
#BTC跌4%
repost-content-media
ETH-1.23%
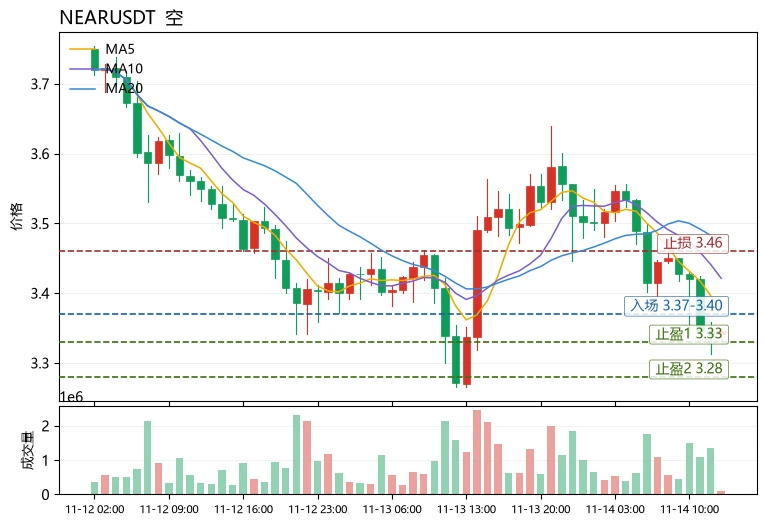
$NEAR Current price: 3.347, up just 1.86% in 24h but still below MA5=3.376 and MA20=3.47555. RSI=35.8 and the MACD histogram at -0.01868 remain bearish. The 30-candle range is 11.18%, while the Fear and Greed Index is only 13—extreme fear combined with a positive funding rate of +0.0100% shows that bulls are still paying to hold positions in a weak market. This is a typical weak-rebound structure, not a reversal. View: bearish bias; use rebounds as opportunities to reduce positions.
Entry reference: 3.37–3.40 (near MA5 resistance and below the Bollinger middle band). Take profit 1: 3.33 (near
post-image
INTCB
INTCBINTEL
Four.meme
MC:$3.22KHolders:4
0.16%
NEAR+1.17%
ZRO-2.59%
The Fed Hasn’t Acted Yet, but Bitcoin Is Already Panicking! The Dollar Is Strengthening—Can $68k Hold?

This time, Bitcoin’s biggest opponent may not be the bears, but expectations for the Fed’s monetary policy.
The dollar is strengthening, Treasury yields are rising, and concerns about future rate hikes are heating up again. For a risk asset like Bitcoin that generates no interest income, investors will naturally recalculate the cost of holding it. After all, as dollar-denominated assets become more attractive, investors may be less willing to keep paying up for high-volatility assets.
Meanwh
BTC-0.65%
  • 12
Load More

Join 40 M users in our growing community

⚡️ Join 40 M users in the crypto craze discussion

💬 Engage with your favorite top creators

👍 See what interests you

Trending Topics

GateIPOAccessAnthropic

303.4K Views2.8K Discussing

Gate IPO Access Phase 3 features Anthropic (ANT), with USDT subscription interest starting from 100 USDT. Successful allocations will be delivered as real shares to Gate Stock Accounts. Indicative price: $70–$78/share Subscription: Nov 12–17 (UTC+8) Allocation is not guaranteed. Please manage risk accordingly.

Dr.HanOxfordUnionSpeech

147K Views580 Discussing

USOctoberPPIBelowExpectations

460.5K Views1.4K Discussing

View More