
Square
Following
Hot
News
Profile
Share your thoughts
placeholder
Article
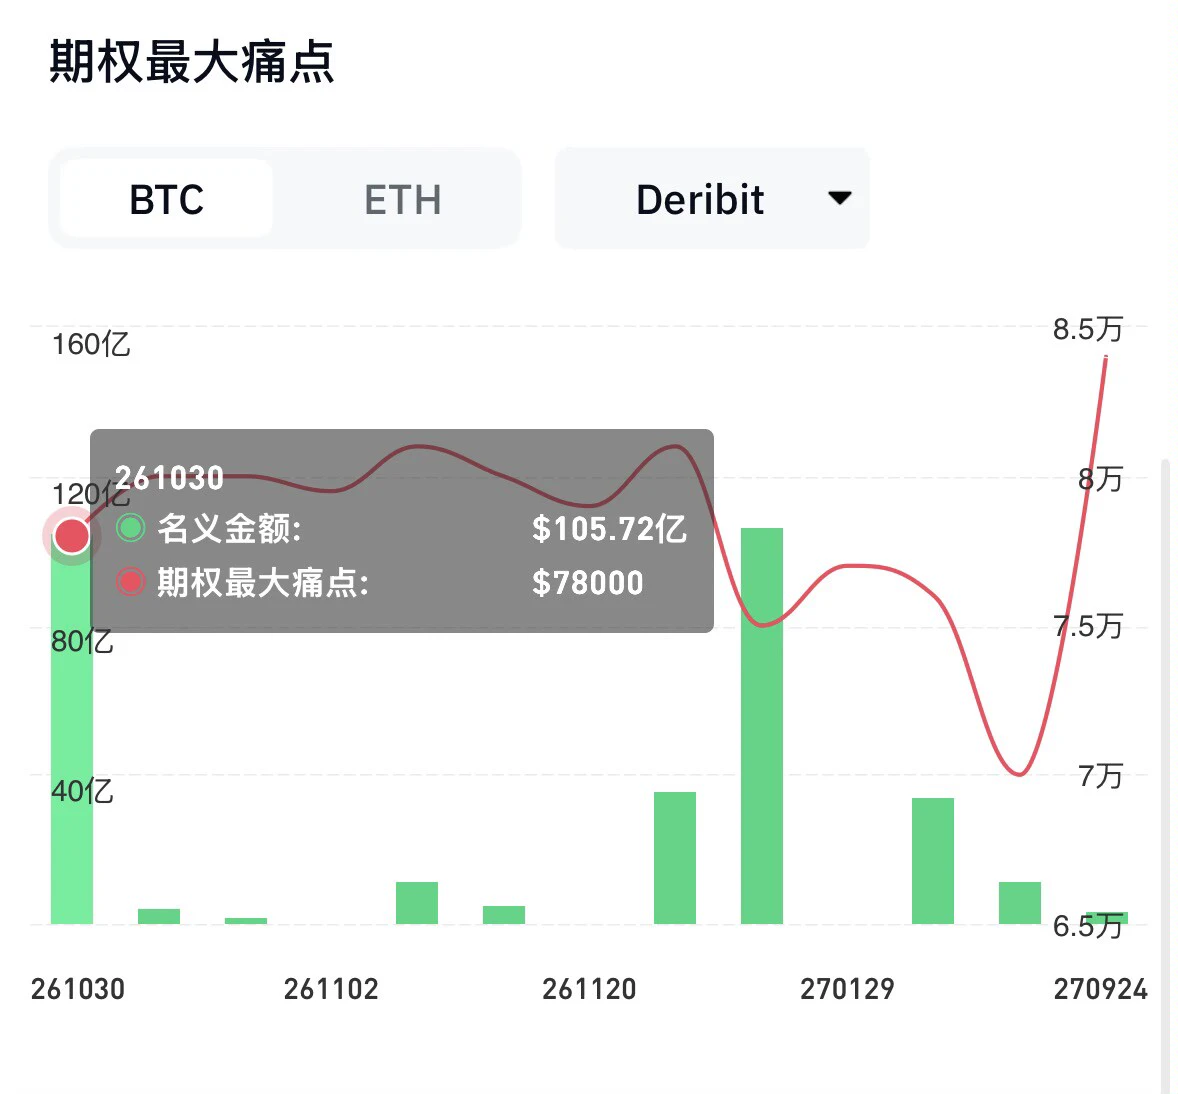
Does nobody really suspect anything? It just so happens that on October 30, $10.5 billion in Bitcoin options expire quarterly, with max pain around 78,000, while yesterday it was still 82,000. Was the theft really just a coincidence?$BTC ‌
post-image
BTC-0.65%
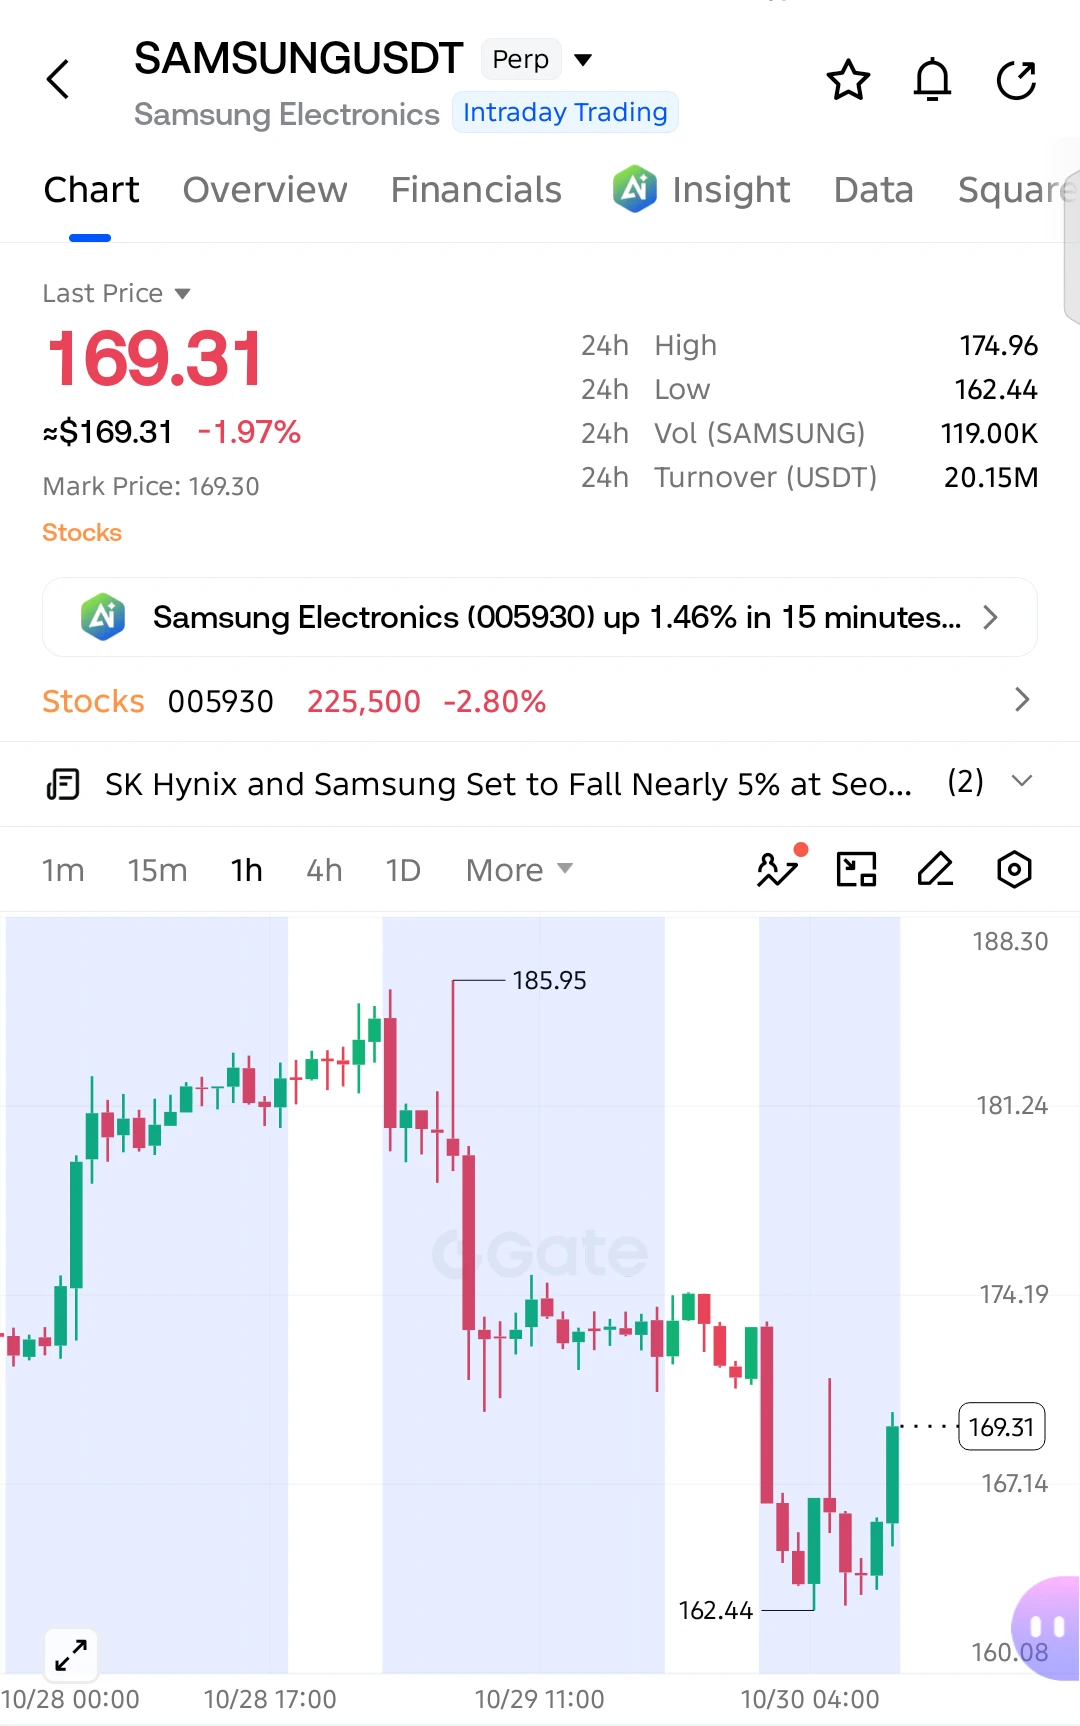
$SAMSUNG LONG SETUP — BUYERS ARE MAKING A COMEBACK!
$SAMSUNG is showing a strong recovery from the 162.44 support after a sharp sell-off. Buyers have pushed the price back toward 169.31, and the next important test is the resistance around 172–174.
Long Entry: 169.31
SL: 165.80
TP1: 172.00
TP2: 174.20
TP3: 178.00
Final Target: 181.20
The latest 1H candles suggest improving buying momentum, but the broader trend remains under pressure. If buyers reclaim 174.20, the recovery could extend toward 181.20. A drop below 165.80 would invalidate this long setup.
Can bulls turn this rebound into a real
post-image
SAMSUNG-0.12%
  • 3
Trenches
BNCB
B
bade
b
BNCB
0x49...ec3f
Market Cap
$.
Change
.
24h Vol
$.
Holders
.
ENA
E
bade
b
ENA
0x57...6061
Market Cap
$.
Change
.
24h Vol
$.
Holders
.
PEPE
P
bade
b
PEPE
0x69...1933
Market Cap
$.
Change
.
24h Vol
$.
Holders
.
GTA6
G
bade
b
GTA6
4kjr...zDnz
Market Cap
$.
Change
.
24h Vol
$.
Holders
.
XDP
X
bade
b
XDP
0x07...91d0
Market Cap
$.
Change
.
24h Vol
$.
Holders
.
🔥 What are we talking about today? Gate Square trending topics have been updated!
🔹 #BTC falls to $77,000
With $80,000 breached, is this a deep correction, or has the trend started to weaken?
🔹 #Intel earnings beat expectations, but shares plunged
Despite solid earnings, the stock plunged about 23% at one point. Is the market worried about guidance, cash flow, or AI competitiveness?
🔹 #HYPE rallies against the market
While the broader market declines, $HYPE is bucking the trend. Is this rally driven by fundamentals, or new expectations for “compliant perpetuals”?
Quality content can recei
post-image
BTC-0.67%
INTC-3.60%
HYPE+0.33%
  • 6
  • 4
A little less impatience, a little more patience, and the sweetness will come in time🌿$BTC ‌
post-image
BTC-0.65%
BTC falls below $75k, hitting a six-week low, while ETH drops to a two-month low. How long will the
live-cover
LIVE1,920
🚀 SUI/USDT Multi-Timeframe Breakdown: Navigating the $0.89 Pivot & Accumulation Zones
As one of the prominent Layer 1 ecosystems tracked actively on Gate.io, SUI has experienced a notable macro correction following its earlier push toward the $1.29–$1.30 resistance region. Currently consolidating around $0.8950, let's dive into a multi-timeframe technical breakdown to map out the next potential market moves.
📊 Market & Volume Overview
Current Price: ~$0.8950 – $0.8990 (-1.9% to -2.1% 24h)
24h Range: $0.8263 (Low) — $0.9614 (High)
24h Turnover: ~30.79M USDT (Healthy liquidity reflecting activ
SUI-1.01%
  • 4
  • 2
Willy Woo's new simulation shows Bitcoin possibly hitting $413,000 by 2028
Willy Woo’s model puts BTC in the hundreds of thousands of dollars
On-chain analyst Willy Woo has shared a simulation of Bitcoin’s price trajectory over the coming years, built on 10,000 different scenarios.
⚠️ Personal market analysis only. NFA — manage risk and DYOR.
Educational content, not investment advice or a recommendation to buy, sell, deposit, or withdraw any asset. No paid promotion or referral/affiliate links.
post-image
BTC-0.67%
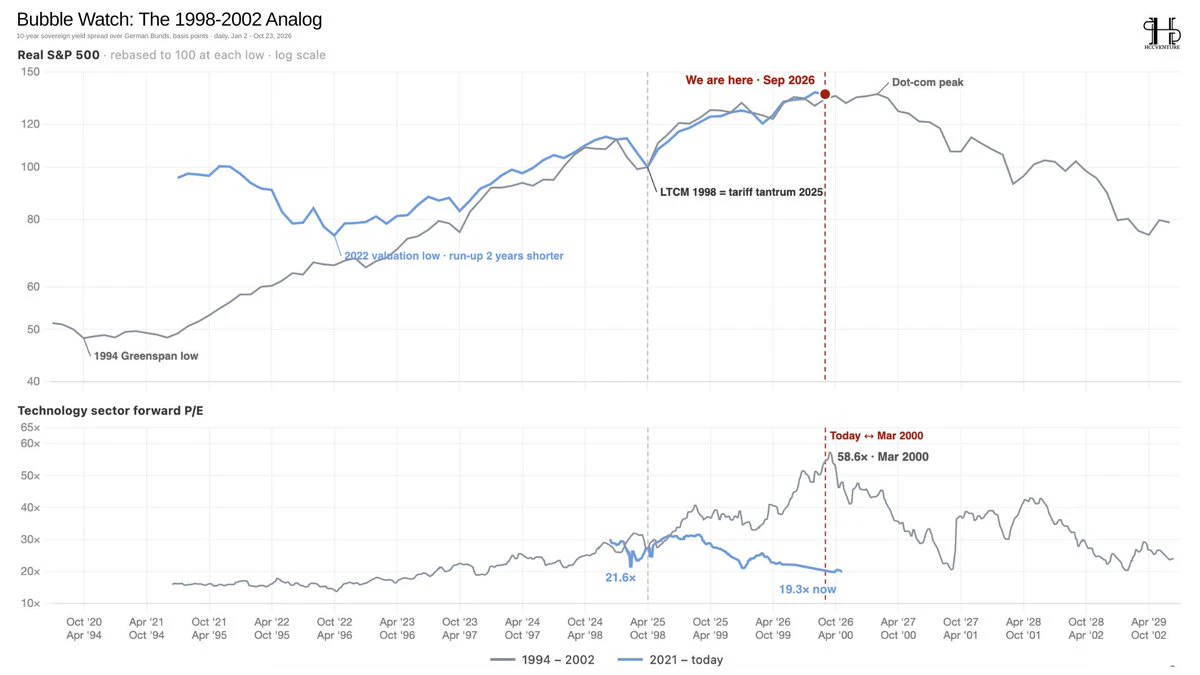
The market is approaching valuation levels reminiscent of the Dot-com bubble.
Comparing the 2021–2026 US stock market cycle to the 1994–2002 cycle reveals a striking similarity: the S&P 500 has recovered strongly from its 2022 valuation lows and is approaching the peak of the Dot-com cycle, while technology sector valuations have not yet reached the extreme levels of March 2000.
According to the data on the chart, the forward P/E ratio for the technology sector is currently around 19.3 times, significantly lower than the 58.6 times at the Dot-com peak.
However, the fact that the stock index is
post-image
US500-0.31%
I'm going to bed... I'm dead tired. I haven't slept since yesterday afternoon...
post-image
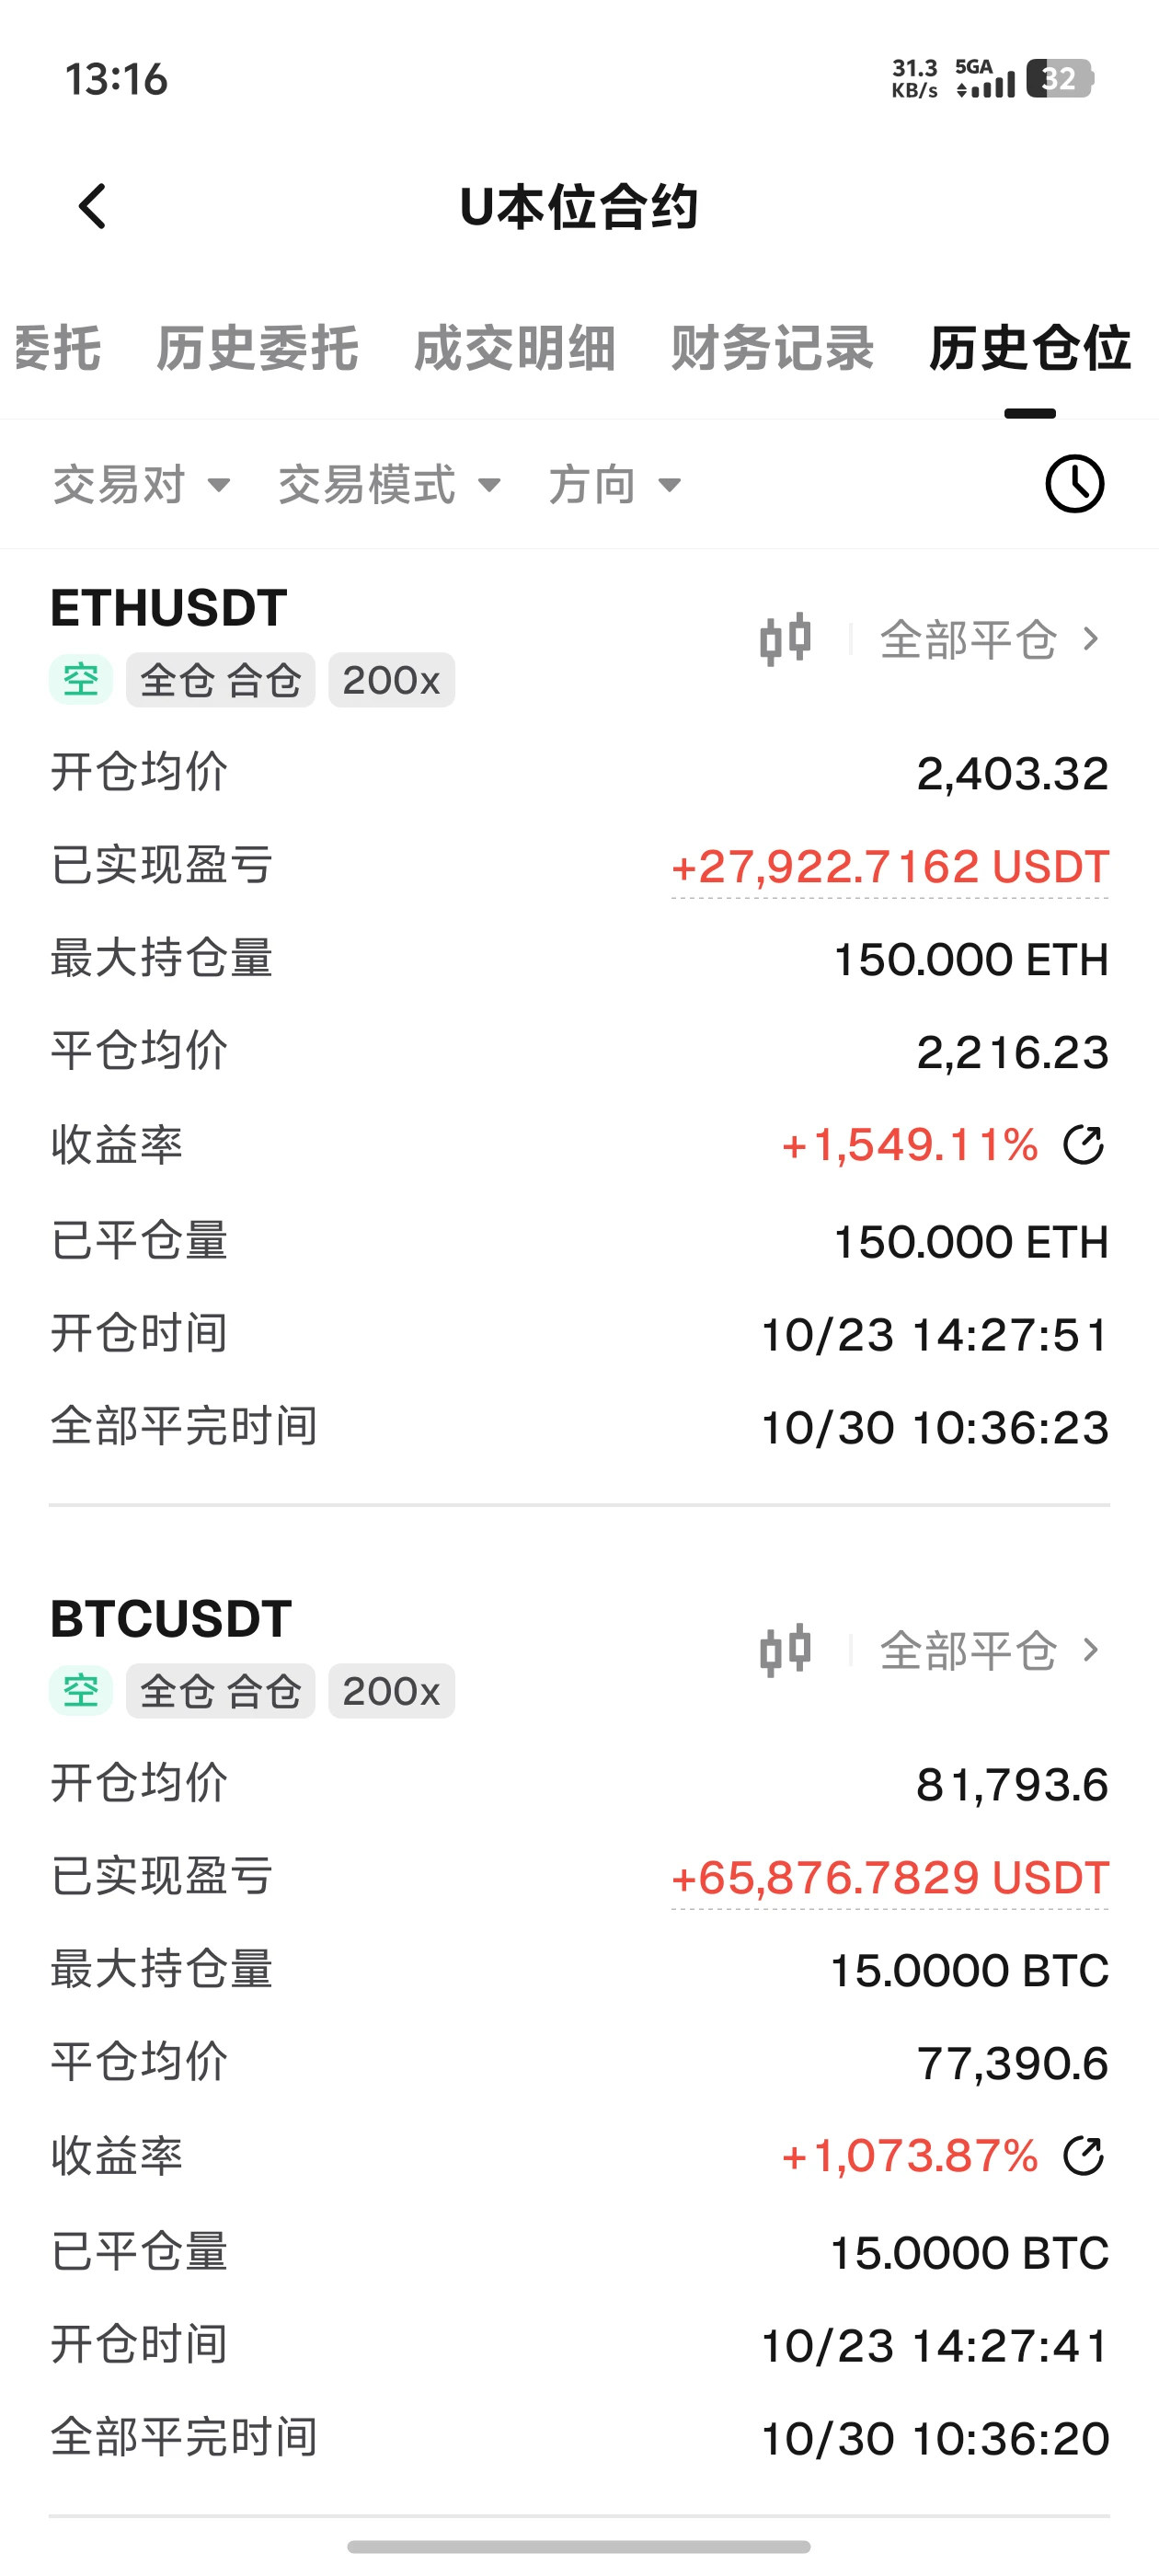
This big DeFi scammer has paid for all the sins they committed in DeFi through contract trading.
Karma is real.
post-image
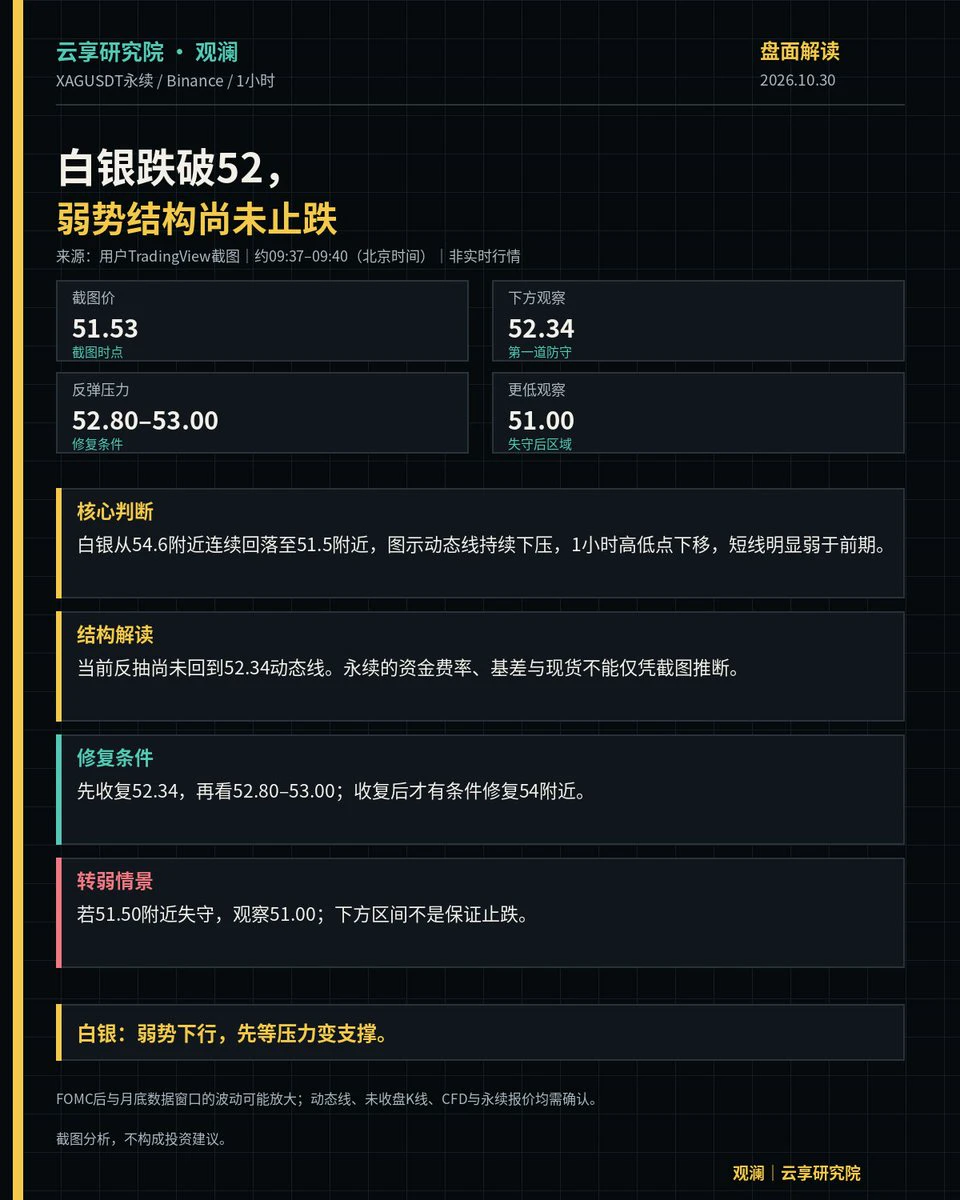
10/30 | Silver is around 51.53. It has pulled back steadily from around 54.6 to around 51.5, with the chart’s dynamic line continuing to slope downward and 1-hour highs and lows moving lower. The short-term trend is clearly weaker than before.
Resistance is at 52.80–53.00. First watch 52.34 below; if that level breaks, watch 51.00. First reclaim 52.34, then look to 52.80–53.00. Only after reclaiming that range will a recovery toward around 54 be possible.
Guanlan | Screenshot analysis, not investment advice.
#Silver
post-image
XAG+0.47%
157 | On-chain price anomaly—will contracts jump along with it?
When I see an abnormal price suddenly appear in an on-chain pool, I don't immediately equate that with every market moving to that price.
A more useful question for making trading decisions is: where exactly does the product I'm watching get its price from?
On-chain lending or derivatives protocols may obtain reference prices through oracles. Different protocols use different data sources, update conditions, and anomaly-handling methods, so a quote change in a small pool doesn't necessarily pass directly to another system.
But if
post-image
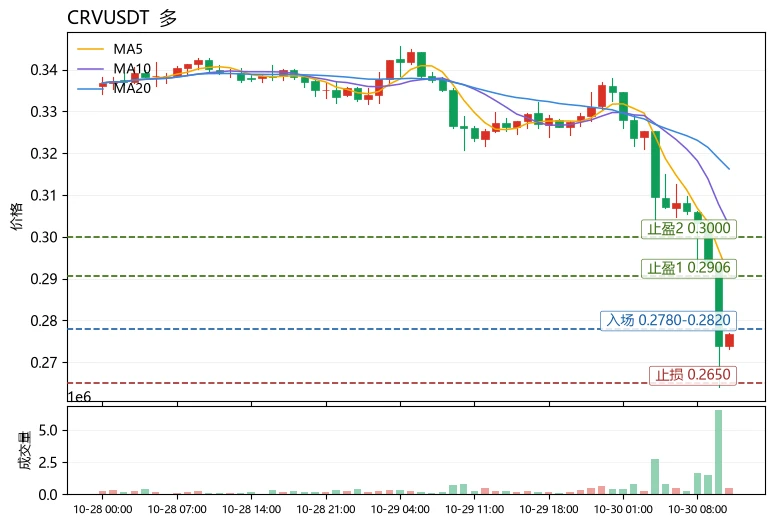
$CRV $CRV is currently at 0.2765. The Bollinger lower band at 0.2804 overhead has become resistance, while 0.2650 is the last line of defense in the short term. It is down 14.71% over 24h, and an RSI of just 18.2 indicates oversold conditions, but MA5 at 0.2906 remains below MA20 at 0.3162, and the MACD histogram at -0.00483 still shows a bearish structure. The 28.95% range across 30 candlesticks indicates volatility is elevated, so buying the dip now means betting on a rebound with the worst risk/reward ratio. The +0.0079% funding rate shows longs are still paying to hold positions, while fear
post-image
CRV-2.21%
RUNE-0.11%
At this point, should you buy the dip or stay away? The answer: stay away for now; wait for confirmation before considering an entry.
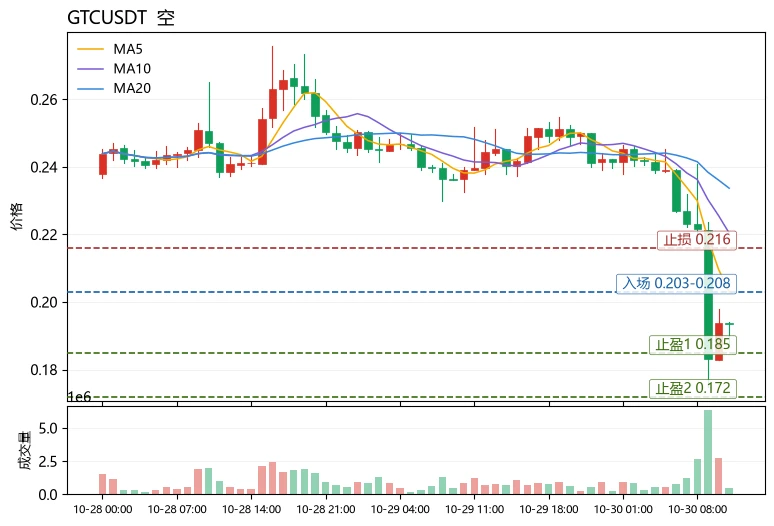
$GTC Down 21.37% in 24 hours, with a range of about 41.37% across 30 candlesticks—this is not a normal pullback; volatility is out of control. MA5=0.2030 has fallen below MA20=0.2337, and the MACD histogram remains bearish at -0.00575. RSI=25.2 is in oversold territory, but in a trending market, oversold conditions can persist for a long time and are not a reason to buy. The current price of 0.19362 is hugging the lower Bollinger Band at 0.193294, indicating tha
post-image
GTC
GTC芝麻币
Gate.Fun
MC:$0.1Holders:1
0%
WLFI-0.16%
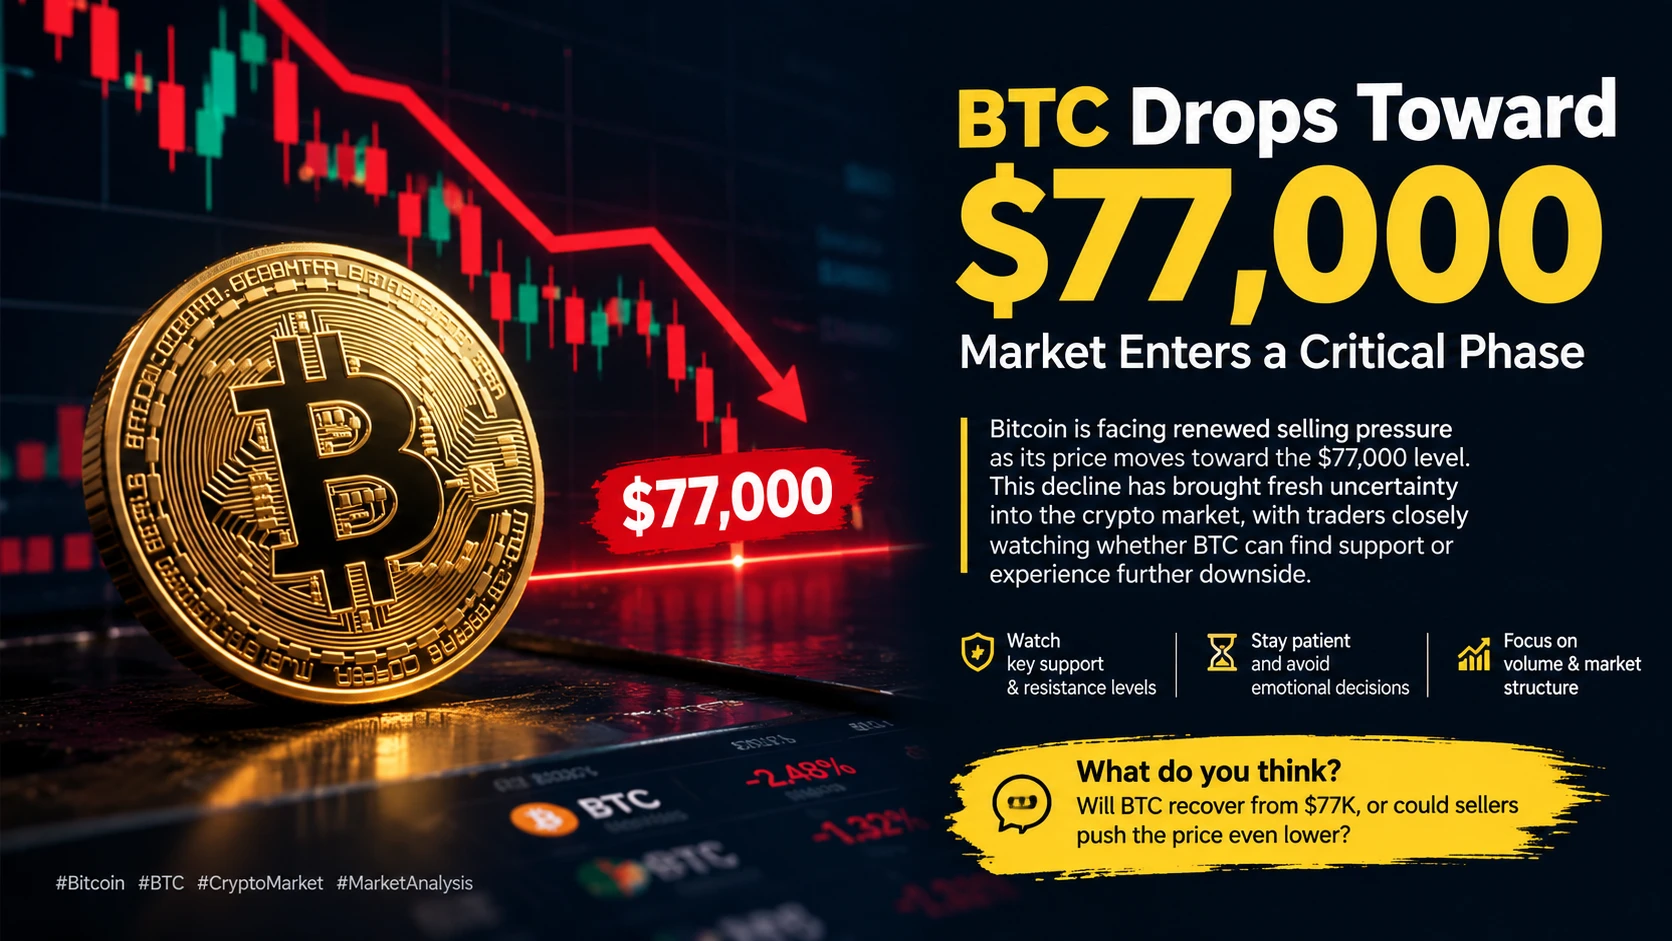
#BTCDropsToward77000 BTC Drops Toward $77,000: Market Enters a Critical Phase
Bitcoin is facing renewed selling pressure as its price moves toward the $77,000 level. This decline has brought fresh uncertainty into the crypto market, with traders closely watching whether BTC can find support or experience further downside.
Market corrections are a normal part of crypto trading, but they also remind us why risk management and patience matter. The coming price action around $77K could provide important clues about Bitcoin's next direction.
For now, traders should avoid emotional decisions and foc
post-image
BTC-0.67%
  • 4
The best thing you can do when the market is like this is touch grass.
Hope everyone is okay. 🙏
post-image
Reddit CEO Huffman announced that the platform is gradually shifting to a login-first browsing mode, changing its longstanding rule that visitors can browse freely (except on the old interface and age-restricted content); one reason is to stop AI crawlers.
The way to stop AI crawlers is to lock the gate, but the cost is making visitors who could previously view posts without logging in register first. Preventing crawling is the goal, user friction is the cost, and the news has already said users are generally unhappy.
$BTC
#量化达人# Let’s talk about quantitative trading and market trends. What do
RDDT-3.57%
BTC-0.67%
159 | Public chains are heating up—can all ecosystem tokens benefit?
When looking at a hot public chain sector, I want to use less of one sweeping statement: “This chain is booming, so all the tokens in its ecosystem will rise.”
On-chain activity is certainly worth watching, but when it comes to a specific token, we need to fill in the links in the chain of cause and effect.
Which apps are seeing increased activity? Are the projects I follow actually being used? Does using the app require its token? Is any increase in revenue or demand reaching the token layer?
Being in the same ecosystem does
post-image
I bought several coins—is that diversification?
Suppose I hold a few spot assets and have also opened several futures positions. My portfolio list looks pretty diverse. But I’d ask one more question: are they all really betting on the same thing?
For example, they might all belong to the same ecosystem, depend on the same wave of hype, or be based on the same reason for entering the trade: “the broader market is about to rise.” Different names can react very similarly to the same bad news.
So when I review my positions, I don’t just sort them by coin. I also note what each position is most vul
post-image
Load More

Join 40 M users in our growing community

⚡️ Join 40 M users in the crypto craze discussion

💬 Engage with your favorite top creators

👍 See what interests you

Trending Topics

BTCDropsToward77000

34.24k Views39.1k Discussing

$BTC briefly fell below $77,000 and remains under pressure around the $77K zone, with its 24-hour decline still above 4%. With risk appetite weakening and Fed uncertainty rising, where is the next key support after losing $80K?

IntelBeatsEarningsButStockPlunges

1.06k Views547 Discussing

StrategySTRCNears100ParValue

1.82k Views3.96k Discussing

View More