Square
Following
Hot
News
Profile
Share your thoughts
placeholder
Article
Why is everyone suddenly quiet about SYMBOL right before a massive move?

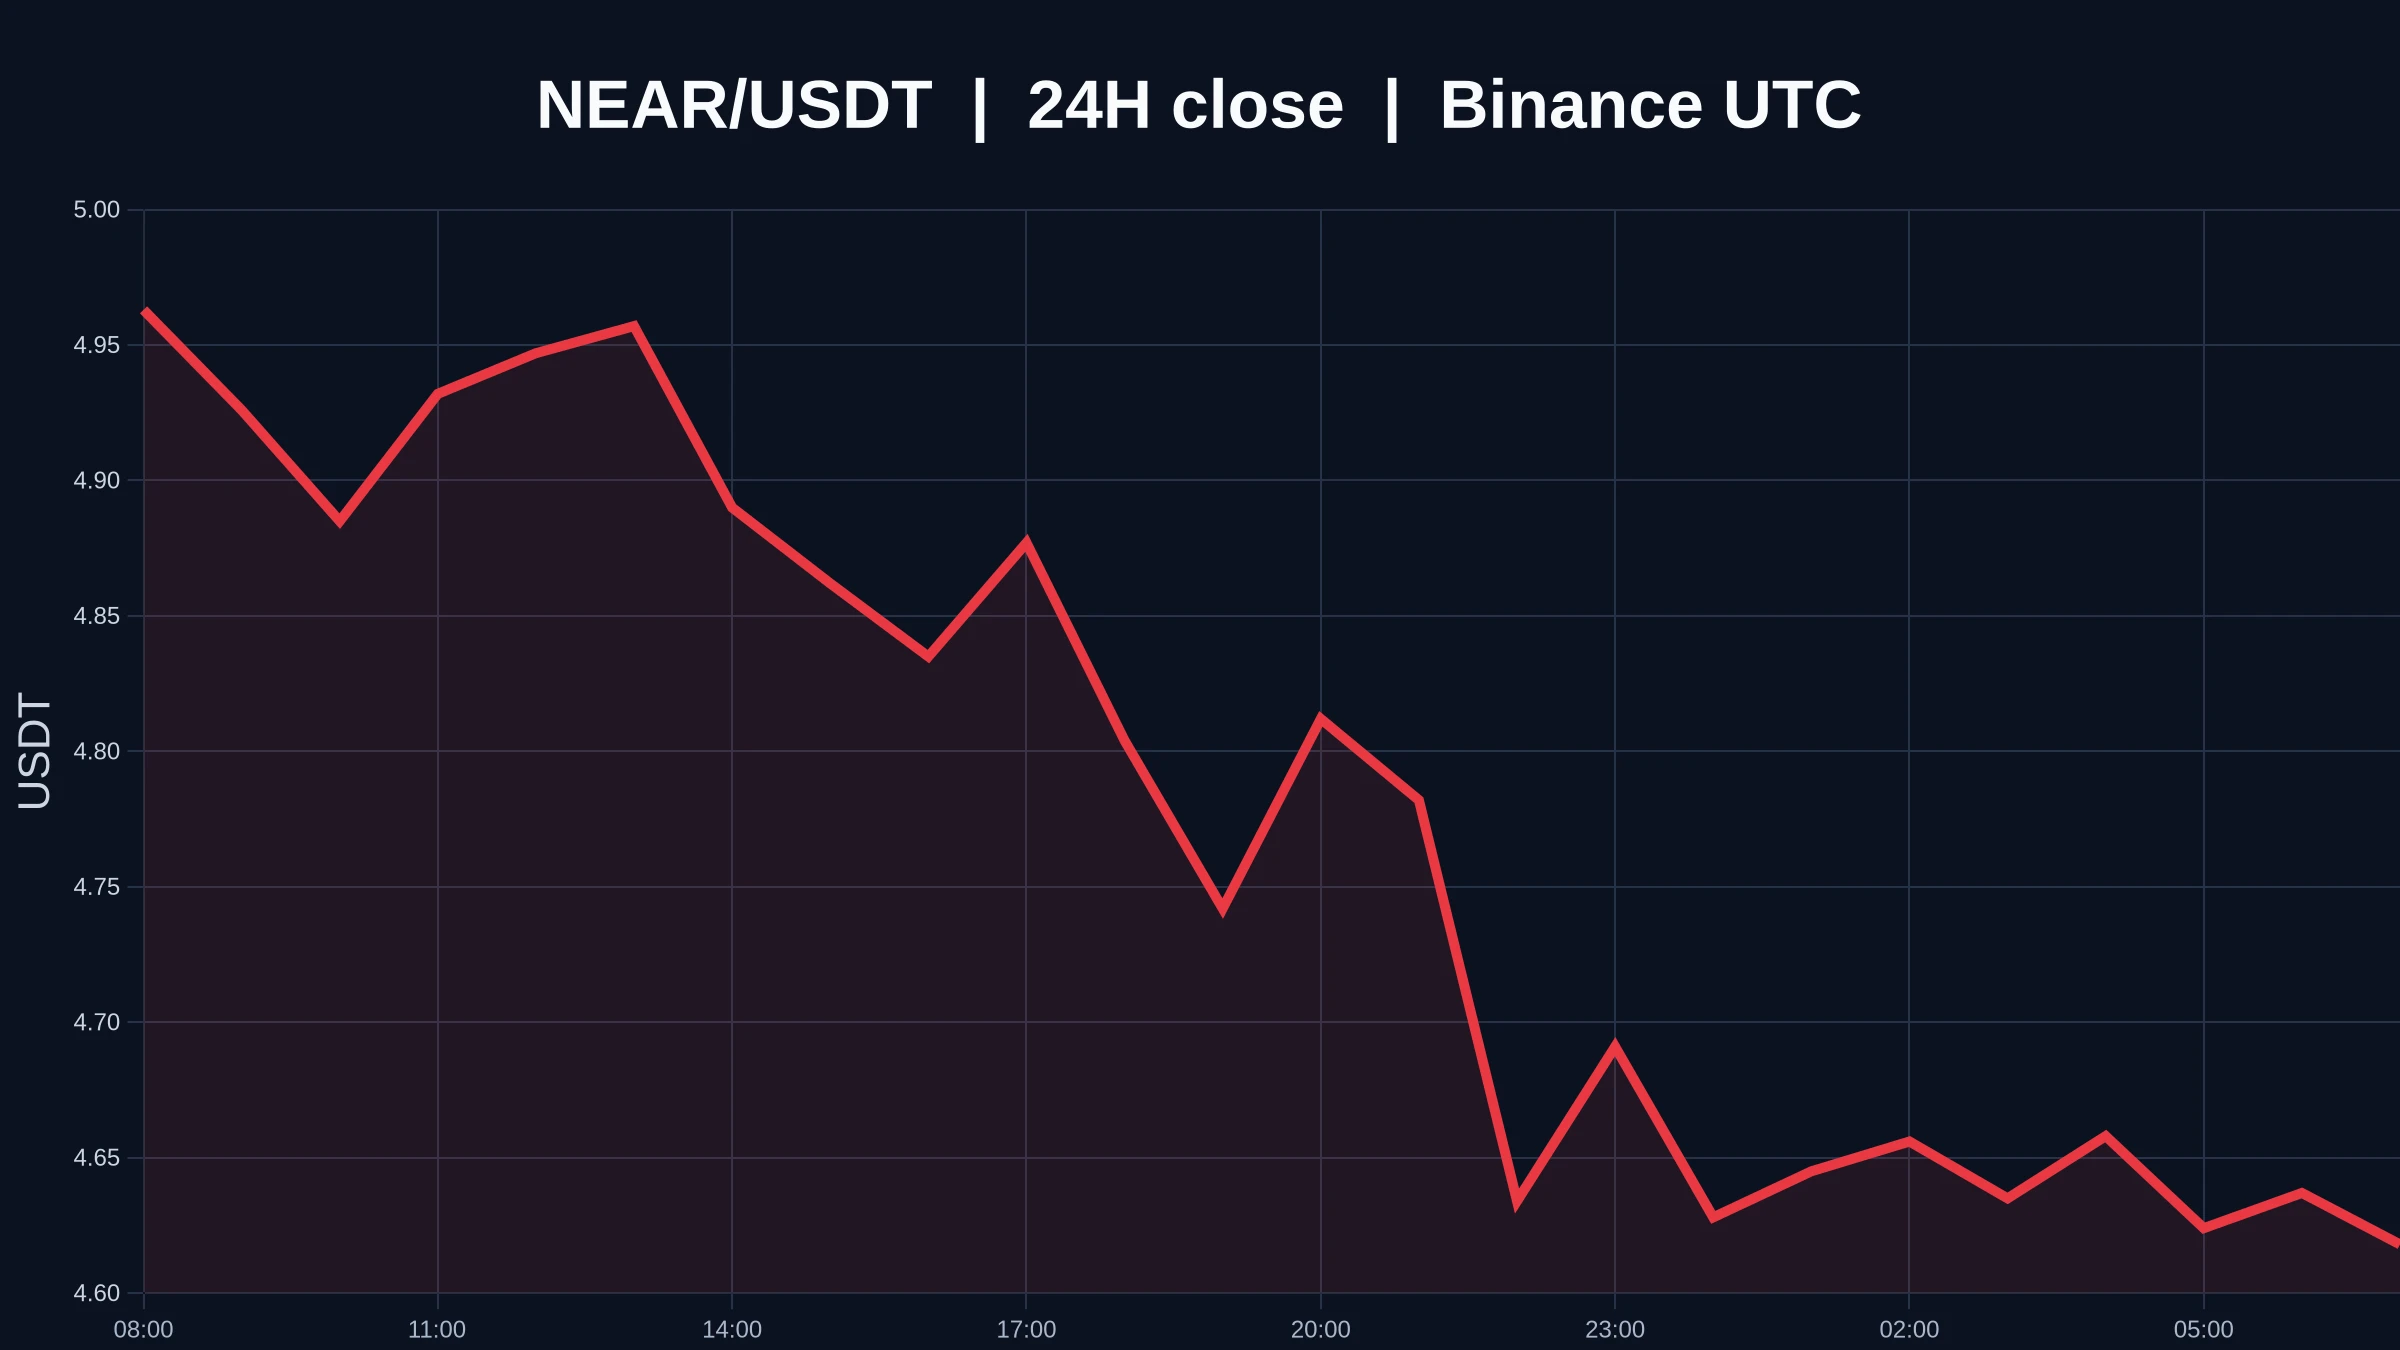
$NEAR /USDT - LONG

Trade Plan:
Entry: 4.9240 – 4.9764
SL: 4.6988
TP1: 5.1388
TP2: 5.2645
TP3: 5.4531

Why this setup?
Why now? The daily trend is bullish and the 4h setup is locked, while the 1h price sits at 4.9509 just above the entry zone low of 4.9240. The 15m RSI at 39.03 signals room for upward momentum without being overextended, and the 1h ATR of 0.104762 shows enough volatility to reach TP1 at 5.1388 and TP2 at 5.2645. The entry reference of 4.9502 aligns with the current price action, keeping risk tight. Th
NEAR-2.76%
  • 1
JUST IN: 🇺🇸 Bank of America $BAC crashes 8.3% after being fined $1.2 billion for violating money laundering and sanctions laws.
This is its biggest drop since April 2025.
post-image
BAC-8.13%
solana:EEpng77ZPn9FT4xsRjwuxNCcMBYq3HTwEscyTpump crazy oversold
Crazy falling wedge will pump big 5x back to $2 million
EEpng77ZPn9FT4xsRjwuxNCcMBYq3HTwEscyTpump
#crypto $sol
post-image
SOL-2.33%
BITCOIN'S 4-YEAR CYCLE IS FLASHING A WARNING MOST PEOPLE ARE IGNORING
2013 was the SELL year.
2017 was the SELL year.
2021 was the SELL year.
2025 was the SELL year.
And if history repeats, 2026 could be setting up one of the BIGGEST buying opportunities before the next bull market.
Look at the pattern:
**2011 → BUY | 2012 → HOLD | 2013 → SELL | 2014 → BEAR**
**2015 → BUY | 2016 → HOLD | 2017 → SELL | 2018 → BEAR**
**2019 → BUY | 2020 → HOLD | 2021 → SELL | 2022 → BEAR**
**2023 → BUY | 2024 → HOLD | 2025 → SELL | 2026 → BEAR**
WE ARE HERE.
And if the cycle continues:
2027 → BUY
2028 → HOLD
BTC-1.50%
  • 1
CPI, can you let me eat noodles and keep me from getting carried away, so I won’t want to eat meat to comfort myself
post-image
🚨 OLD BITCOIN IS MOVING AGAIN. 👀
CryptoQuant data shows increased movement of long-held $BTC since late September.
When long-term holders start moving coins, the market pays attention.
Is this profit-taking or just wallet transfers?
Worth watching closely. $BTC ‌
post-image
BTC-1.49%
CPI data - tonight. BTC / ETH Market Updates
live-cover
LIVE2,997
  • 1
#晒出我的持仓收益 It's really unplayable now—whatever I buy keeps falling. There's absolutely no way out
post-image
Huitong News, October 14 — On Wednesday (October 14) at 20:30 Beijing time, the U.S. Department of Labor released the September Consumer Price Index. According to the data, the indicator rose 3.7% year on year, higher than August’s 3.4% and slightly above the market-wide forecast of 3.6%. The result was immediately reflected in the global asset pricing system.
On Wednesday (October 14) at 20:30 Beijing time, the U.S. Department of Labor released the September Consumer Price Index. According to the data, the indicator rose 3.7% year on year, higher than August’s 3.4% and slightly above the mark
Two wicks wiped out both longs and shorts; those who chased longs at 4110 are in for a treat.
$XAUUSD
post-image
XAUUSD-1.61%
  • 4
Tonight’s data was a complete success; going long on gold around 4090, with a stop-loss at 4175
post-image
GLDX-2.31%
PAXG-1.64%
Okay but who's the queen of news trading? 👑
CPI and Gold? Oh, I LOVE this combo $XAUUSD!!
Idk about u guys but news trading is literally my favorite thing 😭
post-image
  • 3
#Breaking:
The market now expects the Fed to raise interest rates this month.
Just one economic report flipped the entire outlook.
post-image
From 15.082 to 13.572—it happened within six hours.
The $KORU spike in the morning gave it all back by the afternoon.
That 13.122 hole at noon yesterday was pulled back to 15.082 this morning.
Then each candle was lower than the last, with the 24h low landing at 13.572.
Now at 14.238, the 20-day moving average at 14.4155 is pressing down from above, out of reach.
The volume has changed too: 460,000 lots at 14:00, down to just 38,000 at 18:00.
It is inching upward on declining volume, but cannot lift anyone.
The 24h figure is still +2.31% on paper, while the 16.66 peak from the day before yest
post-image
KORU-4.54%
  • 1
BREAKING: 🇺🇸 US September CPI rises to 3.7%, above the 3.6% forecast.
Inflation is running hotter than expected, potentially adding pressure on the Fed’s rate-cut outlook.
Markets are watching closely.
post-image
Any coins that once surged several hundredfold, such as $RAVE
, $LAB
, or $AKE
, have now fallen back to their starting points. BTW is once again taking a large short position
post-image
RAVE+3.34%
LAB-7.66%
AKE+0.72%
BTW+27.88%
2 Year Yields EXPLODING on CPI print
I keep telling you hikes why do you keep doubting?
post-image
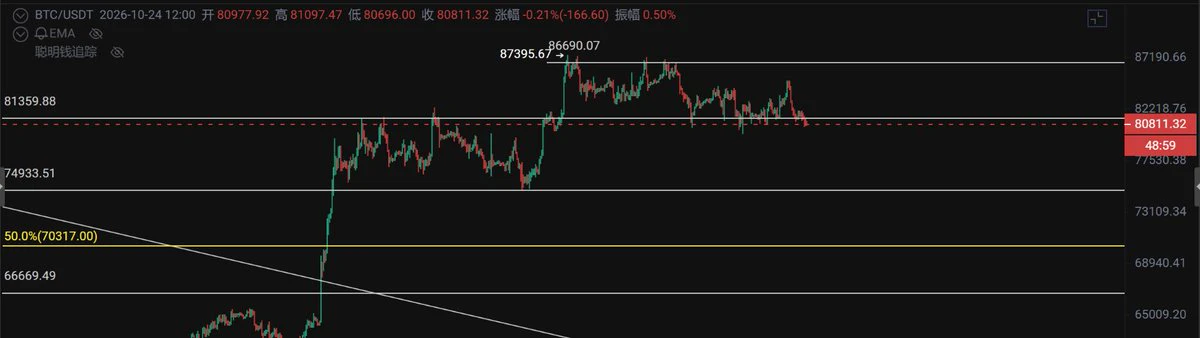
$BTC is currently at the range low and sits at the 4H 200MA/EMA. Until $82K is lost, this remains a strong support area. Once $84K is broken, the bears will regain control as the price returns to the middle/top of the range. There is no harm in waiting for either $82K or $84K to be lost and then reassessing. The bears have been very weak, and many altcoins have also been heavy, but on the other hand, this support level has held so far while the stock market has been selling off. Therefore, there are arguments for both scenarios here, so the simplest approach is to react only when a clear b
post-image
BTC-1.50%
Load More

Join 40 M users in our growing community

⚡️ Join 40 M users in the crypto craze discussion

💬 Engage with your favorite top creators

👍 See what interests you

Trending Topics

USSeptemberCPITopsEstimates

35.38k Views2.21k Discussing

US September CPI rose 3.7% YoY, above the 3.6% estimate; core CPI rose 2.6%, also above the 2.5% estimate. With inflation topping forecasts across the board, how will rate hike expectations shift? How will BTC react? Share your view.

DrLinHanSpeaksAtOxfordUnion

134.92k Views1.85k Discussing

GateWCTCS9GlobalTradingCompetition

37.14k Views6.06k Discussing

View More