



Share your thoughts
placeholder
Article
Financial News, Crypto Updates, Real-World Strategies
live-cover
LIVE1,454
My hand trembled when I set the stop-loss a few days ago, only to realize this morning that the filial piety was unnecessary. 😌

As the market repeatedly swung intraday, the price kept grinding around 91.82, with the volume shrinking more and more noticeably. Someone stepped in to buy every dip. I watched it for half a day; this kind of level is more of an opportunity than a panic signal, so I cautiously took a shot.

The price has now climbed to 104.92, giving a floating profit of +687.56%. We caught the rhythm of this move perfectly, and everyone is feeling great.

Don't lose your patien
post-image
ADA+1.42%
ZEC+20.11%
$RAY Signal】Long | 1H support holds after pullback
$RAY Pullback to near the 1H EMA20, with clear buy-side support orders on the order book and a 17.5% bullish depth imbalance. The 4H MACD histogram is contracting but remains above the zero line, while the price holds the key 1.24 level. The 1H RSI is 58, with most overbought pressure already released. The funding rate is a moderate 0.005%, showing no signs of overheating. The current risk-reward ratio is approximately 1.5, making it worth a try.
🎯 Direction: Long
⚡ Entry/limit orders: Enter in batches within the 1.243758 - 1.247500 range
post-image
RAY+43.19%
$ETH Signal】1H pullback long + 4H momentum support
$ETH Order-book sell pressure skewed -57.52%, yet the price is pinned at 2496.32. The 1H EMA20 at 2492.43 provides short-term support, while the 4H MACD histogram is expanding at 1.64, with the broader trend intact. The 1H MACD histogram is contracting at -0.32, indicating a short-term pullback.
🎯Direction: Long
⚡Entry/Limit order: 2489.64-2496.32
🛑Stop-loss: 2462.92
🚀Target 1: 2546.41
🚀Target 2: 2571.46
🛡️Trade management:
- Execution strategy: After reaching Target 1, reduce the position by 50% and move the stop-loss up to breakeven. I
post-image
ETH+1.32%
BTC+0.50%
SOL+3.11%
My hand trembled slightly as I set the stop-loss a few days ago, only to discover this morning that the filial piety was unnecessary. This $LINK move was simply meant to be mine. The last thing I saw before bed was it pulling back to the key level and holding firmly, with the signs of buyers stepping in at the bottom impossible to miss. At the time, I thought that even if I was wrong, I would only lose a small stop-loss by sticking to the plan. I never expected to get rich overnight, but then it started putting on a show all by itself.

When I opened the chart this morning, the price had alre
post-image
LINK+9.81%
DOGE+0.97%
XRP+0.60%
This long position was not opened by forcefully chasing the breakout at the moment it occurred; instead, I waited for the price to pull back to the upper boundary of the previous range and entered only after confirming the strength of the support. As the price approached the upper target zone, I began taking profits in batches as planned, closing out 70% of the position first, while raising the protective stop for the remaining 30% to above the entry price, so that even an intraday wick would not turn a profitable trade into a losing one. The moving averages continue to fan upward, key levels
post-image
BULLA-10.34%
ETH+1.32%
SNDK+0.79%
I was just glancing through $EURUSD and found this unfolding, looks nice so I have to see how it plays out.
#eurusd
post-image
EURUSD+0.01%
The week just started
Now, 6 more days to survive with just 14% Fable limit remaining.
The markets are keeping me and Fable locked in
post-image
#GateTops7DayNetInflowsGlobally
💰 CAPITAL FLOW IS SPEAKING — BUT BTC STILL HAS TO CONFIRM THE MESSAGE
One of the biggest mistakes traders can make is watching only the price chart.
Price tells us what is happening.
But capital flow can sometimes tell us where market participants are positioning themselves.
That is why Gate’s latest net-inflow data has caught my attention.
According to recent DeFiLlama-based data reported by Gate, Gate recorded approximately $520.45 million in net inflows over the past month, placing it #3 globally among centralized exchanges.
Earlier August data also showed
BTC+0.50%
ETH-2.49%
$ETH Signal】Long sniper entry + 1H pullback limit order
$ETH Order book buy/sell ratio 1.93, with buyers dominant; substantial orders are placed at 2495-2498. 1H RSI is 57.6, the MACD histogram is contracting, and the price remains above EMA20. The 4H Bollinger Band middle line is at 2480, with EMA20/50 arranged upward.
🎯Direction: Long
⚡Entry/Limit order: 2490.3166 - 2497.8100
🛑Stop-loss: 2458.3718
🚀Target 1: 2556.9672
🚀Target 2: 2586.5458
🛡️Trade management:
- After reaching Target 1, reduce the position by 50% and move the stop-loss up to the breakeven level. If the price falls back t
post-image
ETH+1.32%
BTC+0.50%
SOL+3.11%
Everyone’s eyeing BNB at 750—but the 4h chart is silently screaming “trap” while the daily range holds its breath.

$BNB /USDT - SHORT

Trade Plan:
Entry: 749.30 – 751.40
SL: 760.45
TP1: 742.77
TP2: 737.72
TP3: 730.14

Why this setup?
- Price is pinned at 750.35 with a 1D range, yet the SHORT bias (conf 55) targets a clean drop to 742.77 first.
- RSI on the 15m is only 56.1—no overheated bounce fuel, while ATR (4.2) shows volatility is compressed, priming a snap.
- Why now? The “waiting” status means the entry zone (749.30–751.40) is the exact battlefield; a rejection here flips momentu
BNB-1.65%
With this kind of move, I don't even need to think—the account is partying on its own 💃

A few days ago, the last thing I saw before bed was $ZEC still building a base up front without ever breaking down. The candlesticks looked dull, but funds had actually been testing the market in the shadows, and the buying pressure was already impossible to hide. Before bed, I left just one sentence: If there is no volume at the bottom, just wait.

Then I opened my eyes and the market took off 🚀, surging from 833.19 to 1217.25, with the position's return shooting straight above +3277.45%. It was trul
post-image
ZEC+20.11%
SNDK+0.79%
ADA+1.42%
Everyone’s long ZEC while the 4h chart screams distribution—who’s right?

$ZEC /USDT - SHORT

Trade Plan:
Entry: 1215.39 – 1231.17
SL: 1321.75
TP1: 1149.43
TP2: 1100.20
TP3: 1026.35

Why this setup?
- 1D trend is bullish, but the 4h setup says otherwise: SHORT bias at 84 confidence.
- Price is pinned at 1223.28 with RSI(15m) at 52—no momentum, just chop before the drop.
- ATR(1h) of 31.5 means we’re primed for a 2.5%+ move; targets sit at 1149 (TP1) and 1100 (TP2).
- Why now? The “waiting” status means the trap is set—either we sweep 1231 or dump.

Debate:
Are you fading this bullish
ZEC+20.11%
I just took profit on my long position, so I’m reviewing it while the memory is still fresh. The market was moving sideways at the time, with the moving averages on the hourly chart converging, volatility narrowing further, and the chips clearly being compressed. I judged that the direction would most likely break upward, so I first positioned part of my long near the lower boundary of the range.

The move started a little later than I expected, with even several false dips in between. However, none of the dips broke down the range structure, and the key levels were actually moving higher. Th
post-image
ZEC+20.11%
BNB-1.65%
September 7 Jinman Gold Morning Review:
Spot gold on the 4-hour chart has formed a bottoming and rebound pattern. After falling from the previous high to a stage low of 4282.53, the price stabilized and rebounded. It is currently quoted at 4428.61, overall remaining in a consolidation and recovery phase following oversold conditions.
Going forward, focus on statements from Federal Reserve officials and developments in geopolitical tensions. Hawkish signals will pressure gold prices, while rising safe-haven sentiment could support the bottom. News will have a clear impact on short-term price mo
post-image
ETH+1.33%
BTC+0.50%
Privacy leader #ZEC pumped again 🥲 The good news is that it’s up 6x since we entered ✌️ The bad news is that the short grid entered at 10XX is at an unrealized loss 🥲 You really can’t short it even a little! Market maker, are you still pumping because you want to surpass Bitcoin? $ZEC
post-image
ZEC+20.11%
  • 1
What is your top #Altcoin pick right now ⁉️
And which #Memecoin are you betting on next 🚀
👇👇👇
post-image
MEME-1.39%
MEMECOIN+83.05%
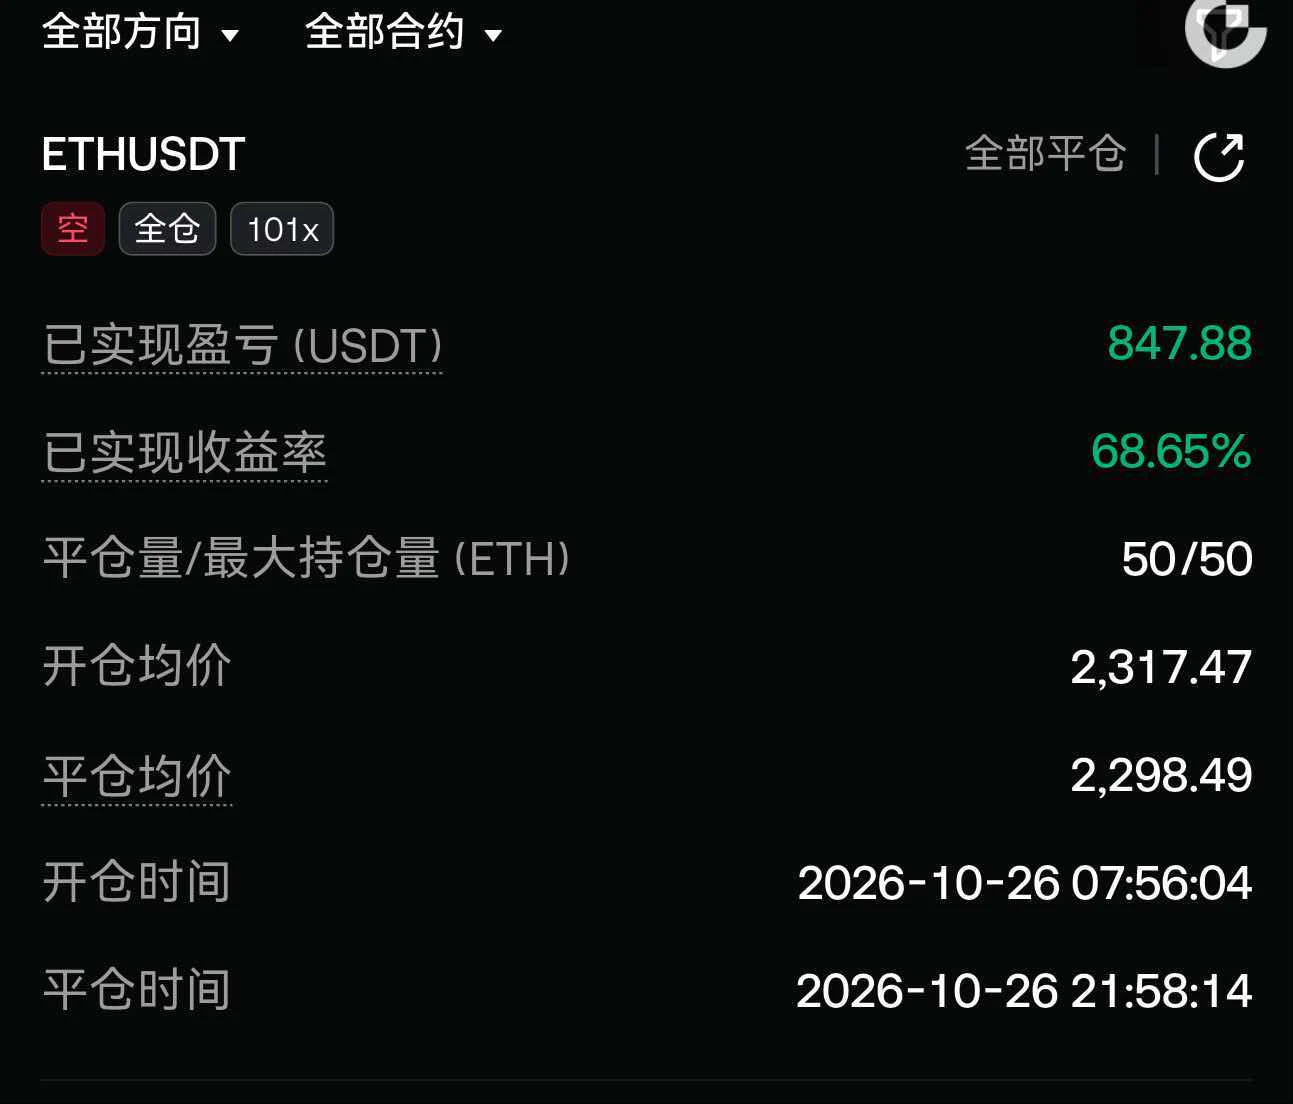
The weekend market is pretty boring. Our ETH 2510 short made money, and the 2475 long made money too—profiting from both directions.
Most traders missed NEAR's 84% short signal because the 1D trend screamed bullish.

$NEAR /USDT - SHORT

Trade Plan:
Entry: 2.4312 – 2.4610
SL: 2.6323
TP1: 2.3065
TP2: 2.2134
TP3: 2.0737

Why this setup?
- The 4h timeframe is flipping bearish against the daily uptrend—this is the classic “bull trap” setup.
- RSI 15m at 55 shows weak momentum, not enough fuel to break 2.4610 resistance.
- Entry zone 2.4461 with TP1 at 2.3065 gives a 5.7% move before the daily trend reasserts.
- ATR 1h (0.0597) means volatility is compressed—breakouts are violent. Why now? Price is stalling under supply
NEAR+11.60%
Load More

Join 40 M users in our growing community

⚡️ Join 40 M users in the crypto craze discussion

💬 Engage with your favorite top creators

👍 See what interests you

View More