Square
Following
Hot
News
Profile
Share your thoughts
placeholder
Article
#每周来晒 #美联储9月纪要偏鹰 October rate hike? Most likely "dovish"—but the "tail risk" of an upside CPI surprise is not priced in
I. Will there be a rate hike in October? My view: Most likely not; the bar for "hiking in consecutive months" is too high
The logic is simple:
- September just saw a hike (3.75-4.00%, the first restart of rate hikes since 2023)—two consecutive monthly hikes would be an "extreme move" in Fed history, requiring data to show a "cliff-like deterioration"
- Nonfarm payrolls were only 29k, with unemployment at 4.2%—the labor market does not support consecutive rate hikes
- The mee
post-image
ThisIsTranslateContent:
#每周来晒 #美联储9月纪要偏鹰 October hike? Most likely "dovish"—but no one is pricing the "tail risk" of CPI exceeding expectations
I. Will there be another hike in October? My view: most likely not—the bar for "making it two months in a row" is too high
The logic is simple:
- September just saw a hike (3.75-4.00%, the first resumption of hikes since 2023)—consecutive monthly hikes have been "extreme action" in the Fed's history, requiring a "cliff-like deterioration" in the data
- Payrolls were only 29,000 and the unemployment rate was 4.2%—the labor market does not support consecutive hikes
- The minutes said "most officials expect one more hike this year," but did not say "one more hike in October"—leaving room for maneuver
So, a CPI upside surprise → October odds jump from <20% to 30-40% → the market gets "nervous again"; but for an October hike to actually happen, we would need "hot CPI + another payrolls collapse + officials talking tough" all three together—the odds are still not high. CPI's role is not to "decide October," but to "determine the December and next year's path."

II. How will the CPI scenario play out? Two versions, opposite directions
Scenario A: CPI cools (core monthly increase ≤0.2%) → October is completely off the table, December odds also fall → Treasury yields decline and the dollar weakens → BTC rebounds to $85K+, while U.S. AI hardware stocks get a new lease on life. This is the bulls' scenario.
Scenario B: CPI exceeds expectations (monthly increase ≥0.3%) → October odds return to 30-40%, and December becomes "a done deal" → the 30-year Treasury yield surges back above 5.8%, the dollar continues strengthening → BTC tests $82K again, with $80K in sight if it breaks. This is the bears' scenario.

Oil prices returning above $100 (Brent) + the situation in the Middle East mean the probability of "sticky" inflation is not low—don't assume CPI will definitely cool.

III. Impact on crypto and U.S. stocks: BTC is waiting for judgment at $82K, while U.S. stocks struggle to survive in the "gap" under 5.7% Treasury yields
- Crypto: $82K is the courtroom—CPI cooling → hold and rebound; CPI surging → breakdown toward $80K. Today's $550 million in liquidations has already washed out leverage once; the direction depends entirely on the data
- U.S. stocks: 30-year Treasury yield at 5.72% (the highest since 2002) + dollar at 102—high-valuation assets are all under pressure. AI hardware (Micron rising 4% against the trend) has "earnings protection," but unless yields fall, any rebound is just "jumping the gun"
- Don't forget the linkage: Treasuries are the "pricing anchor" for global risk assets—if they don't turn back, neither crypto nor U.S. stocks can fly solo

IV. Has the market's expectations been "fully priced in"? The answer is: half and half
Already fully priced in: "no October hike"—with odds below 20%, traders have already lined up; "hawkish minutes"—BTC did not crash after the minutes were released (it was hit by Treasuries + the dollar, not by the minutes).
Not fully priced in: the tail risk of "CPI exceeding expectations"—the market currently assumes that "CPI will cool and December is the real focus"; if 10/14 proves that wrong, it will be a "double whammy": higher rate expectations + Treasuries making new highs.
This is the real "asymmetry": downside risk is even less priced in than upside risk.

An October hike will most likely be a "false alarm," but a CPI upside surprise would be a "real landmine"—the market has heavily priced in "no hike" but not enough "blowout" risk. Don't take a heavy position before CPI; after CPI, use $82K to determine the direction.
This week's market is like the night before an exam—everyone knows there will be a "test" (CPI), but no one knows "how difficult the questions will be." Don't guess the questions; wait for the paper. $82K is the "passing line": if it breaks, hand in the paper and leave; if it holds, wait for the results.

Are you waiting for CPI or have you already taken a side with your position? Let's discuss in the comments 👇
repost-content-media
BTC-1.39%
  • 2
Daily market brief : BTC/ETH key levels
live-cover
LIVE2,426
  • 1
$ZEC has entered the oversold zone; a rebound and a bottom are two different things
$ZEC 24-hour change: -7.57%, current price 1,206.21. The 1-hour and 4-hour RSI are 3 and 28, respectively. Oversold conditions create demand for a rebound, but a rebound only shows that the decline was sharp; a bottom still requires the price to stop breaking down the structure.
Set emotions aside for now—the structure provides very specific information. The 1-hour EMA20 is at 1,263.69, currently weak; the 4-hour EMA20 is at 1,301.3, currently weak. Shorter time frames expose changes, while longer time frames l
post-image
ZEC-7.76%
$RLC
is grinding against resistance, with bears accounting for 53% and already starting to close in😤 Open interest quietly increased by 3.7%, all of it short-side positioning lying in wait; if it cannot break above 0.75, it is a bullish trap—if the pullback breaks 0.718, dump it directly. Those holding losing positions, don’t blame me for not warning you.
post-image
RLC-1.11%
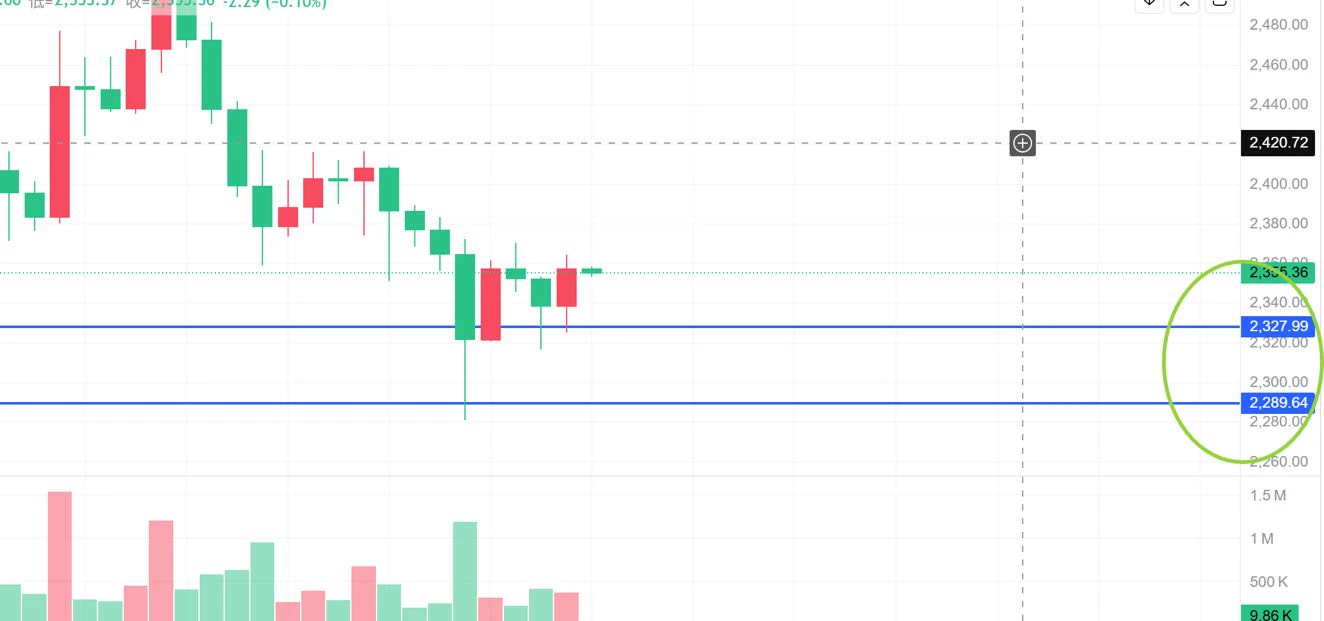
ETH is currently around $2,530, remaining weak intraday. Yesterday, ETH briefly plunged rapidly from around $2,700, with a daily decline of approximately 4.6% on October 7, indicating that the short-term trend has shifted from range-bound strength to a clear risk-release phase.
My short-term conclusion: It is not suitable to blindly chase longs right now; prioritize waiting for key levels to confirm. The risk-reward for shorting a rebound is temporarily better than directly bottom-fishing.
Key levels
ETH price
Short-term significance
$2,600–2,620
First resistance/long-short boundary area
$2,68
ETH-1.43%
Oil prices and U.S. Treasury yields are both surging—are global financial markets about to undergo a major shift?
Looking at the market is enough to break out in a cold sweat: international oil prices have extended their gains to nearly 3%, while Treasury yields are even more extreme, with the 10-year yield jumping straight to 5.32% and the 30-year yield soaring to 5.71%. Meanwhile, spot silver has fallen below $59, all three major U.S. stock index futures are down, and Nasdaq futures have also dropped 0.4%.
This signal is extremely dangerous. Persistently rising oil prices are directly intens
post-image
NAS100+0.10%
I’m not some trading guru who always wins; I’m just a trader competing in the market. I’ve opened copy trading to keep myself disciplined. If you cannot accept the risk of losing your principal, please follow with caution. Trading is a long-distance race—respect the market and make rational decisions. The hardest part of trading is holding.
post-image
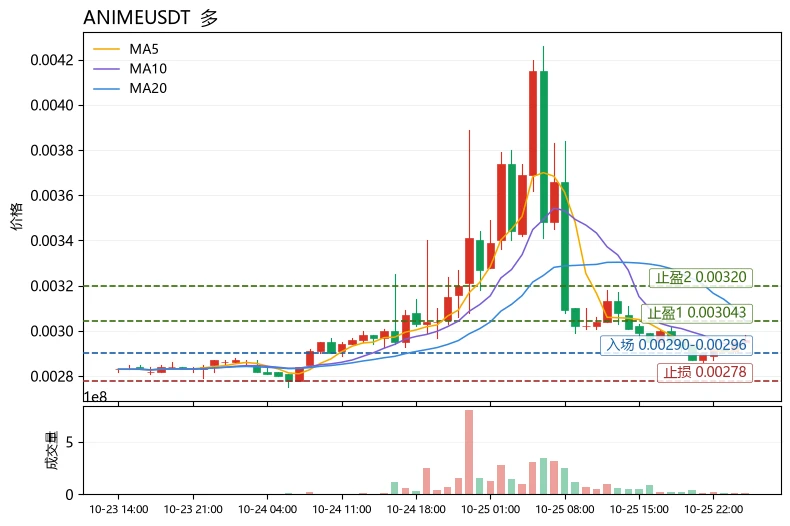
Preparing to short $STRK
! ⚡Entry range: 0.0598 - 0.0611Target 1: 0.0555Target 2: 0.0515Stop-loss: 0.06354STRK showed clear signs of weakness after a vertical surge to 0.06159, with the 1-hour RSI(6) reaching an overextended 82.19. The 15-minute chart showed a rejection wick at the high, signaling that the price may mean-revert toward the MA7 support near 0.05793. Trade here 👇👇👇Hot coins: $ETH : Current price 2,531.46 - 24-hour change: -1.68%$CTSI : Current price 0.033 - 24-hour change: +13.29%
post-image
CTSI+44.25%
The most dangerous thing about watching the market is eventually wanting to place a trade just to make the boredom go away.
A dip makes you want to buy; a bounce makes you afraid of missing out. You originally watch the one-hour chart, but when you can’t wait, you switch to five minutes, then one minute—the shorter the time frame gets, the more reasons you find.
What I care about more is this: Did your entry conditions really appear, or have you simply stared at the chart for too long and want to give tonight a plot?
Before placing an order, write one sentence: “I’m watching the __ time frame
post-image
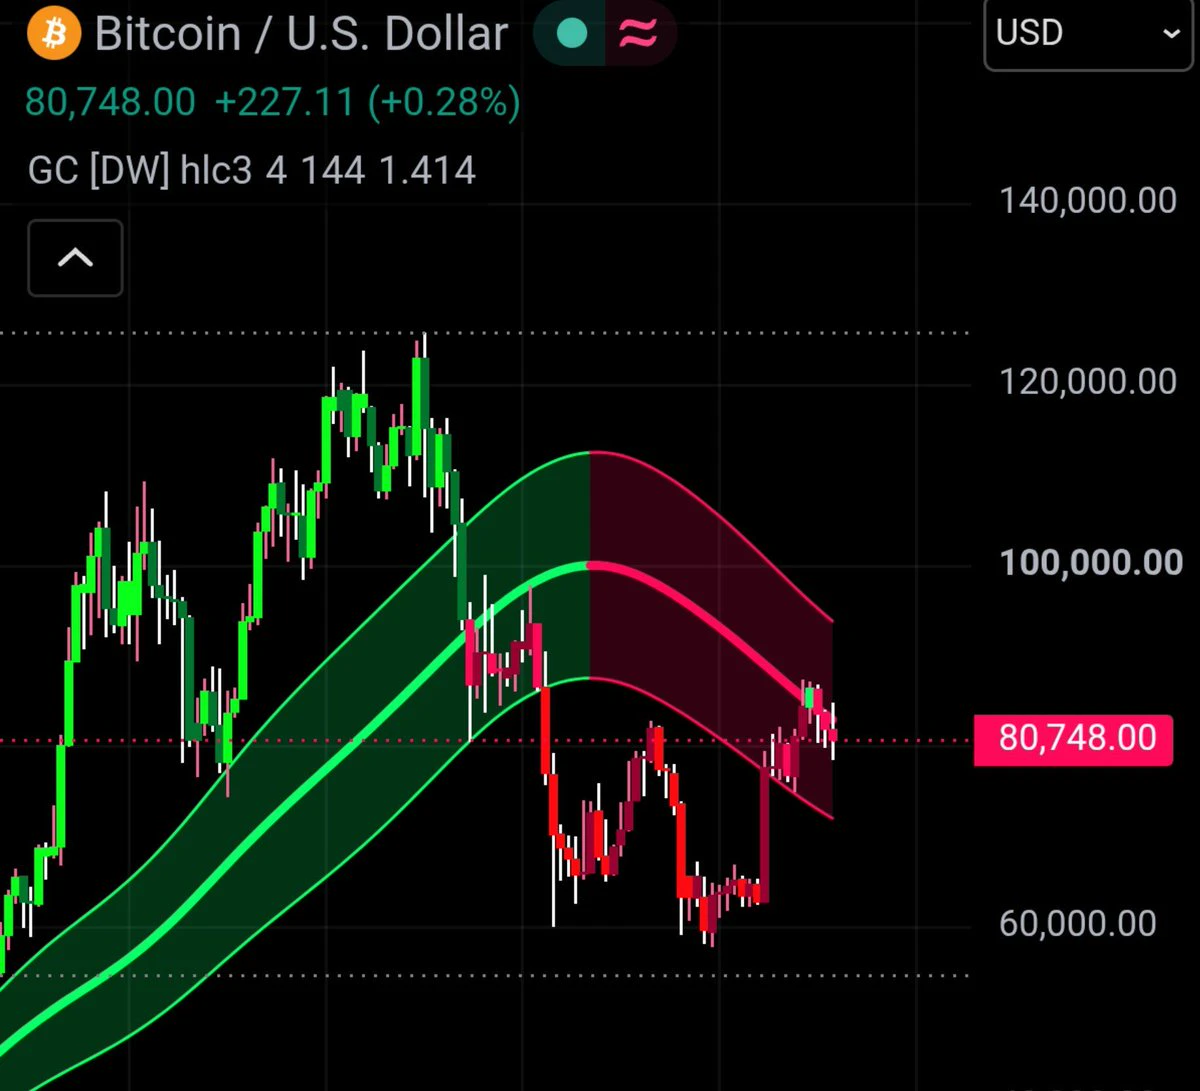
#btc We might be on our way to LML as long as we stay below the MO. You should see this as a great opportunity. If it happens you'll be able to buy #btc sub $75k for one last time...
post-image
BTC-1.44%
BTC October 8 Daytime Market Outlook
BTC has fallen to near the 82,700 support level, but the rebound is very weak. Going long is not recommended; shorting at higher levels is relatively safer in the short term.
Watch the resistance levels at 84,100, 84,700, and 85,300 above. If BTC is unable to rebound to near these levels, shorts can be opened in batches.
If it declines directly without rebounding, watch the weekly-level support at 82,000. If this level breaks and cannot be reclaimed, shorts can be added.
BTC-1.44%
Last cycle, I bought low, sold high, and did nothing in between.
I don't expect this cycle to be much different.
There will be plenty of speed bumps along the way.
Just don't let them shake you out of a good bag.
$BTC
post-image
BTC-1.44%
#HyperliquidPerpOIMarketShareHitsRecord11.9% #HyperliquidPerpOIMarketShareHitsRecord11.9% 📈
Hyperliquid is gaining ground in the perpetual futures market, with its perp open-interest market share reaching a record 11.9%.
The milestone highlights growing activity and liquidity on the platform as traders increasingly turn to on-chain perpetual markets.
🔹 11.9% record perp OI market share
🔹 Rising trader activity
🔹 Stronger liquidity and market participation
🔹 Growing competition in the perpetuals sector
If this momentum continues, Hyperliquid could further strengthen its position among majo
post-image
HYPE-4.07%
  • 1
$LINK has already entered the oversold zone, but “it’s due for a rebound” and “it has bottomed” are completely different things.
I’m watching just one point of divergence: whether there is still buying support after breaking through 13.522. The current price is 12.843, with volume at 2.05x. The 1-hour and 4-hour charts are both weak, with RSI at 19 and 18, respectively.
If it breaks through 13.522 and volume continues to expand, control will favor the bulls; if it breaks below 12.816 and fails to reclaim it, the short-term outlook is invalidated. Stop guessing the bottom for now and wait for
post-image
JUST IN: Robinhood bought Bitcoin ($BTC ) for its corporate balance sheet.
The retail broker is now among institutions treating BTC as a treasury asset, signaling a shift in how fintech firms view crypto reserves.
HOOD-3.79%
BTC-1.44%
Last @PanteraCapital's report showed that about half of the tracked tokenized private credit is put to work on DeFi
If you know me, you know where this is going:
Straight to @plumenetwork's vaults
$PLUME already hit $200M+ in TVL and over $900M settled
post-image
PLUME+3.12%
The Fear & Greed Index is still at 64, so why is the question that matters most now not “Can it keep rising?” but “If I’m wrong, where do I exit?”
The answer lies in $SO ’s data: the current price is 113.49, MA5=114.588 has crossed below MA20=115.606, the MACD histogram at -0.06815 is bearish, RSI=27.4 is approaching oversold territory, and the price is running along the Bollinger lower band at 113.993, with the 30-candle amplitude at approximately 5.18%. This is a weak downward structure, but the short term has already entered an oversold state while tracking the band, making shorting unattra
post-image
NMR-6.01%
$ENA has fallen to this point, and the easiest illusion to fall into is: the more it has dropped, the cheaper it must already be. I would rather lay out the opposing case first.
Bears see the risk of breaking below 0.215, while bulls need to prove that buyers will still step in after a breakout above 0.2342. Current volume is 0.49x.
The current price is 0.2172, about 1.01% from the 1-hour support at 0.215 and 7.83% from the resistance at 0.2342. The position determines which side is more urgent, so stop guessing the bottom for now and wait for a new support structure.
It is more reliable to l
post-image
ENA-6.76%
You mean Li Youtian also fell off the cliff because the brake was stomped off, right??
post-image
Load More

Join 40 M users in our growing community

⚡️ Join 40 M users in the crypto craze discussion

💬 Engage with your favorite top creators

👍 See what interests you

Trending Topics

Gate Money Officially Launches

3.41k Views12.77k Discussing

Gate officially launches Gate Money, a global integrated financial services app that brings digital assets, fiat, stocks, ETFs, gold, bank accounts, and payments into one Gate App. Users can manage assets, invest, send and receive funds, convert currencies, and make payments — all from a single account. Which use case are you most excited about? [👉 Learn more](https://www.gate.com/announcements/article/102094)

Fed September Minutes Lean Hawkish

64.01k Views2.69k Discussing

Samsung Q3 Operating Profit Surges 782.5%

36.53k Views1.91k Discussing

View More