Square
Following
Hot
News
Notifications
Profile
Share your thoughts
placeholder
Article
Annual Streamer Showdown! Who Is the True Traffic King of Gate Social?

The annual highlight is finally here! Gate Social’s annual streamer and creator awards are officially underway!
This year, some won fans over with their skills, some stood out with their talent, and some delivered god-tier analysis that had fans saying, “We’re taking the advice this time”; others turned dry market updates into something more exciting than a TV drama with nothing but their words!
They’re the life of the party in content creation, the experts in the knowledge-sharing space, and a big reason fans open Gate So
AMD+11.55%
  • 21
FeaturedU.S. October CPI Preview Report (Crypto Trading Edition)📊

I. Key Basic Information❗️

1. Release time: November 10 at 8:30 a.m. ET, corresponding to 9:30 p.m. Beijing time on November 10

2. Previous readings (September actual figures, both above expectations):

◦ Headline CPI: 3.7% year over year, 0.6% month over month (largest increase in 5 months)

◦ Core CPI (excluding food and energy): 2.6% year over year, 0.3% month over month; services and housing rents were stickier than expected

3. Current market consensus for October:

◦ Headline CPI: 3.5%-3.6% year over year, easing to 0.3% month
BTC-0.65%
ETH-1.23%
ZEC+1.29%
SNDK-0.18%
  • 1
Trenches
ZIG
Z
bade
b
ZIG
0x8c...1145
Market Cap
$.
Change
.
24h Vol
$.
Holders
.
BTC
B
bade
b
BTC
C5xp...pump
Market Cap
$.
Change
.
24h Vol
$.
Holders
.
Diamond
D
bade
b
Diamond
5VCE...pump
Market Cap
$.
Change
.
24h Vol
$.
Holders
.
DOGE
D
bade
b
DOGE
DoGE...fm7R
Market Cap
$.
Change
.
24h Vol
$.
Holders
.
STONK
S
bade
b
STONK
6GmA...UNgx
Market Cap
$.
Change
.
24h Vol
$.
Holders
.
#BTC
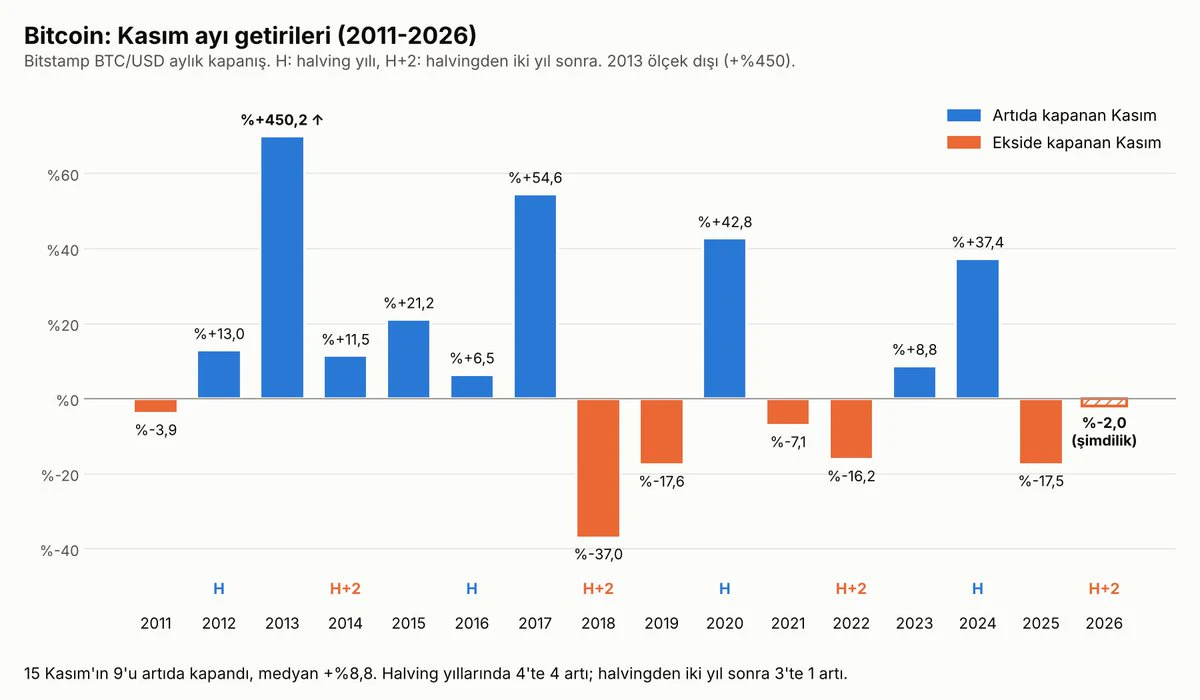
November stats.
Friends, November has historically been one of the stronger months for Bitcoin $BTC .
Since 2011, 9 of 15 Novembers have closed in the green, with a median return of +8.8%.
But its place in the cycle matters. Novembers in halving years have always closed in the green: 2012 +13.0%, 2016 +6.5%, 2020 +42.8%, and 2024 +37.4%. Novembers two years after a halving have been mixed: 2014 +11.5%, 2018 -37.0%, 2022 -16.2%.
2026 falls into this second group in the cycle. This November is currently down -2.0%, below its opening price of 77,425.
The levels I’m watching are the 50-week a
post-image
BTC-0.67%
Congratulations to the bot’s big-data-powered top-selling model for successfully predicting Litecoin’s sell-off. Each price alert is lower than the last—a classic case of a major holder steadily selling. Two sell-offs, each followed by a pullback of over 30 points. Be cautious about bottom-fishing and going long. Resistance at 59 #猎狗AI机器人 $LTC
LTC-0.07%
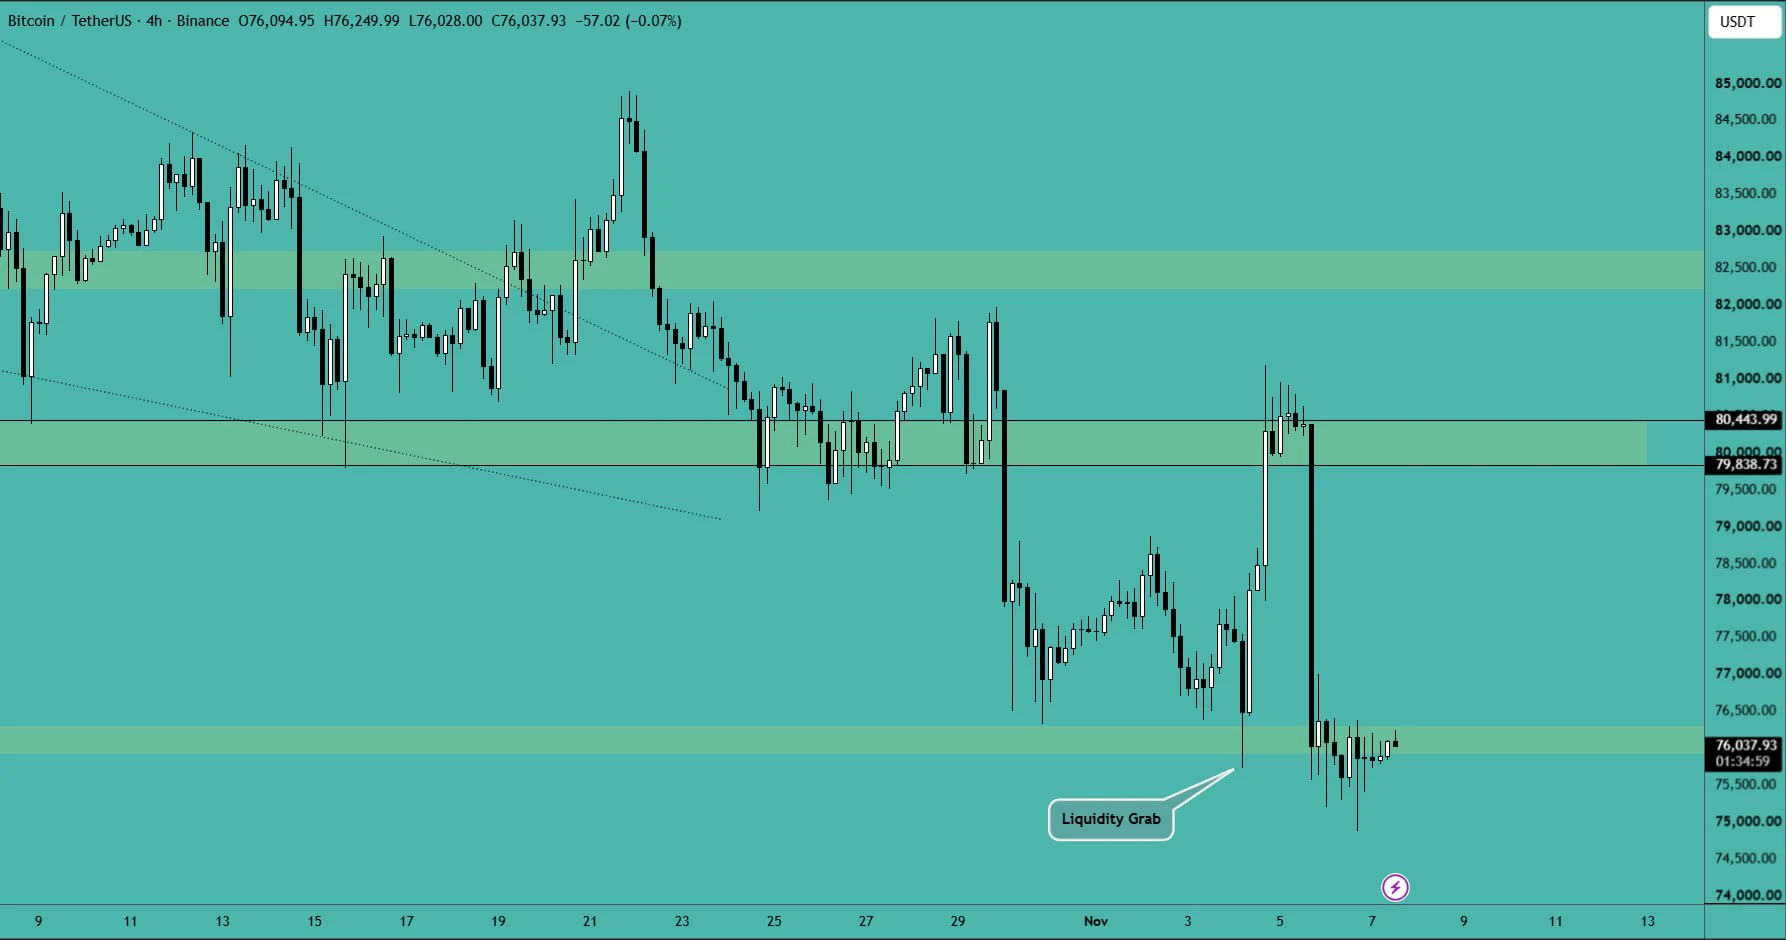
Bitcoin has had a fake out and now broken the key support, with price moving sideways in that area. Resistance is becoming increasingly strong and reliable, so a short-term liquidity hunt can happen, followed by another downward move
$BTC ‌#BTCETFOutflowsContinue #GateSocialAnnualStreamerAndCreatorAwards #ShareWeekly
post-image
BTC-0.67%
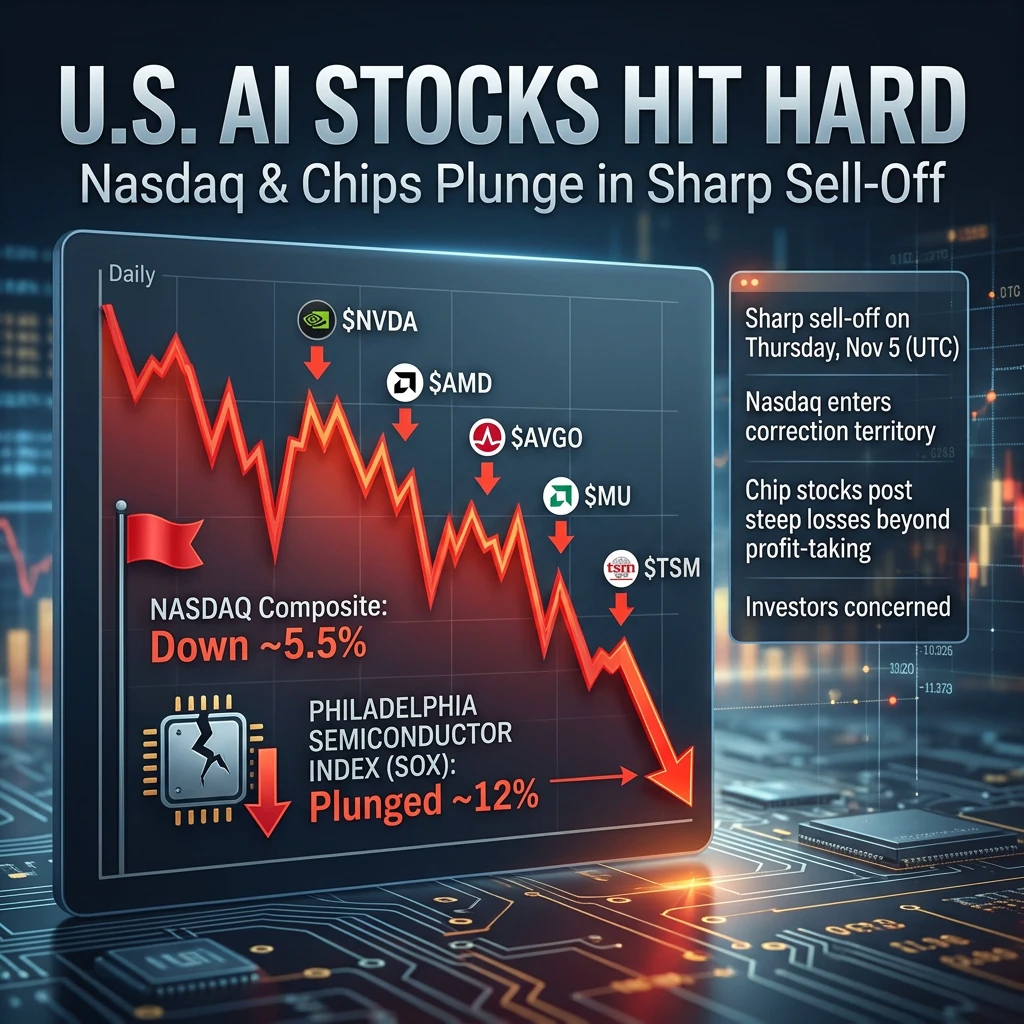
#USAIStocksHitHard

𝗨𝗦 𝗔𝗜 𝗦𝘁𝗼𝗰𝗸𝘀 𝗛𝗶𝘁 𝗛𝗮𝗿𝗱: 𝗗𝗼𝗲𝘀 𝗔𝗜 𝗛𝗮𝘃𝗲 𝗮 𝗩𝗮𝗹𝘂𝗮𝘁𝗶𝗼𝗻 𝗣𝗿𝗼𝗯𝗹𝗲𝗺?

💡 𝗧𝗵𝗲 𝗠𝘆𝘁𝗵: 𝗔𝗜 𝗦𝘁𝗼𝗰𝗸𝘀 𝗢𝗻𝗹𝘆 𝗚𝗼 𝗨𝗽

Many investors believe that companies connected to artificial intelligence will continue growing because AI is becoming more important every year.

But there is a big difference between a technology having a bright future and its stocks being worth any price.

Thursday, November 5, delivered a powerful reminder of this difference. U.S. technology stocks suffered a major sell-off, raising an important question: Are i
post-image
AMD+11.55%
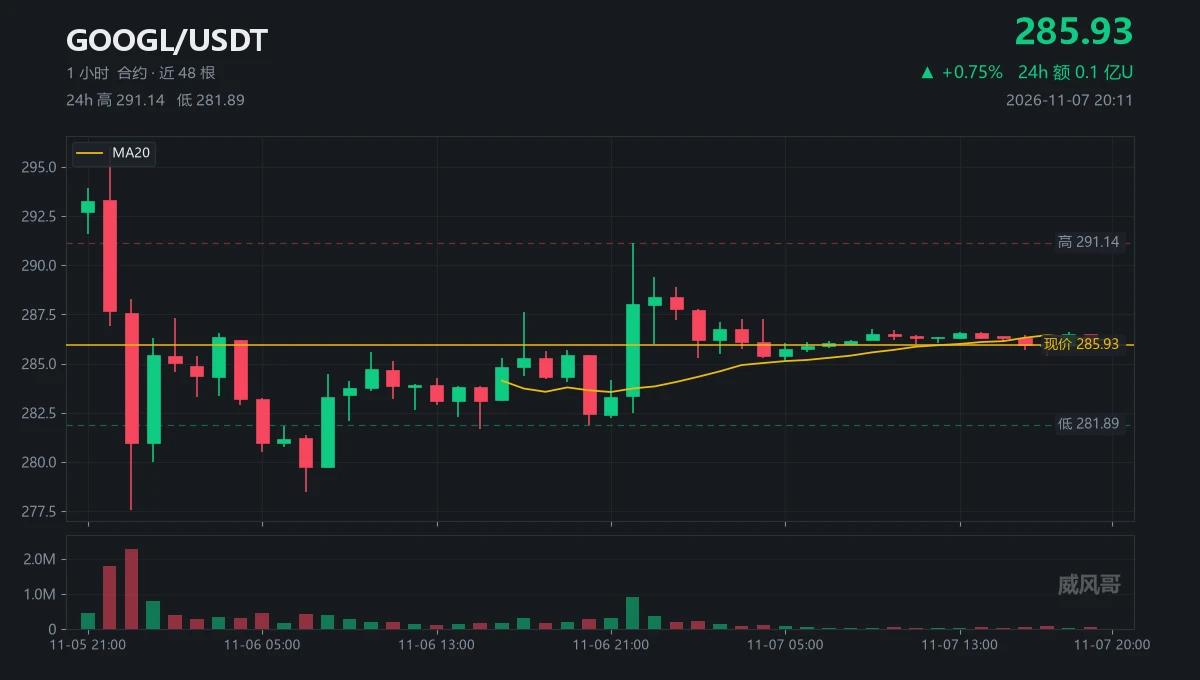
That same afternoon, SNOW traded just 126k, while GOOGL traded 8.69 million.
Note: Stocks in the same pool, with a 70-fold difference in liquidity.
The difference was all in that one hour at 22:00 on 11-06.
3.53x the volume, surging straight from 283.34 to 291.14.
The price moved eight bucks in one hour, $GOOGL with a daily range of 3.3%.
Note: That was the biggest candle of the week, and nobody followed.
Then over the next twenty hours, it gave back two-thirds of the gains.
Current price: 285.93, 5.21 away from 291.14.
Note: Just 22 cents from the moving average at 286.16, hovering right at
post-image
GOOGL+0.11%
#每周来晒 #BTCReclaims76000 Bitcoin’s $76K Battle: Accumulation Signal or Another Bull Trap?
Bitcoin is testing an important psychological level, but the latest market signals are sending two different messages. Price has attempted to reclaim $76,000, while institutional ETF flows remain deeply negative and the Ahr999 indicator has returned to its accumulation zone. This is exactly the kind of market where looking at price alone can lead to the wrong conclusion.

$76,000 Is the Immediate Market Pivot

Gate market data reported BTC trading around $76,012 after breaking above $76,000. However, anoth
post-image
BTC-0.67%
ETH-0.91%
#TOTAL3
Altcoin market capitalization.
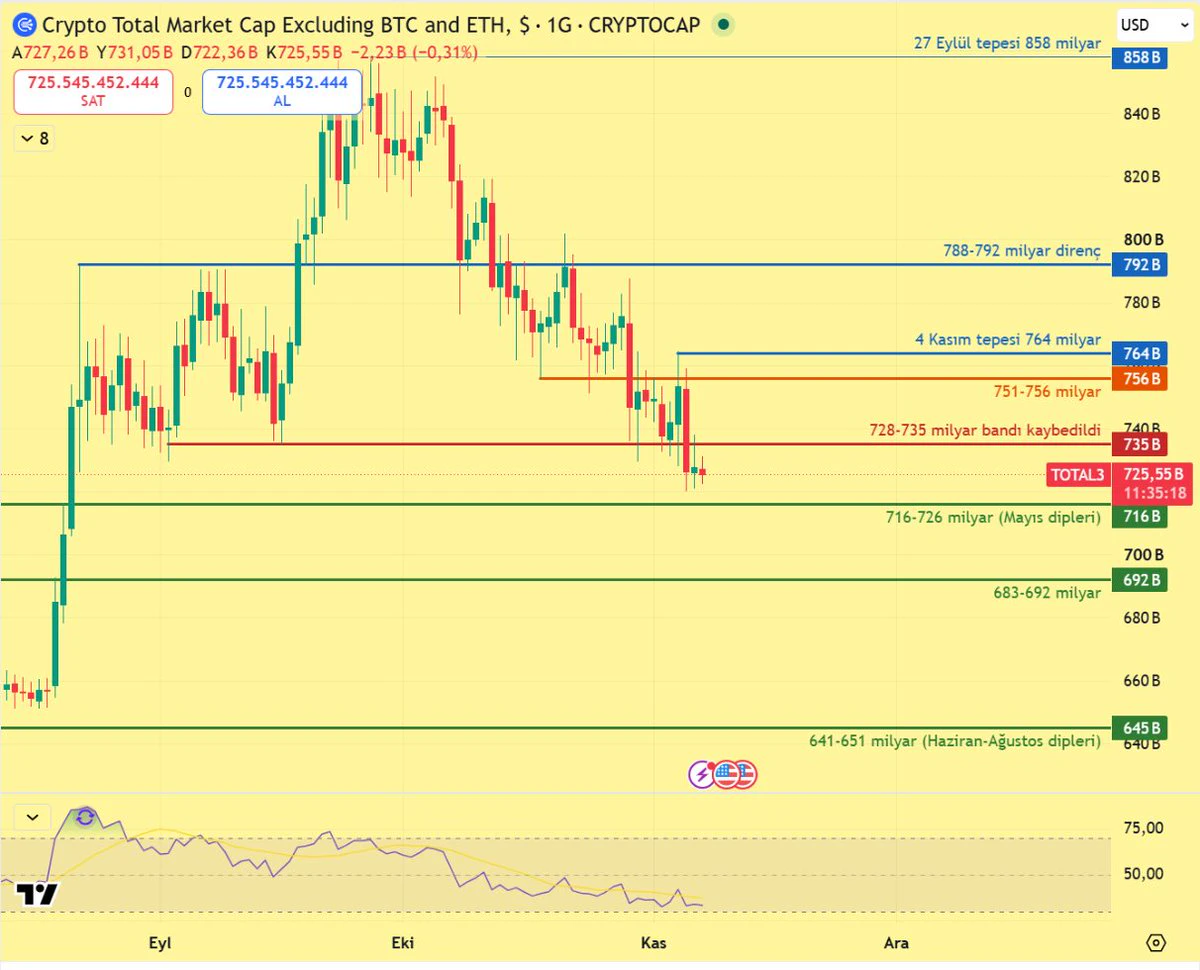
Friends, altcoin market capitalization excluding BTC and ETH, TOTAL3, closed on November 5 at 726 billion, below the 728–735 billion support band. This band held on September 2, September 16, and October 30; the 200-day average at 729 billion is also here. The November 6 close also came in below the band at 727.8 billion.
Currently around 725.6 billion. The first support below is 716–726 billion, where the May lows are. If this level is lost too, 683–692 billion comes into play, followed by the June–August lows at 641–651 billion.
Above, 735 billion needs
post-image
#BTCETFOutflowsContinue #ShareWeekly
#WCTCS9
BTC ETF Outflows Continue: Is Bitcoin Facing More Selling Pressure?

Bitcoin is facing another important challenge as institutional money continues moving out of spot Bitcoin ETFs. Recent withdrawals have raised concerns about institutional demand, market confidence, and Bitcoin's next price direction.
ETF outflows are important because they can indicate that investors are reducing their exposure to Bitcoin. When withdrawals continue across multiple trading sessions, buying support may weaken and selling pressure can increase.
However, I do not be
  • 2
#USNonfarmPayrolls

Headline says 165,000. The market read only the headline. The payrolls report itself says something else. This time, do not trade the headline. Read where the jobs came from, what pay did, and how much people actually worked.

October payrolls rose 165,000. The outlook was 65,000. The jobless rate eased to 4.1%, from 4.2% in September. August and September were revised up by a combined 84,000, with September now at 60,000.

That looks hot. But the prior-year average was only 48,000 per month. One strong month after a weak run does not prove a new trend. It proves the da
post-image
METAN-8.36%
BTC-0.67%
ETH-1.26%
ZEC+1.16%
HPP+15.02%
Many people treat “extreme fear” as a direct buy-the-dip signal, which is a classic misuse of sentiment indicators. The Fear & Greed Index only reflects sentiment levels; it does not provide entry timing. Market structure and fund flows are what really determine direction.
The current Fear & Greed Index is 25, in the extreme fear zone, but BTC$BTC has not seen panic selling: the current price is 75992, down just 0.23% in 24h. MA5=76066.3 remains above MA20=75963.1, and the MACD histogram at +60.24 remains bullish, indicating narrow consolidation within the Bollinger Bands [75757.9, 76168.2].
post-image
HYPE+0.24%
BCH+1.05%
  • 2
#BTCETFOutflowsContinue Is Institutional Demand for Bitcoin Losing Momentum?
Ready to publish
**Bitcoin ETF Outflows Continue: Is Wall Street Losing Confidence in Bitcoin, or Is This Just Another Market Shakeout?**
The Bitcoin market is facing another important test as continued outflows from spot Bitcoin ETFs raise questions about institutional demand. ETFs have become one of the most important bridges between traditional finance and the cryptocurrency market. They allow investors to gain exposure to Bitcoin without directly holding or managing the asset.
That is why ETF flows matter so much
BTC-0.31%
Don't Just Keep Checking the Markets! Gate's Annual Hidden-Gem Creators Are Waiting for You to Discover Them!

Friend, what's the first thing you do when you open Gate Social each day?
Check the market? Browse posts? Follow the latest trends? Or see what great content your favorite streamer has brought you today?
If all of the above apply, congratulations—you’re a seasoned social media surfer!
Over the past year, Gate Social has seen many outstanding streamers and creators emerge. Some excel at sharing expert knowledge, some are great at interpreting market trends, and others use their humor a
MU+4.71%
  • 26
Can BTC rebound to $80,000? Near $75,800, these signals are crucial to watch!

Bitcoin is currently at $75,800, and Ethereum at $2,240. The question on everyone’s mind is: How far can this rebound go?
My approach is to look at support first, then breakouts. If BTC holds $75,000 and climbs back above $77,000, it could test $78,000–$79,000 in the short term. If it breaks above $79,000 on strong volume, $80,000 will become the next psychological level. However, if the rebound comes on declining volume and prices pull back after rising, it shouldn’t simply be treated as a trend reversal.
For ETH,
AMD+11.55%
  • 40
# BTC ETF Outflows Continue

Dear friends,

Bitcoin continues to experience short-term fluctuations, creating opportunities for short-term entry and exit strategies.

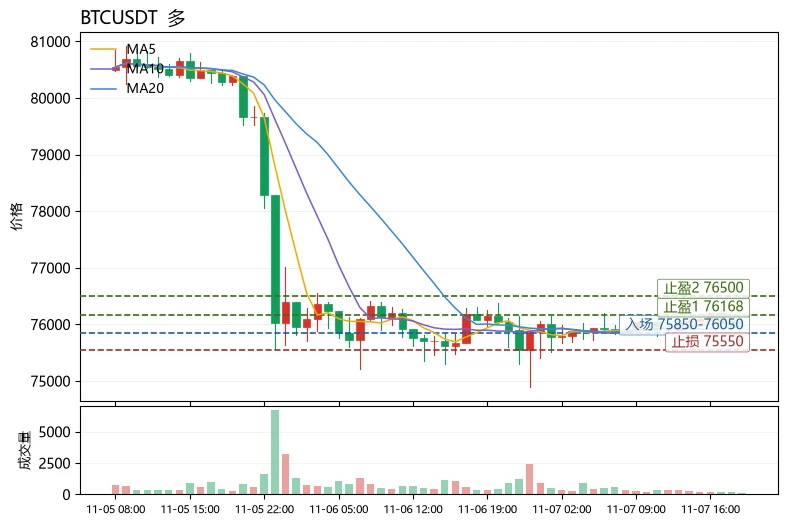
My current trading plan is focused on the $75,500 entry level, with a target exit between $80,000 and $81,000, depending on market conditions.

**My Trading Plan:**
- Entry Price: $75,500
- Leverage: 10x
- Target Exit: $81,000
- Alternative Exit: $80,000 if market risks increase.

For now, I have set my closing target at $81K. However, if market conditions become more uncertain, I will consider closing the position at $80K.

Bitc
post-image
BTC-0.65%
  • 7
  • 1
Don't rush to short, and don't rush to go long! BTC and ETH are gearing up for a crucial directional move!

BTC is now at 75800 USD, and ETH at 2240 USD. The market is at a sensitive point. Bulls are hoping for a rebound, while bears are waiting for a breakdown, with both sides watching for the other to make a mistake.
For BTC, watch the 75000 USD support and 78000—79000 USD resistance. If 75000 USD holds and the price breaks back above 77000 USD, watch to see whether the rebound can continue; if it breaks above 79000 USD on strong volume, bullish confidence may recover further.
For ETH, watch
MU+4.71%
  • 29
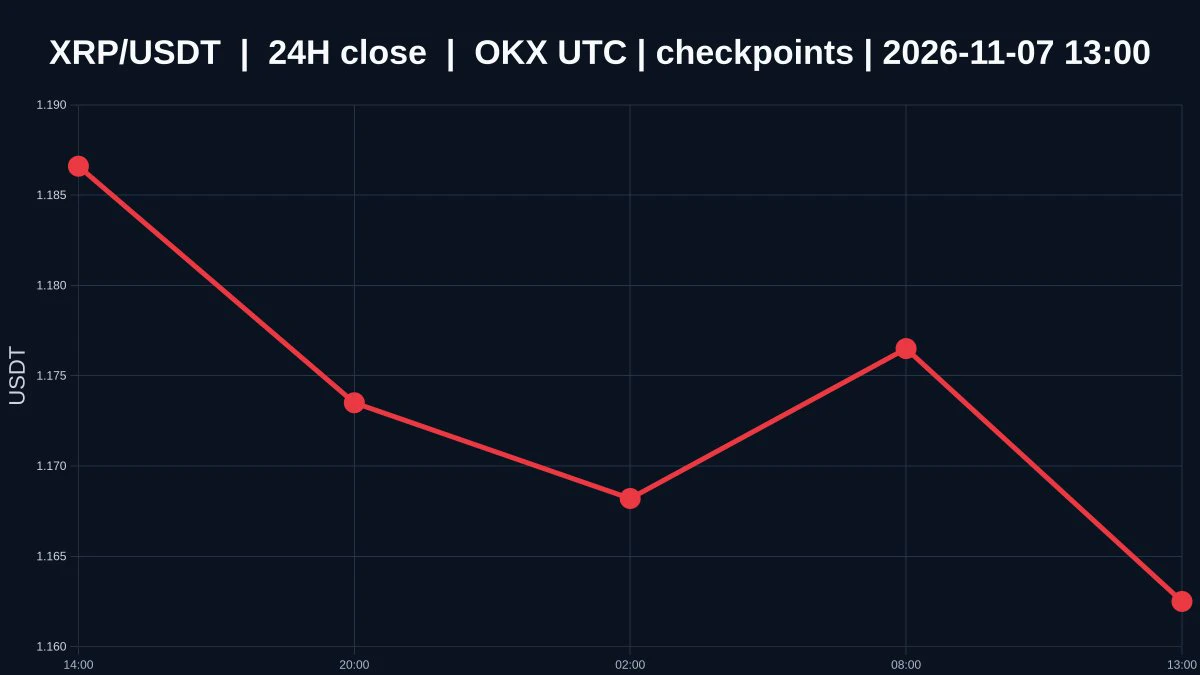
After $XRP fell to 1.1622, oversold conditions only show that selling pressure has occurred

$XRP is currently priced at 1.1622, down 2.212873369793855% over 24 hours, with an intraday low of 1.1518 and a high of 1.1996. The 1-hour and 4-hour trends are both weak, and the volume ratio is 0.007603110396587646, indicating extremely low market participation. Oversold describes a condition; a bottom is a confirmed outcome. A steep decline only shows that selling pressure has occurred. It does not automatically mean the price is cheap, much less prove that buyers are actually defending the area aro
post-image
XRP-1.15%
Load More

Join 40 M users in our growing community

⚡️ Join 40 M users in the crypto craze discussion

💬 Engage with your favorite top creators

👍 See what interests you

Trending Topics

USAIStocksHitHard

18.41k Views3.66k Discussing

U.S. stocks sold off sharply on Thursday, November 5 (UTC). The Nasdaq closed down around 5.5%, entering correction territory, while the Philadelphia Semiconductor Index plunged roughly 12%, with chip stocks including $NVDA and $AMD posting steep losses. Beyond profit-taking, investors are growing concerned about the pace of AI data center construction, capital spending, and future returns on investment. The key question now is whether the AI sector’s lofty growth expectations need to be repriced. Where do you think the next opportunities will emerge: chip stocks, tech giants, or other sectors?

USNonfarmPayrolls

27.94k Views4.3k Discussing

StakeOnLaunchpoolToShare450KVLX

5.69k Views801 Discussing

View More