Share crypto content and earn up to 60% commissions through content mining.
placeholder
gatefun
I’m watching $btc around $78,157 here.
After that sharp drop, price managed to bounce and is now moving in a tight range just under $78,294 resistance. That tells me buyers are trying to stabilize it, but it still hasn’t fully broken out. Right now this looks more like a retest zone than a clean trend move.
Possible long setup:
Entry: $78,050 – $78,180
Targets: $78,300 → $78,800 → $79,630
SL: Below $77,500
What I’m seeing:
If BTC reclaims and holds $78,294, then the next push can extend toward $78.8K and possibly $79.6K.
But if it keeps failing below that level, then this recovery may just be
BTC0.38%
post-image
  • Reward
  • Comment
  • Repost
  • Share
#NVIDIAEarnings 🟢
Nvidia just printed another blowout quarter. Q2 revenue hit $96.2B (+106% YoY), Data Center did $89.0B (+117% YoY), and Q3 is guided to $108B. Jensen’s line: AI has reached its inflection point.
Share your view, trade NVDA, and compete for rewards.
What’s on offer:
Sign up and claim a 10 USDT voucher
Post to participate and earn extra rewards
Live streaming + copy trading available
Futures traders can share a 100,000 USDT prize pool
AI demand is still running hot. Join the conversation and trade the move.
#NVDA #NVIDIA #Earnings #AI
NVDA-4.58%
post-image
post-image
  • Reward
  • 4
  • Repost
  • Share
GateUser-0834a1ba:
To The Moon 🌕
View More
Took a spontaneous memecoin gamble w/ higher stakes than I should've on Friday night; woke up Saturday & had basically lost it all
Right back at the bottom of the hole I'd nearly dug myself out of after a bunch of costly exploits
Felt like shit all day & still hadn't shaken it this morning; got out into nature w/ the fam & felt the fog lift as things fell back into perspective
Onwards & upwards
MEME-0.17%
post-image
  • Reward
  • Comment
  • Repost
  • Share
This trend is so obvious I don’t even need to think—the account is dancing on its own. With the whole screen glowing green, $ETH was moving sideways around 2076.63 while funds were quietly flowing in. I love this kind of bottom consolidation—an instant signal to get on board. 🤘
At the time, it looked hopeless, but the chips were actually being accumulated. The longer the bottom consolidates, the harder the eventual rally. Now it’s at 2455.62, +3173.95%—this feels amazing, brothers. Those already on board should have woken up laughing.
I’m taking profits on 80% first. Secure what should be se
ETH0.70%
LAB0.71%
ADA0.00%
View Original
post-image
  • Reward
  • Comment
  • Repost
  • Share
$ENA
#ENASurgesOver15%InADay
Ethena (ENA/USDT) has moved into a much more important technical zone, with ENA currently trading near $0.16 USDT. The sharp difference from the earlier $0.275–$0.285 area means the market structure needs to be reassessed rather than simply assuming the previous bullish setup remains intact.
Live Market Statistics
Current Price: ~$0.16 USDT
Recent Reference Range: ~$0.15–$0.17 USDT
Market Capitalization: Previously around ~$1.48B during the higher-price snapshot
Circulating Supply: ~5.28B ENA
Maximum Supply: 15B ENA
At ~$0.16, ENA is trading substantially below t
ENA0.15%
post-image
Falcon_Official
#ENASurgesOver15%InADay
$ENA
ENA’s 15%+ Surge: Momentum Is Back, But Can $0.15 Hold?
Ethena’s ENA has suddenly returned to the spotlight. The token’s latest move of more than 15% in a day comes as the market reprices Ethena’s token economics and the potential connection between protocol revenue and ENA demand. With ENA around the $0.15 area, the move is no longer just about short-term momentum.
The latest catalyst is Ethena’s proposed tokenomics overhaul. The Ethena Foundation has announced changes aimed at reducing future investor-unlock pressure, while governance is considering mechanisms to direct protocol revenue toward ENA buybacks. The proposal is designed to make ENA’s value capture more directly connected to the growth of the Ethena ecosystem.
That helps explain why traders reacted so aggressively.
What the 15%+ move is really saying
ENA had spent much of its recent trading history under pressure from supply concerns. The latest announcement changes that narrative: instead of focusing only on future token releases, the market is now considering whether reduced unlock pressure plus potential buybacks could create a stronger demand/supply balance.
Recent reporting shows ENA had roughly doubled from around $0.08 to the $0.16–$0.19 region within a short period, demonstrating how quickly sentiment changed once the tokenomics story gained traction.
At approximately $0.15, however, the next move is not guaranteed.
The technical battle
The $0.15 level is now an important psychological area.
If ENA can hold above $0.15 after the initial surge, buyers could attempt to reclaim the $0.16–$0.17 zone. A sustained break above that region would indicate that the market is accepting the higher valuation rather than simply chasing the first spike.
On the other hand, losing $0.15 after such a rapid rally would signal profit-taking. The $0.14 area becomes the first downside level to monitor, followed by the $0.13–$0.135 region.
Volume is equally important. Current market data shows ENA trading with roughly $1 billion-plus in daily volume, meaning the latest move is occurring alongside substantial market participation rather than in an extremely thin market.
Bull vs Bear
Bull setup: ENA holds $0.15, volume remains elevated, and buyers push through $0.17. If the buyback proposal gains support while Ethena continues growing its underlying business, the market could continue assigning a premium to ENA.
Bear setup: The 15%+ jump attracts heavy profit-taking, ENA falls below $0.15 and volume starts accompanying selling instead of buying. In that case, $0.14 and then $0.13 become important downside tests.
There is also a key fundamental distinction: the proposed buyback mechanism is a governance proposal, not a guarantee that future ENA demand will automatically increase. The market still needs to see actual protocol growth and successful implementation.
The most interesting part of the ENA rally is not simply the percentage gain.
It is the change in the market narrative.
ENA is moving from a token heavily associated with unlock-related supply pressure toward a story involving potential revenue-based value capture and reduced future investor selling pressure. That is a meaningful shift, but the price now has to prove that the new narrative can survive after the initial excitement fades.
At $0.15, I would watch one level above everything else:
Hold $0.15 → bullish momentum remains alive.
Break $0.17 → continuation signal strengthens.
Lose $0.14 → correction risk increases.
The 15% surge got ENA back on traders’ radar. The next move will determine whether this is simply a powerful rebound or the beginning of a much larger repricing. @Gate_Square
repost-content-media
  • Reward
  • 2
  • Repost
  • Share
Venüs_:
To The Moon 🌕
View More
Good Morning Frens!🌤☕️ Happy Sunday everyone!
post-image
  • Reward
  • Comment
  • Repost
  • Share
#HYPEContinuesToHitAll-TimeHighs 1️⃣ Watch Price Action 📈
Monitor momentum and key market movements before entering a trade.
2️⃣ Track Trading Volume 📊
Strong volume can help confirm whether a move has real market participation.
3️⃣ Set Your Levels 🎯
Define your entry, target, and stop-loss before taking a position.
4️⃣ Avoid FOMO 🧠
Don’t chase sudden pumps. Wait for a setup that matches your strategy.
5️⃣ Manage Risk 🛡️
Protect your capital by controlling position size and using proper risk management.
post-image
  • Reward
  • Comment
  • Repost
  • Share
PROFIT TRADERS
gate liveLIVE
710
  • Reward
  • Comment
  • Repost
  • Share
#NVIDIAEarnings
NVIDIA Earnings: Why Inventory Turnover Matters More Than Revenue Beats for Sustainable Edge
NVDA reports Q2 revenue of $96.2B (+100% YoY) with 10 USDT vouchers + 100k USDT futures pool. But top-line growth masks distribution risk. The real edge lies in validating whether chips are being deployed by end-users or just piling up in distributor warehouses. Here’s my topology framework. 👇
🔍 Why Channel Topology Determines Long-Term Viability (Not Just Scale)
• Days Inventory Outstanding (DIO) Signals Demand Saturation: Rising DIO indicates chips are sitting unsold in the channe
post-image
post-image
  • Reward
  • Comment
  • Repost
  • Share
#EventContracts1%Reward 🎯🔥 Event Contracts: Trade Your Market Predictions!
Markets move fast — but what if you could trade your view on major events? 👀📊
With Event Contracts, you can explore market outcomes, analyze probabilities, and take positions based on your expectations.
📈 Predict market events
🧠 Analyze probabilities
⚡ Trade with a clear strategy
🎯 Turn your market outlook into action
Whether you're bullish, bearish, or simply testing your prediction skills — Event Contracts bring a new way to engage with the markets. 🚀
#EventContracts #Crypto #Trading #PredictionMarkets
post-image
  • Reward
  • Comment
  • Repost
  • Share
#TopFiveLeaguesPreMatchPredictor Top Five Leagues Pre Match Predictor ⚽️
August 27 2026 Weekend Matchday 3 Analysis 📅
We are into matchday 3 across Europe and this is where early season form starts to mean something 🏆 Champions League kicks off next week so expect rotation, tired legs, and managers protecting key players. Transfer windows are shut. Injuries are starting to show. This is my full professional preview for the Premier League, LaLiga, Bundesliga, Serie A, and Ligue 1 with probabilities, projected scores, and the context behind each pick 🔍
How The Predictor Works 🧠
Each match is
post-image
post-image
  • Reward
  • 2
  • Repost
  • Share
CryptoNyra:
LFG 🔥
View More
#WarshJacksonHolePreviewMarketsFocusOnRates
BTC/USDT Analysis After Warsh’s Speech in Jackson Hole
Technical picture at the time of writing (August 30)
BTC/USDT is trading around $78,001, up +0.33% over 24 hours. Daily range: $77,508 – $78,336.
Indicators:
· EMA5: $78,186 / EMA10: $76,813 / EMA30: $71,485 short-term moving averages are above the price, indicating resistance around $78,200.
· BOLL(20,2): upper band $85,835, middle band $71,761, lower band $57,686 the price is in the upper half of the channel.
· MACD: DIF $3,887 above DEA $3,391, histogram positive (496.6) bullish momentum i
BTC0.38%
View Original
  • Reward
  • Comment
  • Repost
  • Share
I did nothing—just went to the restroom, and when I came back, the candlestick chart had already done the work for me. {:} When I checked the chart right after lunch, $ETH buying pressure strengthened, volume gradually expanded, and support around 2086.30 was solid, so I went with the flow and opened a long position. It didn’t take long for the price to break away from my entry area and reach 2457.46, with an unrealized gain of +3093.3%. I caught the rhythm perfectly, and that bite of profit felt great. This move was purely because the market was in a good mood—it casually tossed out some gol
ETH0.70%
ZEC4.74%
BNB0.51%
View Original
post-image
  • Reward
  • Comment
  • Repost
  • Share
🚀 🚀 🚀 𝐌𝐚𝐫𝐤𝐞𝐭 𝐀𝐧𝐚𝐥𝐲𝐬𝐢𝐬 | 𝐆𝐓/𝐔𝐒𝐃𝐓
GateToken ($GT ) is consolidating near $8.15 following strong exchange net inflows and steady ecosystem accumulation. Buyers continue to hold short-term moving average support as platform trading volume expands.
📊 𝐊𝐞𝐲 𝐌𝐞𝐭𝐫𝐢𝐜𝐬
• Current Price: ~$8.15
• 24H Range: $7.85 – $8.25
• Market Bias: Moderately Bullish 🐂
📈 𝐓𝐞𝐜𝐡𝐧𝐢𝐜𝐚𝐥 𝐇𝐢𝐠𝐡𝐥𝐢𝐠𝐡𝐭𝐬
• Moving Averages: Holding firmly above 4H 20/50 EMAs ($7.85 dynamic support floor).
• Momentum (RSI): Sitting near 56 — Healthy bullish alignment with solid room for upward exp
GT3.18%
post-image
  • Reward
  • 2
  • Repost
  • Share
GateUser-0834a1ba:
LFG 🔥
View More
$BTC Signal】4H bearish continuation, target rebound short
$BTC 4H MACD green bars shortening, order-book depth imbalance -31.66%, with selling pressure concentrated. The 1H price is below the Bollinger midline, RSI 48, buy-volume ratio 0.44, and rebound strength is limited.
🎯Direction: Short (short)
⚡Entry/limit orders: 77858.573 - 78037.900 scale into shorts on the rebound
🛑Stop-loss: 78818.279
🚀Target 1: 76867.332
🚀Target 2: 76282.047
🛡️Trade management:
· Execution strategy: After reaching Target 1, reduce the position by 50% and move the stop-loss up to the breakeven point. If the pr
BTC0.38%
View Original
post-image
  • Reward
  • Comment
  • Repost
  • Share
I was just about to go to the forum and rant, but then I looked at my balance and thought, forget it—the market is always right.

During the repeated intraday swings, I noticed that every push upward fell just short, while volume completely failed to follow through—a typical weak rebound. I warned at the time not to chase $BILL this level, as the overhead resistance was too obvious, so I decisively entered a short position. Entry price: 0.07965; now 0.01989, for a +1476.55% profit. It may not be an enormous windfall, but this sense of security feels amazing.

This move wasn't luck; I got the
BILL-1.14%
LAB0.71%
BTC0.38%
View Original
post-image
  • Reward
  • Comment
  • Repost
  • Share
🔥@Sunday Free Strategy Levels👇
🔥@Long Entry Levels (second opening unit + short unit + take-profit level: see the pinned subscription post; both long- and short-term spot setups are also in the pinned post)🔥
===========
77300 long, 77000 long, Sun 75600
2415 long, 2395 long, stop loss 2345
#Strategy股价突破135美元
View Original
post-image
post-image
  • Reward
  • Comment
  • Repost
  • Share
MARKET PREDICTION
gate liveLIVE
923
  • Reward
  • Comment
  • Repost
  • Share
#NVIDIAEarnings
🔥 NVIDIA Week: AI Momentum Meets the Crypto Market
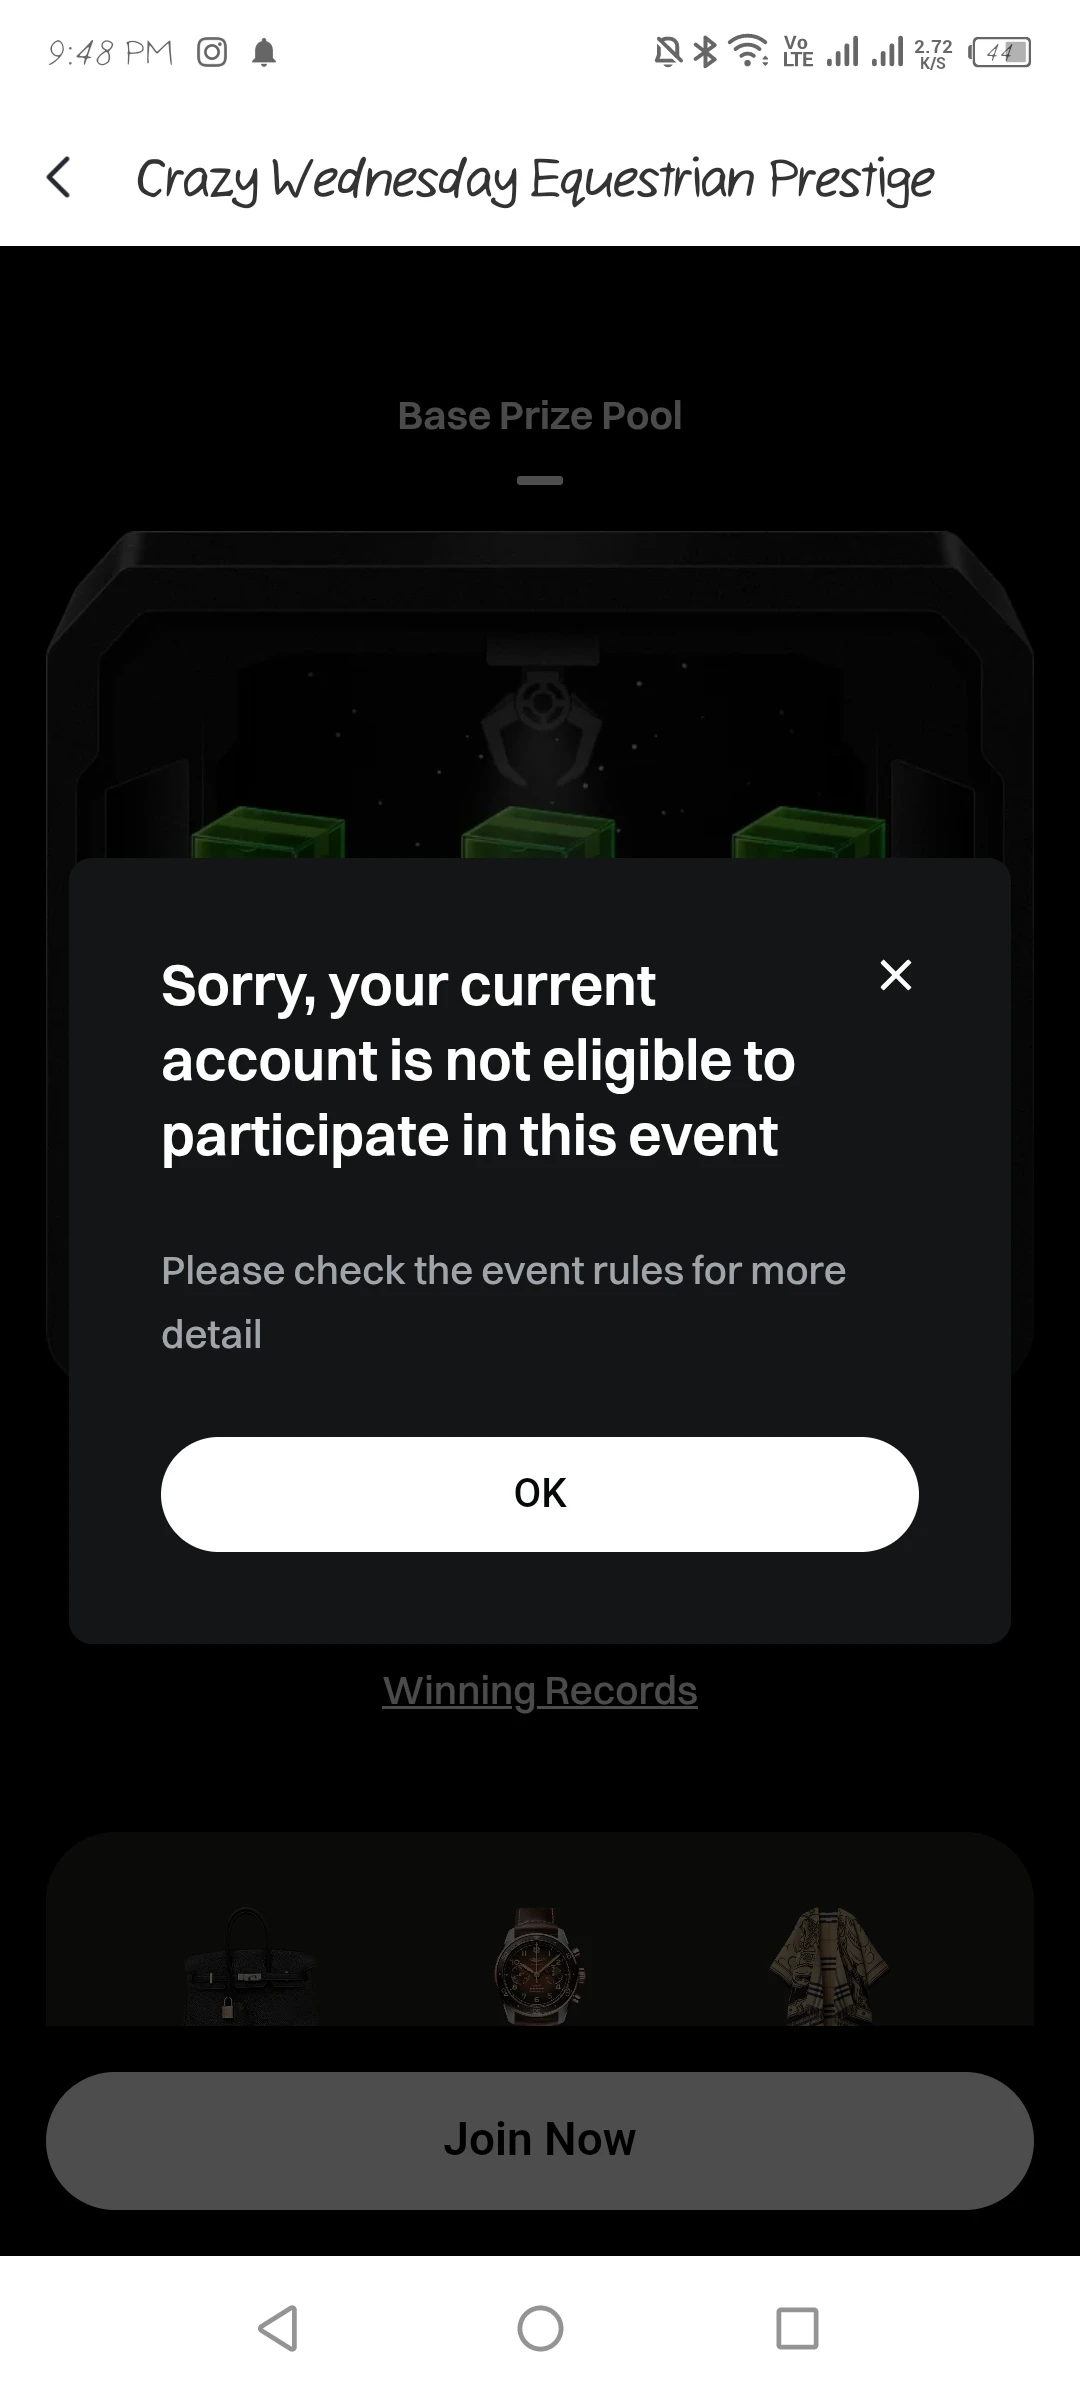
NVIDIA earnings are once again becoming one of the biggest market events for traders watching the AI and semiconductor sectors. But this week, the NVIDIA story is also getting attention in the digital-asset space through Gate’s limited-time Crazy Wednesday campaign.
The campaign runs from August 26 through August 30, 2026, giving eligible participants opportunities to enter mystery-box draws and potentially receive rewards such as NVDAG tokens, NVIDIA stock and an RTX 5090 GPU.
What makes the campaign interesting is that addi
NVDAG0.08%
NVDA-4.58%
BTC0.38%
ETH0.70%
SOL1.07%
post-image
post-image
  • Reward
  • Comment
  • Repost
  • Share
$ETH Weekend trading is sluggish, entering an accumulation phase before a major move. The probability of a short trap followed by long liquidations next week is high, but the medium- to short-term bullish structure remains unchanged.
- Intraday: Narrow-range consolidation with a bullish bias, contracting sharply within the 2430~2470 range. The short-term pullback has not yet been confirmed to have bottomed, and a false breakout designed to trap shorts is highly probable.
- ETH intraday: Resistance 2470~2490, support 2435~2420
- BTC intraday: Resistance 78500~79000, support 77300~76600
I.
ETH0.70%
View Original
post-image
post-image
  • Reward
  • Comment
  • Repost
  • Share
Load More

Join 40 M users in our growing community

⚡️ Join 40 M users in the crypto craze discussion
💬 Engage with your favorite top creators
👍 See what interests you
  • Pinned