

Share your thoughts
placeholder
Article
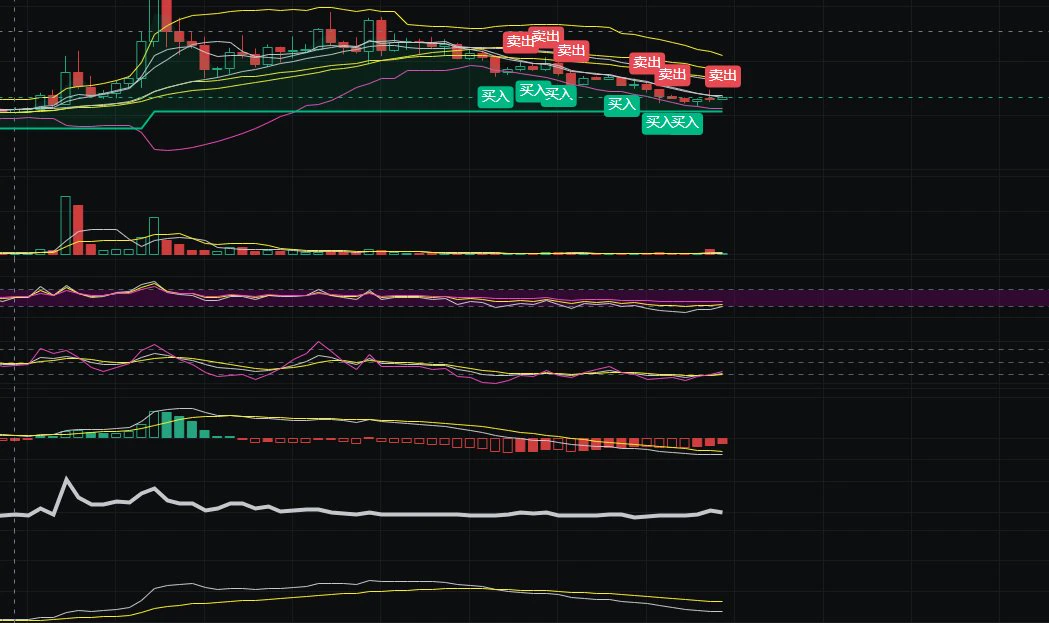
K-line: After a huge-volume long bearish candle on the 4-hour chart, the price consolidated at low levels, closing near the low, with bears in control; the daily chart shows a bearish candle with long upper and lower shadows, as bulls faced selling pressure.
· Indicators: The 4-hour MACD is about to form a death cross, RSI has fallen from overbought territory to below 50, EMA7 has crossed below EMA30, and the price has broken below EMA7/30, with the moving averages forming resistance.
· Volume: Volume has contracted significantly after the huge-volume decline, indicating insufficient buying, w
BTC+0.30%
ETH+1.21%
HK50+0.92%
$1000 to $100,000 Crypto Trade Challenge Today
live-cover
LIVE1,407
#Web3SecurityGuide
🔐 Before a Large Crypto Transfer, Stop for One Final Check
A large crypto withdrawal is not just another transaction. When the amount is significant, one small mistake can become an expensive problem. The best strategy is simple: pause, verify, and then confirm.
Start with the destination address. Never rely only on copy and paste. Carefully compare the address with the intended wallet, especially the beginning and ending characters. Then confirm the blockchain network. The receiving wallet must support the exact network you select during withdrawal. A valid wallet address
  • 3
$DOGE funds have entered, sending Dogecoin higher. Are they all betting on a rocket launching with a single Dogecoin aboard?
post-image
DOGE+6.35%
Nobody’s watching ADA while it quietly sets up a trap at 0.2191—are you the exit liquidity?

ADA/USDT - SHORT

Trade Plan:
Entry: 0.2185 – 0.2197
SL: 0.2245
TP1: 0.2150
TP2: 0.2123
TP3: 0.2083

Why this setup?
Why now?
- 4h bias is SHORT with 55% conviction, but the 1D trend is *range*, meaning this isn’t a breakout—it’s a rejection play.
- RSI 15m at 49.56 = zero momentum, so price is drifting into the kill zone (0.2185–0.2197) without buyers.
- ATR 1h (0.0023) is thin—low volatility means stop hunts are cheap. Target TP1 at 0.2150 before the real move.
- Invalid only if we lose 0.
ADA+3.67%
#晒出我的合约收益 Last night, I kept a close eye on $BULLA on Gate and decisively opened a short position, fully capturing this pullback! Watching the market move steadily downward, I decisively took profits, and the gains were quite substantial. Futures trading requires speed, precision, and decisiveness—following the trend is the key. I’ll keep it up tonight!🚀 #BULLA #Gateio #加密货币
$BULLA $GT
post-image
BULLA+195.87%
GT+10.20%
K-line pattern: The recent price rebounded sharply from the low of 62,508.3, reaching a high of 82,279.9, and currently stands at 79,874.2, consolidating at elevated levels. The latest candlestick has a relatively small body, with its upper shadow near the previous high, indicating selling pressure overhead.
· Technical indicators
· MACD: DIF (3,246.0) is below DEA (3,423.8), with a negative histogram value (-355.6). A death cross has formed, indicating weakening upward momentum and pullback pressure.
· KDJ: The K value is 87.3 and the D value is 86.9, both in the overbought zone (>80), in
AI
Which company has the best Code Arena WebDev AI model end of September?
OpenAI
76%1.32x
Anthropic
24%4.17x
$12.97K 24H+14 more
BTC+0.30%
ETH+1.21%
#Gate用户突破6000万,来
🚀 Gate Reaches 60 Million Users — A Milestone Worth Celebrating!
Gate has officially reached an incredible milestone of 60 million users worldwide!
60 million users means 60 million different journeys, experiences, trades, opportunities, and stories. Some users may remember their very first trade, while others may remember a market move that taught them an unforgettable lesson.
From taking the first step into crypto to learning how to trade, manage risk, and understand the market, every journey is unique. And behind this 60-million-user milestone are millions of individual
post-image
I originally just wanted to mooch a breakfast, but the market ended up making dumplings out of me for half a year. I opened the charts this morning, and before my eyes were even fully open, I saw the price bubbling up on its own. A few days ago, while watching the market in the early hours, $TAC had been moving sideways at the bottom. Everyone was waiting and watching. I stared at the order book for a while and saw funds entering slowly but steadily, with small orders constantly providing support at the bottom. In situations like this, I don't hesitate—I reached in and bought some around 0.002
post-image
TAC-5.19%
ZEC+1.59%
LAB+0.51%
September 6 Strategy Plan
Prioritized, for followers only
Today's operation priority ranking
Priority 1: Go long on a pullback to 2470-2473
This is today's optimal plan.
Reason: Near the 15-minute EMA50 and short-term structural support, with an easy-to-place stop-loss and the best risk-reward ratio.
Priority 2: Go long on a pullback after breaking above 2492
Suitable for a strong market.
Must wait for 15-minute candle-close confirmation; do not blindly chase highs.
Priority 3: Short on a failed push higher at 2490-2496
Suitable for a range-bound pullback.
But this is a countertrend short, so
post-image
ETH+1.21%
This time, what I think was most crucial in holding onto the $NEAR long was splitting the take-profit into several stages instead of waiting for one key level.
The entry price was around 1.8725. When it rose to the first target, I closed 30% first, instantly lowering the cost basis of the position. I set a protective stop for the remaining 70% and patiently waited for higher levels. Honestly, no one can guarantee selling at the key level. Locking in part of the profit and letting the remaining position continue to run actually makes it easier to hold the trade steadily.
There was one quick pul
post-image
NEAR-1.51%
ETH+1.21%
SOL+1.58%
Everyone’s long gold—but the 4H clock just ticked 22:56 against you.

XAU/USDT - SHORT

Trade Plan:
Entry: 4438.35 – 4441.17
SL: 4453.25
TP1: 4429.64
TP2: 4422.90
TP3: 4412.78

Why this setup?
Why now?
- XAU/USDT is range-bound on the 1D, but the 4H structure says SHORT with 55% conviction.
- RSI 15m at 55.2—not overbought, but stalling into resistance at 4439.76.
- ATR 1h at 5.62 means volatility is tight—breakouts fake, mean reversion pays.
- Entry zone 4438–4441 is the pivot; TP2 at 4422.90 is a clean 0.38% grab before the daily range traps you.

Debate:
If 4441 rejects again, a
XAU+0.08%
First signs of weakness on this massive PONS move. I think it would be good if it consolidated/pulled back here, that money flows into other tokens on RH chain and then we repeat with another leg up later.
Same as the BTC stalls > alts run loop we usually do, but RH specific.
post-image
PONS+26.57%
BTC+0.29%
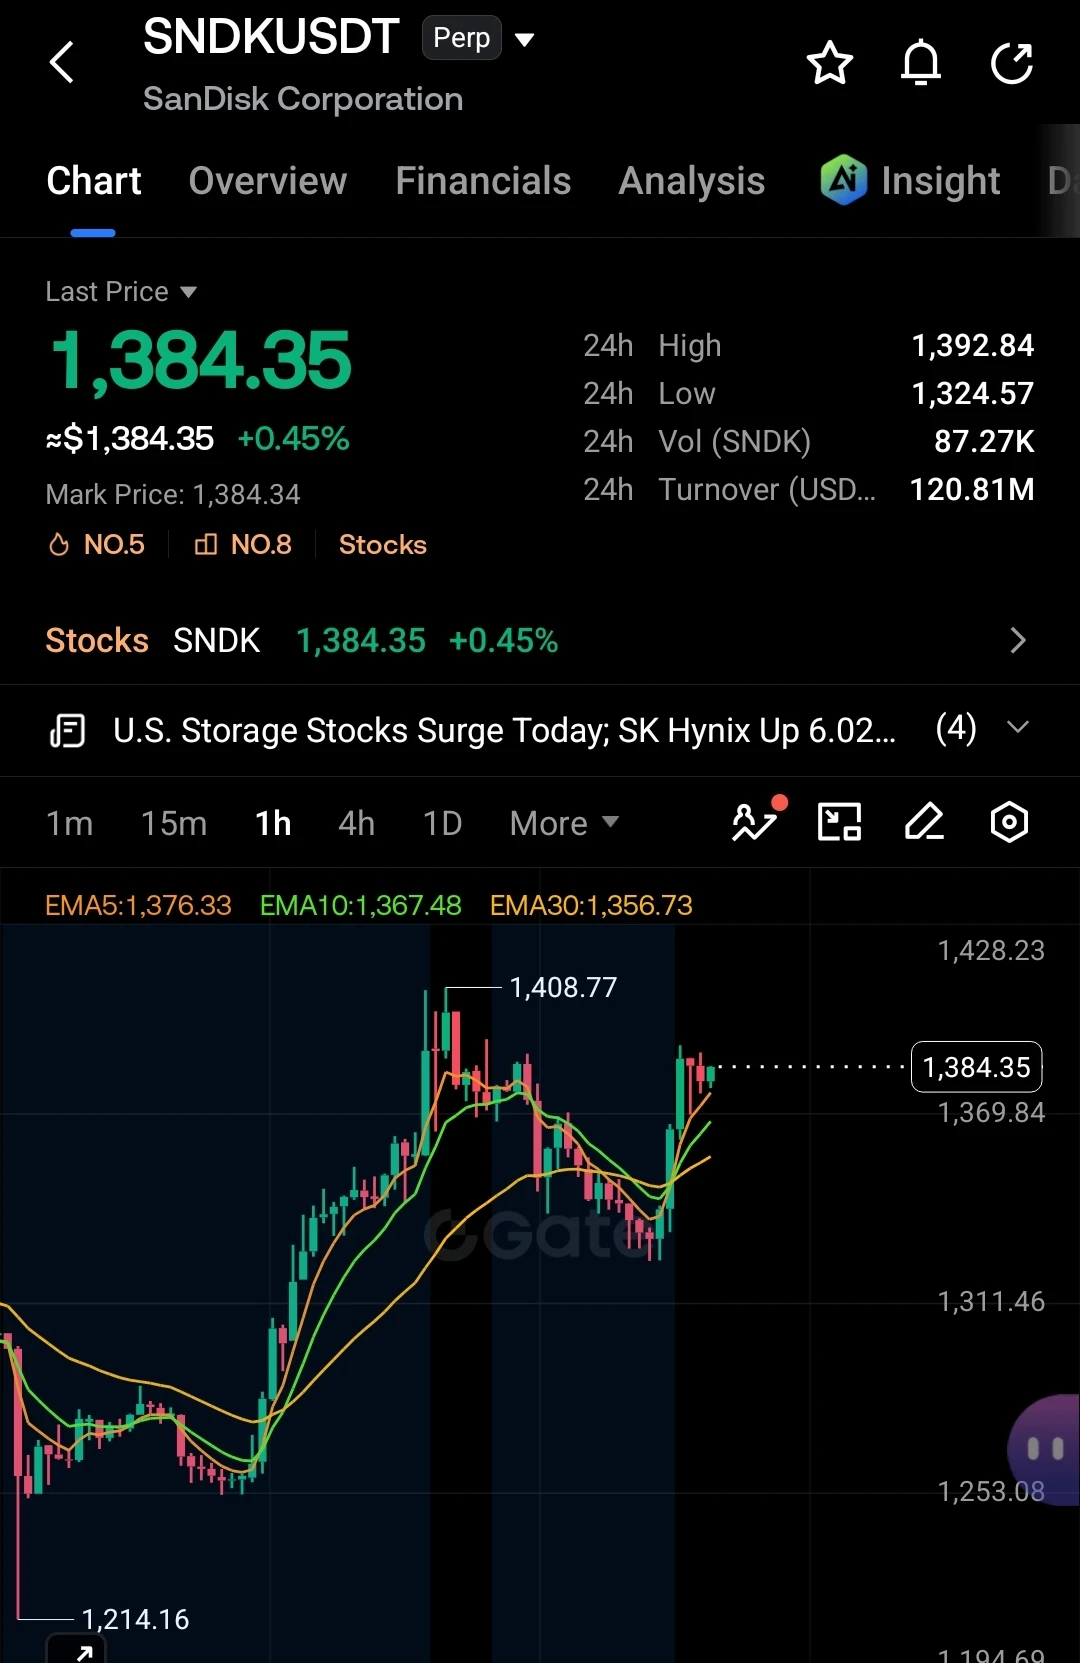
Why is everyone long MU/USDT while the 4h timeframe is screaming SHORT with 84% confidence?

MU/USDT - SHORT

Trade Plan:
Entry: 1015.27 – 1016.89
SL: 1026.20
TP1: 1008.49
TP2: 1003.43
TP3: 995.84

Why this setup?
- The 1D trend is bullish, but the 4h setup just armed a SHORT at 1016.08 — that’s a classic higher-timeframe pullback trap.
- RSI on 15m is at 47.64, showing zero momentum for a bounce — sellers are in control of the micro-move.
- ATR 1h at 3.24 means the expected move is tight, but TP1 at 1008.49 is only 0.75% away — low risk, high probability.
- Why now? The entry zone (1
MU+0.28%
Everyone is staring at Bitcoin, but $ETH /USDT is quietly setting up a trap at 2481.

$ETH /USDT - SHORT

Trade Plan:
Entry: 2478.72 – 2483.94
SL: 2506.39
TP1: 2462.53
TP2: 2450.00
TP3: 2431.21

Why this setup?
- 4H bias is SHORT with 55% confidence — not a slam dunk, but the range-bound 1D trend says don’t chase longs.
- Price is sitting right at the 2481 reference — a failed retest here is textbook for a fade.
- RSI on 15m is 54 — no overbought panic, but no momentum spike either — that’s a stall signal, not a breakout.
- Why now? The entry window (2478–2483) is active, and TP1 at 2
ETH+1.21%
No big-picture thinking, can't hold, the profits on this move are paper-thin, but I absolutely love it. $LIT quietly made a move like this, and thankfully I wasn't shaken out.
When I checked the charts after lunch, I watched the pullback level and felt that it couldn't drop any further. The volume had also dried up, as if it were building strength. So I added to my position around 3.753, and the price has now reached 4.757, with unrealized gains already hitting +1287.96%. It was truly sluggish at first, but the move is truly sweet now. I can afford a good meal.
Don't let profits inflate your e
post-image
LIT-2.24%
DOGE+6.34%
BTC+0.30%
A few days ago, $ARB broke out on heavy volume and held above the moving averages. I reminded myself not to hesitate and added to my long position with the trend. But the wicks early in the breakout were genuinely frightening, and my unrealized profit briefly shrank by more than half.
After the price strengthened again, I closed 70% of the position first and placed a trailing stop on the remaining 30%. Some people prefer to exit all at once, but taking profits in batches suits me better. Even if the price continues to surge on momentum later, I still have a position to participate with and won
post-image
ARB+41.58%
ZEC+1.59%
BNB+6.59%
Everyone’s staring at NEAR’s breakout, but the 15m RSI says you’re already late to the quiet part.

$NEAR /USDT - LONG

Trade Plan:
Entry: 2.1736 – 2.1968
SL: 2.0737
TP1: 2.2688
TP2: 2.3246
TP3: 2.4082

Why this setup?
- 4h structure is screaming LONG at 95% confidence, anchored at 2.1852 while the daily trend stays bullish.
- The pullback zone (2.1736–2.1968) is where wallets get filled—not after TP1 prints.
- RSI 15m at 45.64 means room to run before overbought, and ATR 0.0465 gives you a tight 4.5% stop buffer to 2.0737.
- Why now? Because waiting for TP3 (2.4082) is a luxury only
NEAR-1.51%
I didn’t enter immediately during the first wave of decline because after this kind of rapid sell-off, there is often an exaggerated rebound, and chasing shorts can easily result in getting stopped out badly. So at the time, I only marked a key zone at the highs and didn’t rush to act. The price did rebound afterward as expected, but near the key zone, it failed to show the rebound strength it should have had, with each lower-timeframe candlestick weaker than the last. Only then did I enter short in the direction of the decline. Since the entry was relatively close to the key zone, setting the
post-image
ETH+1.21%
BNB+6.59%
Load More

Join 40 M users in our growing community

⚡️ Join 40 M users in the crypto craze discussion

💬 Engage with your favorite top creators

👍 See what interests you

View More