Square
Following
Hot
News
Notifications
Profile
Share your thoughts
placeholder
Article
🔹 Following the release of the non-farm payrolls data, the probability of a Fed rate hike in Decemb
live-cover
LIVE2,013
📣 November 6 Daily Top Posts: Good insights deserve to be seen
When will heavy AI investment deliver returns? Does an index rebound mean the market is strengthening? After making a bad trading call, how should you reassess your thinking?
These 8 posts cover everything from market analysis to trading reflections. Let’s take a look at what creators are observing👇
🔹 @赚钱吃肉肉: Ongoing AI investment: Can profits and cash flow keep up?
https://www.gate.com/zh/post/status/curated/25443255
🔹 @龙抄手: Rebound or reversal? A video anal
GateSquare
📣 November 6 Daily Top Posts: Good insights deserve to be seen
When will heavy AI investment deliver returns? Does an index rebound mean the market is strengthening? After making a bad trading call, how should you reassess your thinking?
These 8 posts cover everything from market analysis to trading reflections. Let’s take a look at what creators are observing👇
🔹 @赚钱吃肉肉: Ongoing AI investment: Can profits and cash flow keep up?
https://www.gate.com/zh/post/status/curated/25443255
🔹 @龙抄手: Rebound or reversal? A video analysis of BTC / ETH
https://www.gate.com/zh/post/status/25417274
🔹 @币靠普: Beyond the AI growth story, what else are investors watching?
https://www.gate.com/zh/post/status/curated/25443260
🔹 @云享财富讲堂: Tech stocks under pressure: What else needs to be confirmed before the Nasdaq rebound?
https://www.gate.com/zh/post/status/25442782
🔹 @山顶Ryak: Understanding PoSEC and asset verification from the user’s perspective
https://www.gate.com/zh/post/status/25427269
🔹 @阿炼CryptoView: BTC / ETH strength and key levels after the pullback
https://www.gate.com/zh/post/status/25443539
🔹 @初心实盘: After a trading mistake with SanDisk, reassessing mindset and judgment
https://www.gate.com/zh/post/status/25433936
🔹 @分析师Ansem: How do news events affect market sentiment and short-term volatility?
https://www.gate.com/zh/post/status/curated/25437719
🎁 Selected authors receive 3 days of traffic support + featured content
💬 Which post gave you a new perspective?
Visit the original post to share your questions, additions, or differing views. You’re also welcome to recommend yourself or others for great content in the comments.
The next top post might be yours.
The author’s views are for reference only and do not constitute investment advice or a promise of returns.
‍#每日神贴 #Gate Square
repost-content-media
BTC-0.67%
ETH-1.26%
NDAQ+0.28%
INDEX+0.00%
Trenches
ZIG
Z
bade
b
ZIG
0x8c...1145
Market Cap
$.
Change
.
24h Vol
$.
Holders
.
BTC
B
bade
b
BTC
C5xp...pump
Market Cap
$.
Change
.
24h Vol
$.
Holders
.
GM
G
bade
b
GM
0x13...7777
Market Cap
$.
Change
.
24h Vol
$.
Holders
.
Diamond
D
bade
b
Diamond
5VCE...pump
Market Cap
$.
Change
.
24h Vol
$.
Holders
.
STONK
S
bade
b
STONK
6GmA...UNgx
Market Cap
$.
Change
.
24h Vol
$.
Holders
.
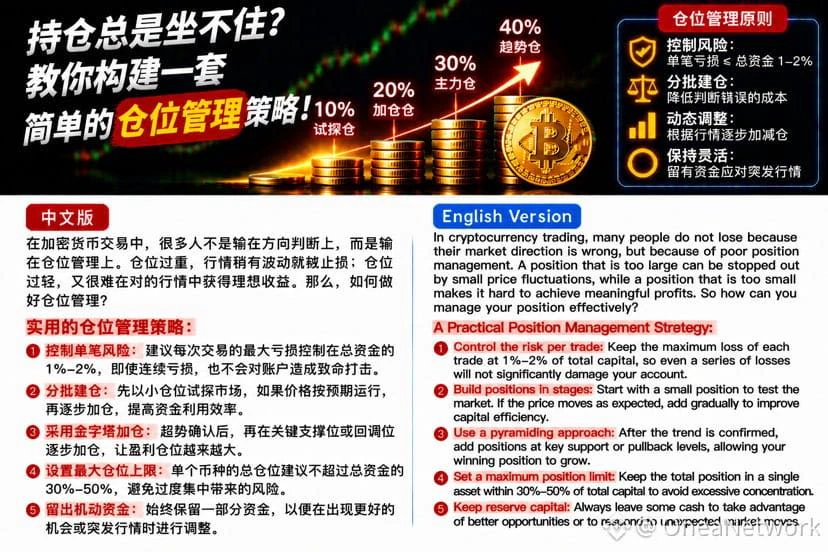
In cryptocurrency trading, many people believe that as long as they can accurately predict whether BTC will rise or fall, they can consistently make a profit. But reality is often the opposite: some traders have a fairly high win rate, yet their accounts never grow consistently. The problem may not be their directional calls, but their position sizing.
Why is position sizing so important?
First, oversized positions can magnify losses. If BTC drops 2%, a trader with a small position may experience only normal volatility, while a heavily positioned trader using high leverage could suffer serious
post-image
BTC-0.65%
What is maximum drawdown? Why doesn’t an asset’s eventual recovery mean that holding it involved no major risk?

In the cryptocurrency market, some traders assess an investment this way: “It eventually went back up, so I just needed to hold on.”

But this view overlooks an important question: How much did the asset fall before recovering? Could the account withstand this drawdown? If leverage was used, could the position have been liquidated before the recovery?

To answer these questions, we need to understand Maximum Drawdown (MDD).

First, what is maximum drawdown?

Maximum drawdown measure
post-image
"Holy shit Ansem just aped my token"
post-image
TOKEN-0.16%
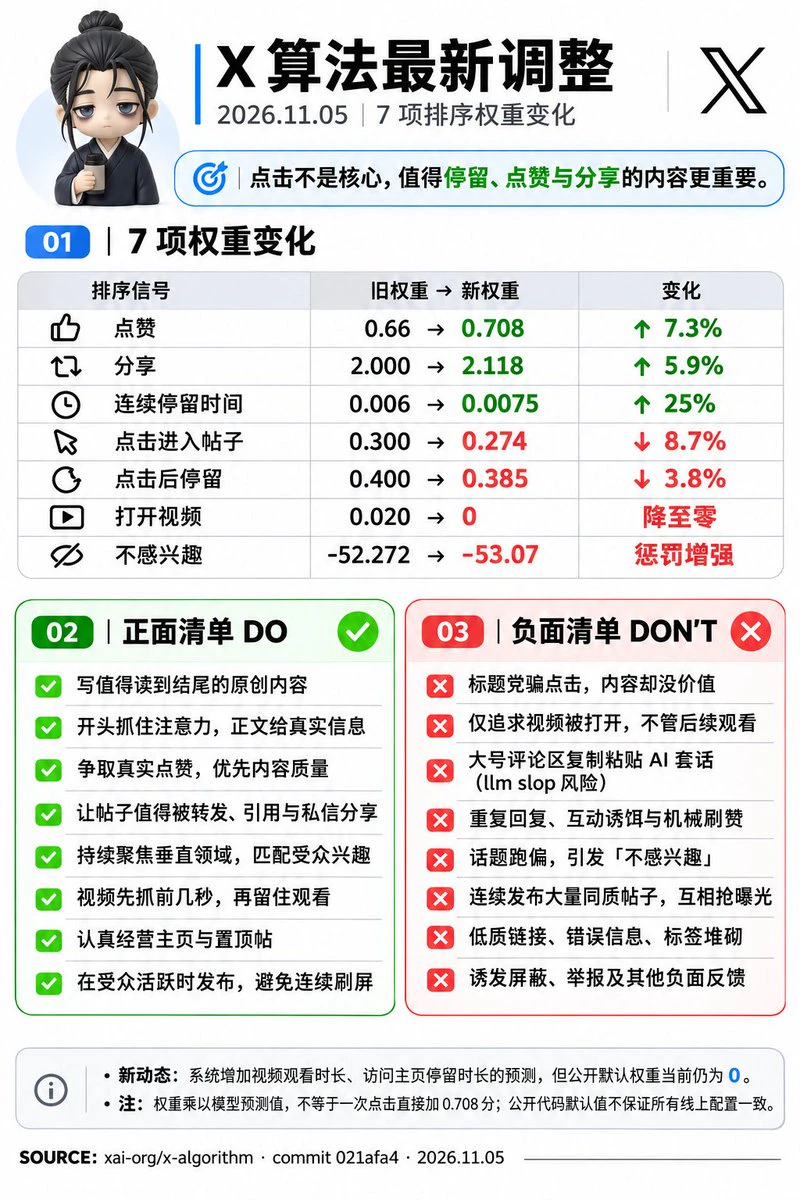
X is increasingly prioritizing whether readers are willing to stop and read, and whether they like a post after finishing it. For smaller accounts, getting the first people who see a post to feel it’s worth reading matters more than simply attracting clicks.

The changes mainly include a few points:
1. The weight for likes rose from 0.66 to 0.708, and the weight for dwell time rose from 0.006 to 0.0075. The weight for clicking into a post fell slightly, while the weight for simply opening a video dropped to 0.
2. The first two hours after a new post is published, and its first 200 views, remai
post-image
#USAIStocksHitHard #ShareWeekly
U.S. AI stocks have faced intense selling pressure, with sharp share-price declines driven by profit-taking, valuation concerns, and fresh uncertainty over data-center expansion. This analysis covers the seven points in detail, drawing on the major market moves of early November 2026 (particularly the heavy session around November 5), when the Nasdaq Composite fell into correction territory and trillions in market value were erased.​

1. Heavy losses for U.S. AI-related companies
U.S. companies most tightly linked to artificial intelligence infrastructure and c
BTC | ETH | Gold | Crude Oil
live-cover
LIVE3,926
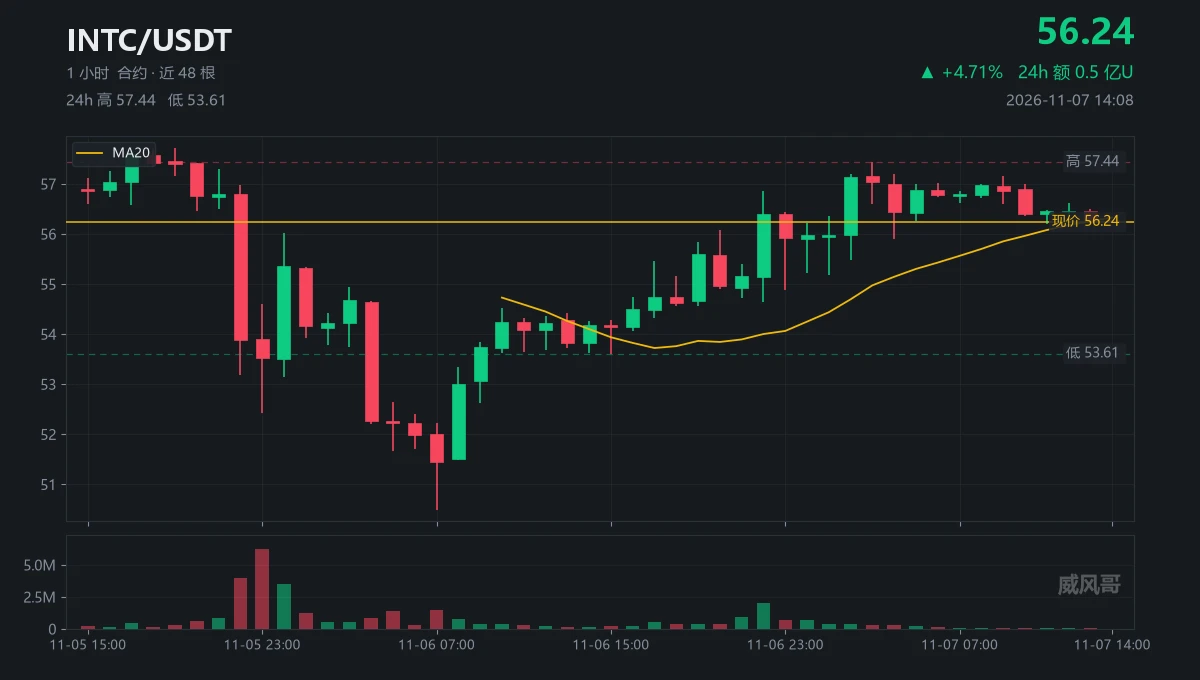
In trader jargon, it’s called a V-reversal—in plain terms, it fills the hole right back in.
From 50.49 to 57.44, up 13.8% in two days—the hole is filled.
57.44 The high was hit at 03:00; it hasn’t been touched again in the eleven hours since.
56.25 Current price, 2.1% below the high.
2,022,283 Volume on the 22:00 candle, 5.2 times the average; it was the only candle with any volume all day.
3,612 Volume at 14:00, 0.9% of average; the weekend order book has only this much left.
-0.0054% Funding rate; shorts are paying, but the pool is thin, so they’re not paying much.
56.33 MA20; price is stuck
post-image
INTC+0.05%
  • 1
🌅 GOOD MORNING, FRIENDS
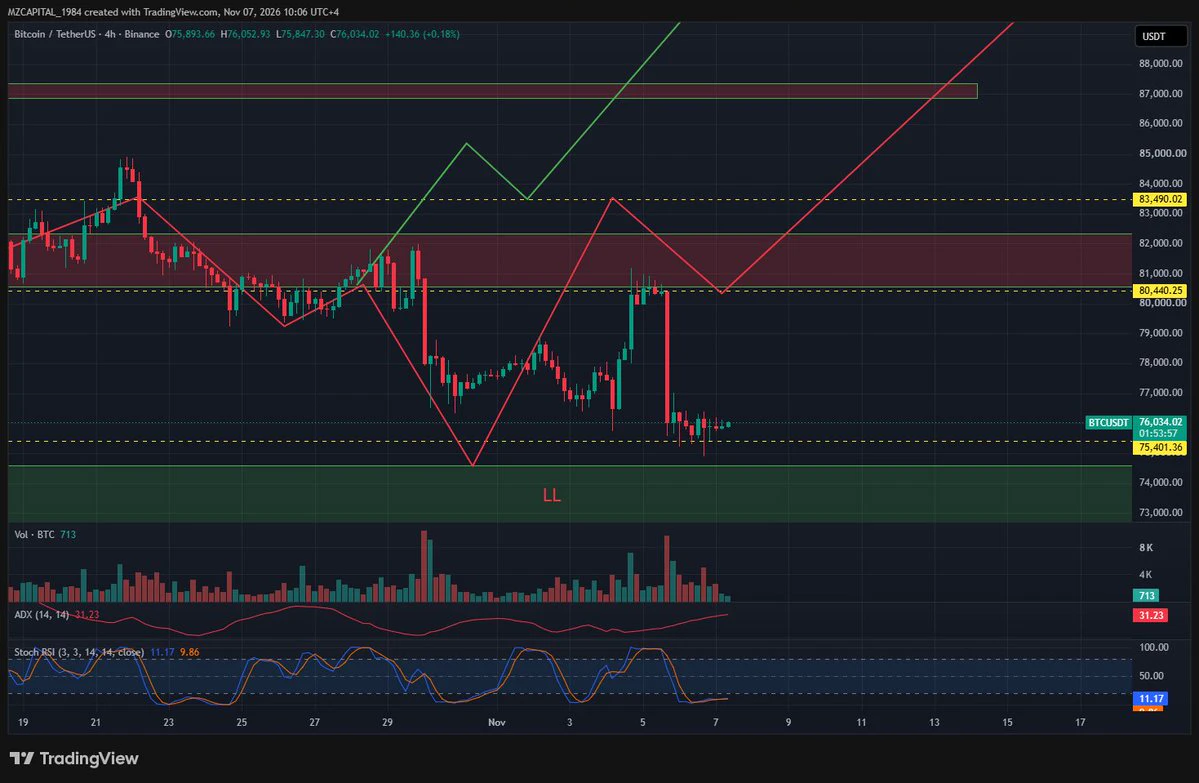
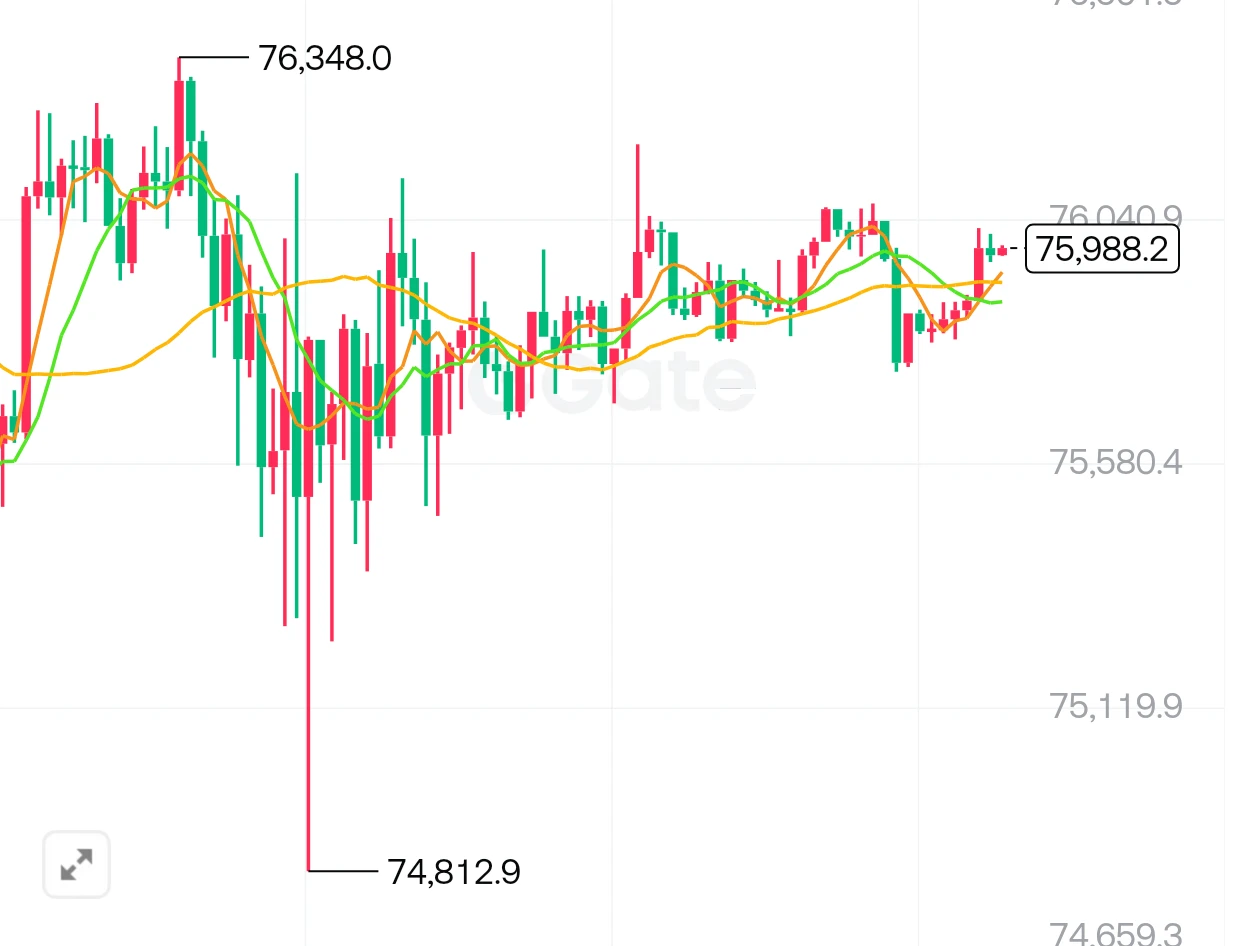
Yesterday, after US markets opened, what mattered for $BTC was how the price behaved despite strong NFP data.
NFP came in at 165K. Expectations were 65K. The unemployment rate fell to 4.1%.
In the initial reaction, the 10-year US Treasury yield rose to 4.88%, and $BTC pulled back to the 74.9K area.
But the selling did not continue.
$BTC returned to the 75–76K area and held there for the rest of the US session.
More importantly, Nasdaq rose 1.1% yesterday, while the S&P 500 gained 0.31%. The Dow fell 0.46%.
So, after Thursday’s sharp risk-off move, we saw a partial r
post-image
BTC-0.67%
What Is the Risk-Reward Ratio? Why Can a High-Win-Rate Trading Strategy Still Lose Money Over Time?

In cryptocurrency trading, some traders place great importance on their win rate. They want to win at least seven out of ten trades, believing that as long as they make the right call often enough, they can keep making money.

But actual trading results depend not only on how many times you win, but also on how much you make on each winning trade, how much you lose on each losing trade, and how high your trading costs are.

That is why the risk-reward ratio and win rate must be analyzed togethe
post-image
#WCTCS9 #$ZEC
#ShareWeekly
Current ZEC Price: $1,347 USDT
ZEC is approaching an important technical decision point. After maintaining strong interest from buyers, the market is now testing whether bullish momentum can continue or whether sellers will create another correction. My focus is on daily price structure, weekly momentum, support and resistance levels, trading volume, and risk management.

1. One-Day Chart Pattern (1D)
On the 1-day timeframe, ZEC is showing a recovery structure, but the market still needs a confirmed breakout to establish stronger bullish momentum. The $1,349–$1,356
AMD+11.55%
When AI Giants Sneeze, Crypto Catches a Cold! What’s Next for the Crypto Market?

AI tech stocks plunged, and the crypto market came under pressure too. This market move has made many investors realize that their portfolios may look diversified, but in reality, they could all be on the same risk-laden boat.
AI stocks, the Nasdaq, BTC, and ETH are different assets, but when liquidity is abundant and risk appetite is strong, investors may chase them all at once. Once market sentiment turns cold, these assets may also pull back in tandem.
So what should we watch next?
First, see whether tech stoc
NAS100+1.90%
BTC-0.67%
ETH-1.26%
  • 31
#美股史诗级抛售 #Gate股票畅聊季 #每周来晒 The “Deleveraging” Moment in U.S. AI Stocks: A 1998 Replay Without Fed Rate Cuts to the Rescue!

This article analyzes the plunge in U.S. AI stocks and the wave of programmatic selling: at the market-structure level, leveraged ETFs and dealers’ negative Gamma triggered a mechanical selloff; at the valuation level, uncertainty over capex and returns created a rift; and at the macro level, the Fed was absent as a backstop through rate cuts. It examines whether the AI trade is replaying the 1998 LTCM crisis or heading toward a 2000-style bubble.

As buyers of AI computin
BUBBLE-2.35%
NDAQ+0.28%
SPX500+0.19%
NVDA+2.80%
CSCO-2.05%
11.7 Market Analysis

Bitcoin Strategy Reference Setup
Entry zone: Short around 76200—76900
Stop loss: 77600
First target: 75000, second target: 74200

No one expected the nonfarm payrolls report to come in so surprisingly strong!
October’s nonfarm data massively beat expectations across the board: 165,000 jobs were added, far above market expectations of 59,000–65,000; unemployment fell to 4.1%, hourly wages rose 0.4% month over month, and even the previous two months’ figures were revised upward—a full three-month streak of hot data.

This scorching report pushed market bets on a Fed rate h
post-image
BTC-0.65%
ETH-1.23%
  • 1
ARIA | Long 🟢 | Bullish | 15-minute 24-hour: +12.83% | Volume: 35.5M USDT. Long rationale: Price above EMA200; EMA20/50/200 in bullish alignment; RSI14 at 67.8; MACD histogram positive; ADX14 at 21.8; volume is 1.44 times the 20-candle average; breakout from the 20-candle range. Entry: 0.15503 Stop-loss: 0.143574 Take-profit 1: 0.16935 | Take-profit 2: 0.177942 | Take-profit 3: 0.189399Entry price is for reference only; do not chase. The strategy is invalidated if the stop-loss level is hit. Technical analysis strategy only; not investment advice. $ARIA
post-image
ARIA+22.03%
🚀 $XFS – More Than a Meme? 🐿️🔥
StockFi + Tokenized Stocks + BNB Chain = Interesting combination!
📈 +28.6% in 24H
💧 Liquidity: $394.46K
👥 Holders: 12.39K
⚠️ Top 10 holders own 41.23% of supply.
Can $XFS deliver real growth? 👀
#XFS #StockFi #BNBChain
post-image
BNB-0.76%
You can tell from the way they talk that they’re a kid born after 2005. Straight to the point, but always dreaming up ridiculous fantasies.
post-image
Went out and unexpectedly ran into Lord Hun
#影之刃零 Should be the hottest game right now, right
Load More

Join 40 M users in our growing community

⚡️ Join 40 M users in the crypto craze discussion

💬 Engage with your favorite top creators

👍 See what interests you

Trending Topics

USAIStocksHitHard

15.28k Views3.64k Discussing

U.S. stocks sold off sharply on Thursday, November 5 (UTC). The Nasdaq closed down around 5.5%, entering correction territory, while the Philadelphia Semiconductor Index plunged roughly 12%, with chip stocks including $NVDA and $AMD posting steep losses. Beyond profit-taking, investors are growing concerned about the pace of AI data center construction, capital spending, and future returns on investment. The key question now is whether the AI sector’s lofty growth expectations need to be repriced. Where do you think the next opportunities will emerge: chip stocks, tech giants, or other sectors?

USNonfarmPayrolls

22.89k Views4.25k Discussing

StakeOnLaunchpoolToShare450KVLX

2.02k Views773 Discussing

View More