











#GateWCTCS9GlobalTradingCompetition
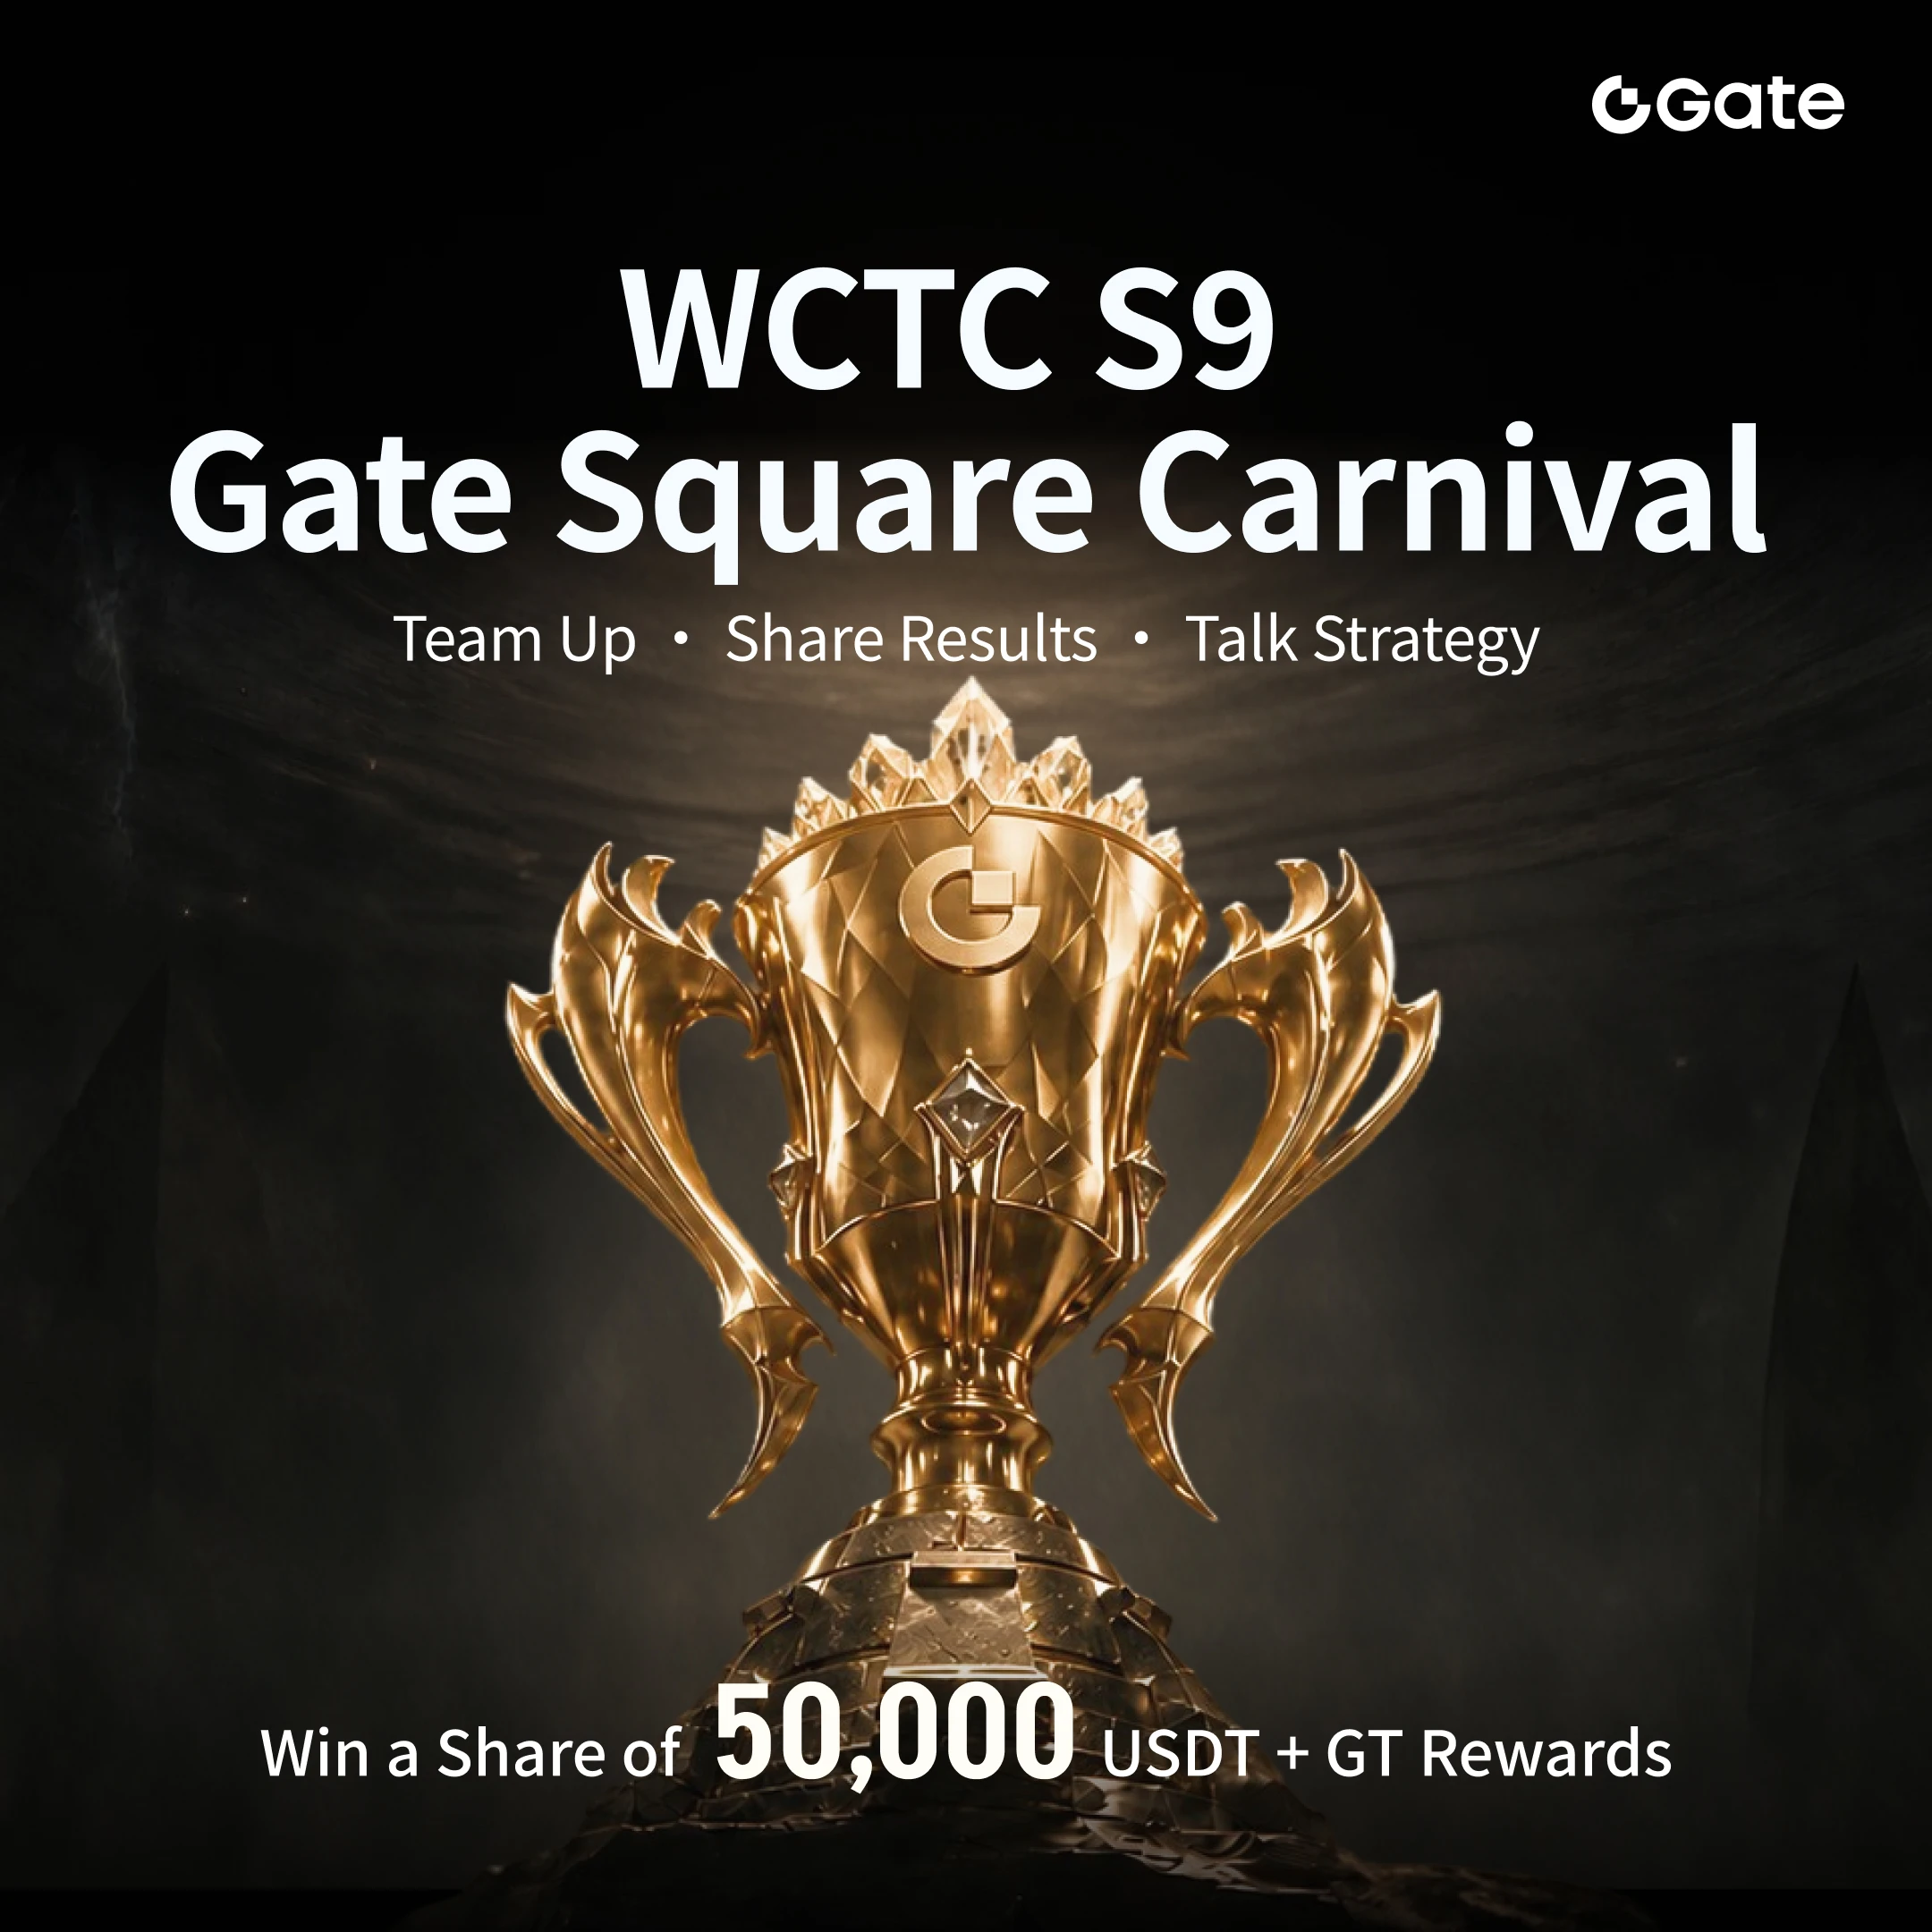
Gate WCTCS9 Global Trading Competition: Where Strategy Meets Opportunity!
The global crypto market is full of opportunities, but successful trading requires more than luck. It demands discipline, market knowledge, risk management, and the ability to make decisions under pressure. The Gate WCTCS9 Global Trading Competition brings these qualities into focus, creating an exciting environment for traders who want to challenge themselves and improve their trading skills.
🌍 Compete on a Global Stage
The WCTCS9 competition highlights the competitive spirit of the crypto community, bringing traders together around market analysis, trading strategies, and performance. Whether the market is bullish, bearish, or moving sideways, participants must evaluate opportunities carefully and adapt to changing conditions.
📊 Strategy Is the Real Advantage
Successful traders do not simply follow market hype. They study price movements, monitor trading volume, identify important support and resistance levels, and evaluate market sentiment before entering a position. A well-planned strategy can help traders navigate volatility more effectively.
🔐 Risk Management Comes First
Crypto trading offers opportunities, but it also carries significant risks. Rapid price movements can create losses just as quickly as profits. Setting clear entry and exit levels, managing position sizes, and avoiding excessive leverage are essential practices for responsible trading.
🚀 Why WCTCS9 Matters
Global trading competitions encourage participants to test their strategies, learn from market movements, and develop stronger decision-making habits. They also bring greater attention to the evolving digital asset ecosystem and the role of trading platforms in connecting global crypto communities.
Before participating, traders should review the official competition rules, eligibility requirements, campaign dates, ranking methodology, and reward distribution details on Gate. Rewards and participation conditions may vary according to the official terms.
My Perspective: The strongest trader is not necessarily the one who takes the biggest risks, but the one who combines patience, preparation, and consistency. WCTCS9 is an opportunity to put strategy to the test while keeping capital protection at the center of every decision.
🔥 Trade smart, stay disciplined, and let your strategy speak for itself!
#GateWCTCS9GlobalTradingCompetition #Gateio
Gate WCTCS9 Global Trading Competition: Where Strategy Meets Opportunity!
The global crypto market is full of opportunities, but successful trading requires more than luck. It demands discipline, market knowledge, risk management, and the ability to make decisions under pressure. The Gate WCTCS9 Global Trading Competition brings these qualities into focus, creating an exciting environment for traders who want to challenge themselves and improve their trading skills.
🌍 Compete on a Global Stage
The WCTCS9 competition highlights the competitive spirit of the crypto community, bringing traders together around market analysis, trading strategies, and performance. Whether the market is bullish, bearish, or moving sideways, participants must evaluate opportunities carefully and adapt to changing conditions.
📊 Strategy Is the Real Advantage
Successful traders do not simply follow market hype. They study price movements, monitor trading volume, identify important support and resistance levels, and evaluate market sentiment before entering a position. A well-planned strategy can help traders navigate volatility more effectively.
🔐 Risk Management Comes First
Crypto trading offers opportunities, but it also carries significant risks. Rapid price movements can create losses just as quickly as profits. Setting clear entry and exit levels, managing position sizes, and avoiding excessive leverage are essential practices for responsible trading.
🚀 Why WCTCS9 Matters
Global trading competitions encourage participants to test their strategies, learn from market movements, and develop stronger decision-making habits. They also bring greater attention to the evolving digital asset ecosystem and the role of trading platforms in connecting global crypto communities.
Before participating, traders should review the official competition rules, eligibility requirements, campaign dates, ranking methodology, and reward distribution details on Gate. Rewards and participation conditions may vary according to the official terms.
My Perspective: The strongest trader is not necessarily the one who takes the biggest risks, but the one who combines patience, preparation, and consistency. WCTCS9 is an opportunity to put strategy to the test while keeping capital protection at the center of every decision.
🔥 Trade smart, stay disciplined, and let your strategy speak for itself!
#GateWCTCS9GlobalTradingCompetition #Gateio