
Square
Following
Hot
News
Notifications
Profile
Share your thoughts
placeholder
Article
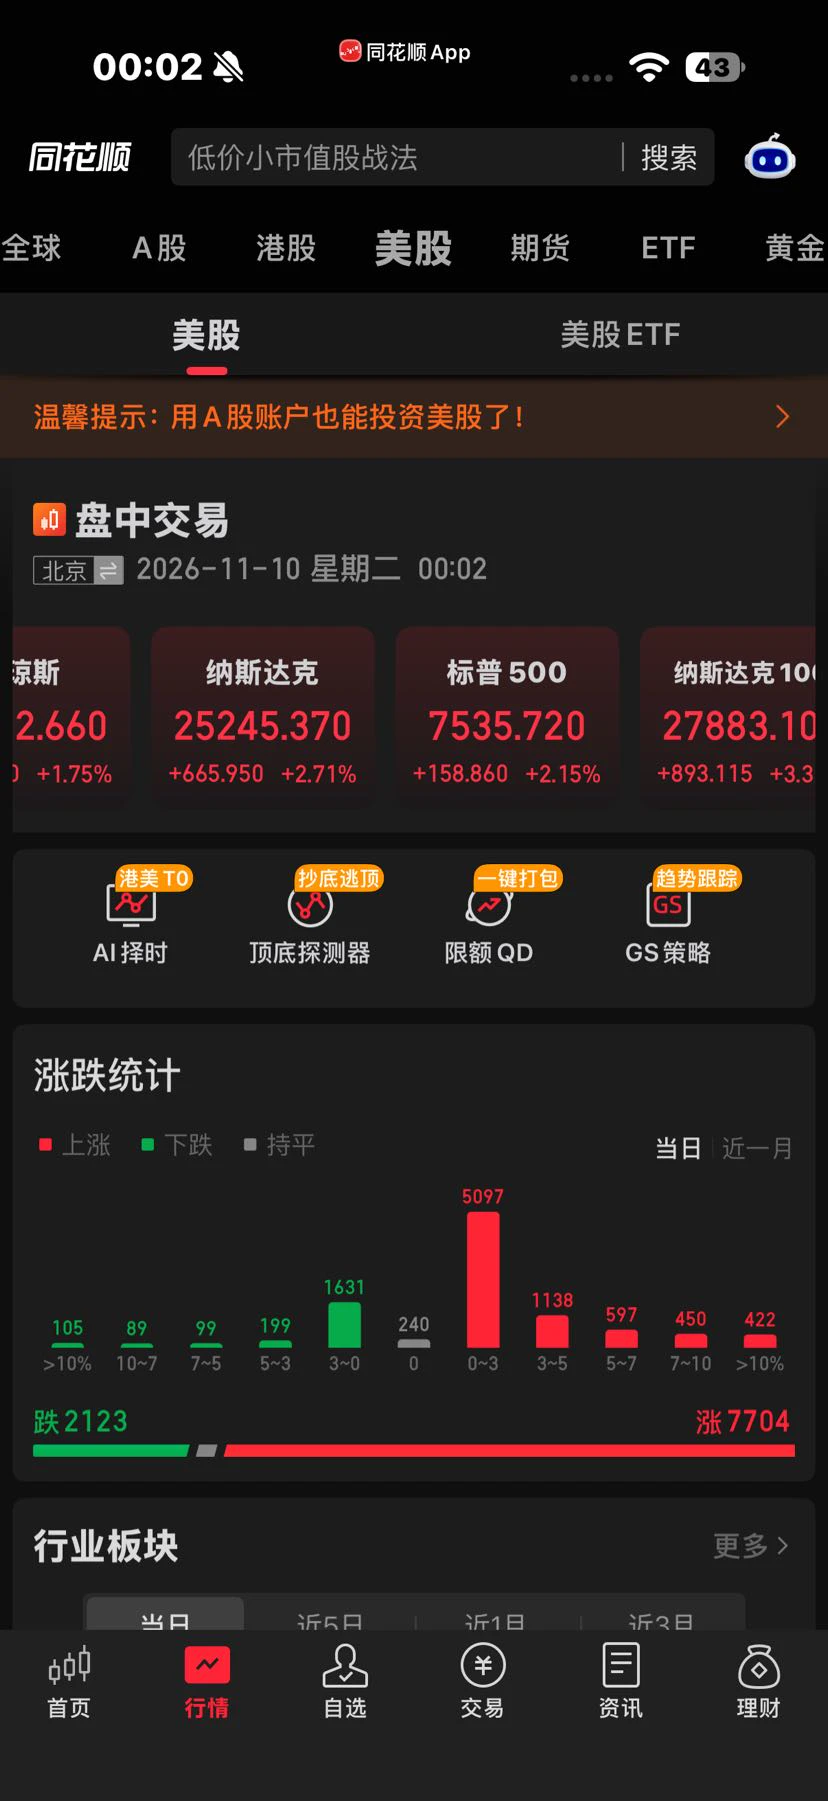
U.S. stocks continue to surge, with the crypto market following modestly#Gate24小时净流入全球第三
post-image
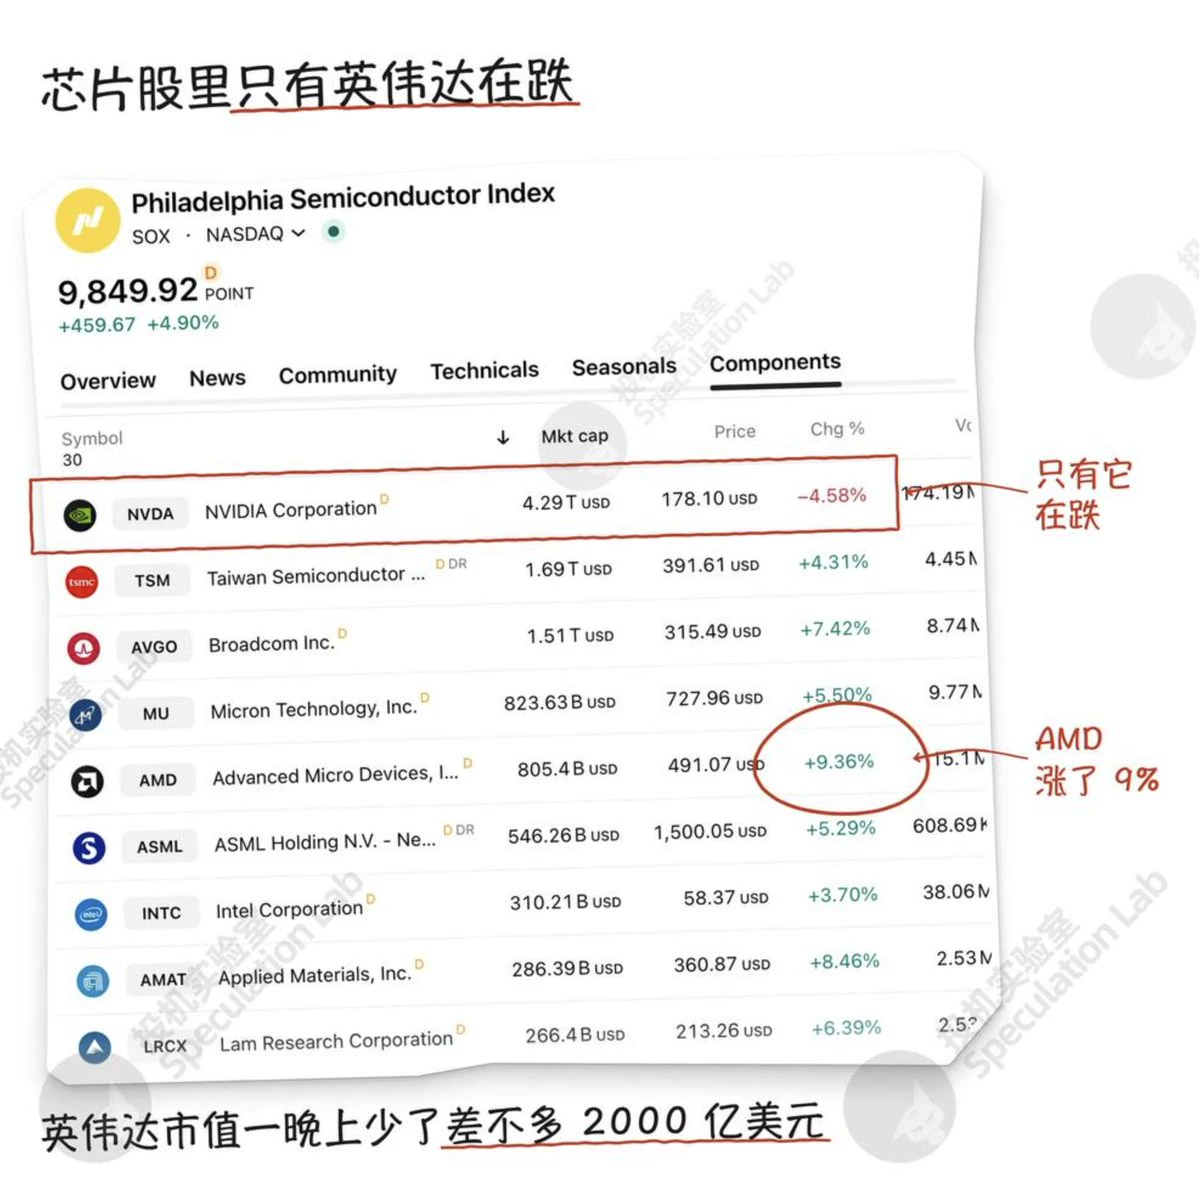
Of the 30 stocks in the U.S. chip ETF, 29 rose tonight, with Nvidia the only one to fall😂
Astera Labs rose the most, gaining 12%, while AMD rose 9%.
Nvidia fell more than 4%, losing nearly $200 billion in market cap overnight, while AMD gained nearly $70 billion.
The Nasdaq also rose 2.7%. Money didn’t leave chips; it just moved from Nvidia to other names.
post-image
NVDA-5.72%
ALAB+14.15%
AMD+11.60%
NAS100-0.07%
Trenches
牛逼
牛
bade
b
牛逼
0x96...7777
Market Cap
$.
Change
.
24h Vol
$.
Holders
.
BTC
B
bade
b
BTC
C5xp...pump
Market Cap
$.
Change
.
24h Vol
$.
Holders
.
STONK
S
bade
b
STONK
6GmA...UNgx
Market Cap
$.
Change
.
24h Vol
$.
Holders
.
ANSEM
A
bade
b
ANSEM
9cRC...pump
Market Cap
$.
Change
.
24h Vol
$.
Holders
.
PUSSY
P
bade
b
PUSSY
FZxH...Loat
Market Cap
$.
Change
.
24h Vol
$.
Holders
.
How long does a strategy need to run before it can be considered truly effective?
Many people develop a strategy, backtest it for three days, then put it into live trading and increase their position after two profitable weeks. Then it crashes in the third week, and they say, “The strategy doesn’t work.”
The problem isn’t the strategy; it’s the insufficient sample size.
First, remember a few numbers:
30 trades — the minimum threshold. With fewer than 30 trades, you can’t tell whether the method works or you just got lucky. This sample size can only rule out methods that are “obviously terrible
post-image
BTC-0.65%
Eshu Live_Over all btc,eth&sol crypto market updates
live-cover
LIVE3,377
Whoa, you can even hand stock analysis over to AI now?!
It automatically pulls market data, analyzes news, and generates stock reports. Trend scores, buy/sell points, and risk alerts—all at a glance.
Supports China A-shares, Hong Kong stocks, and U.S. stocks, and can send scheduled updates to Telegram and Feishu.
If you’re interested in U.S. stocks, I highly recommend bookmarking this! It already has 68K+ stars on GitHub!!!
post-image
Couldn't sleep and made another $15. If only Ethereum were this easy too!
post-image
ETH-1.26%
Went long on BTC around 74,500, capturing nearly 1,000 points at the peak! Today, both longs and shorts got wiped out, and the 20,000U mini-target is in the bag.

This wasn’t a case of chasing the rally after seeing prices rise. I had already spotted support below and shared the long setup while the market was still hesitant.

A brother asked if he could enter, and my answer was clear: follow the signal, set your stop-loss, and target around 75,500. The price then climbed all the way to around 75,510 at its peak, moving almost exactly as anticipated.

Real judgment means daring to position you
BTC-0.65%
ETH-1.23%
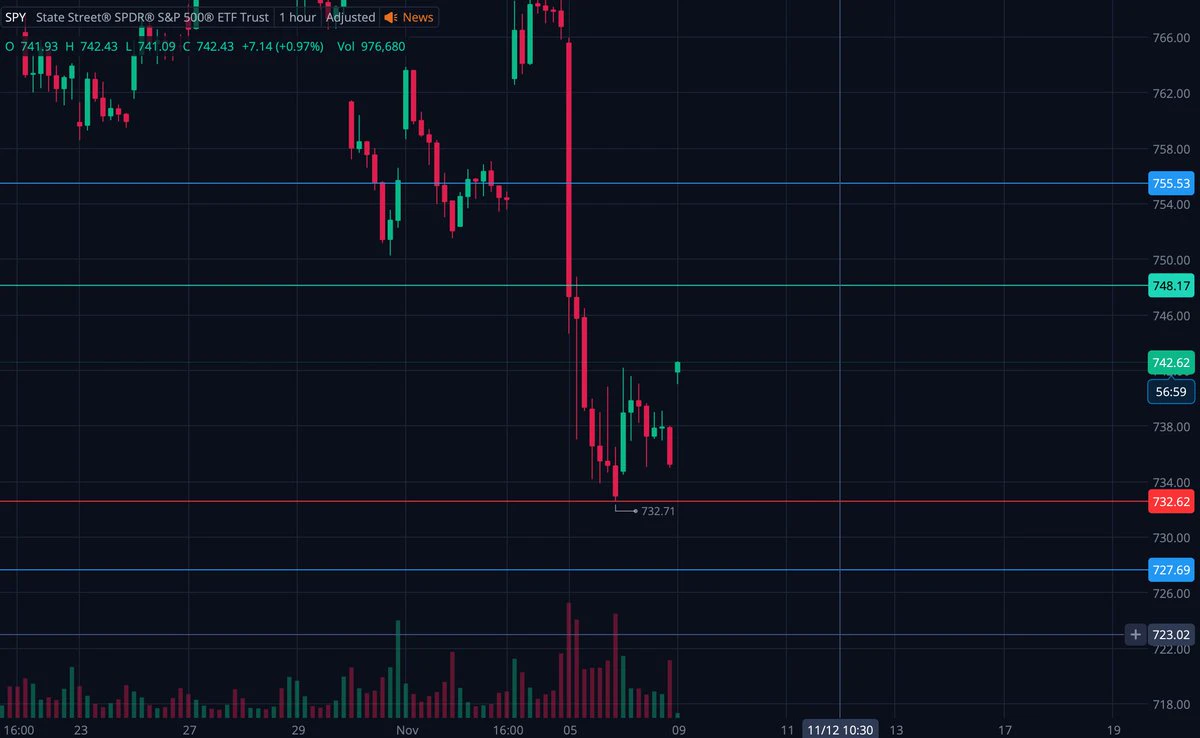
Good morning $SPY
$8 pump in pre market 🚀🚀
Watching for some of this to sell off today! Would like a retest of $740.
Gap fill is down to $735
post-image
🏆 1 day left on the countdown! Registration for the Gate Social Year-End Community Gala is about to close!

🎁 Annual streamer & creator competitions, with generous prizes for the Top 20 in the Chinese-speaking region!
🥇 TOP 1: DJI Osmo Pocket 4
🥈 TOP 2–3: AirPods Pro 3
🥉 TOP 4–6: Honor AI Projector
🎁 TOP 7–10: Anker 3-in-1 Power Bank
🏎️ TOP 11–20: LEGO Red Bull Racing Car
🌟 All Top 20 winners receive an annual honorary trophy + exclusive VIP5 badge!

🎉 Fans can win great prizes too! Vote to win exclusive rewards!
🥇 Fan No.1: Bialetti Dual-Valve Moka Pot
🥈 No.2: JBL GO4 Portable Blue
GT-2.41%
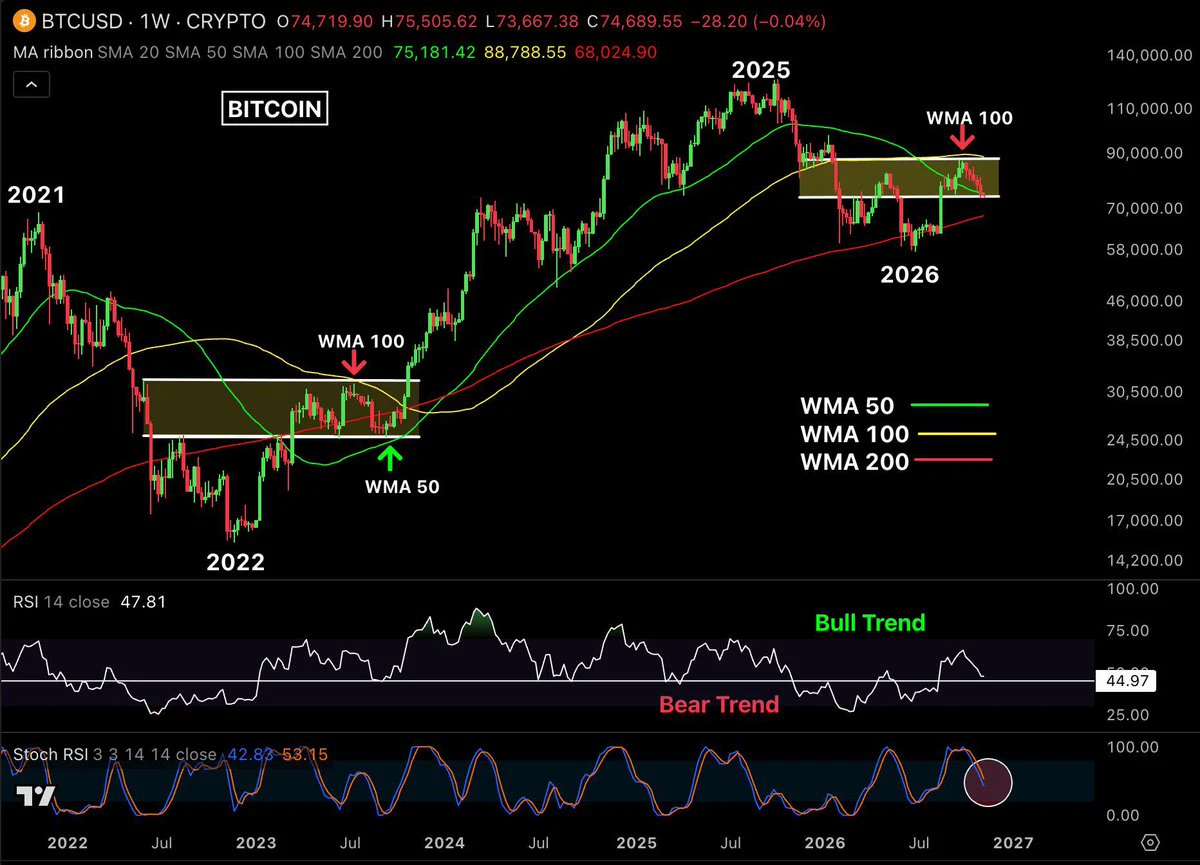
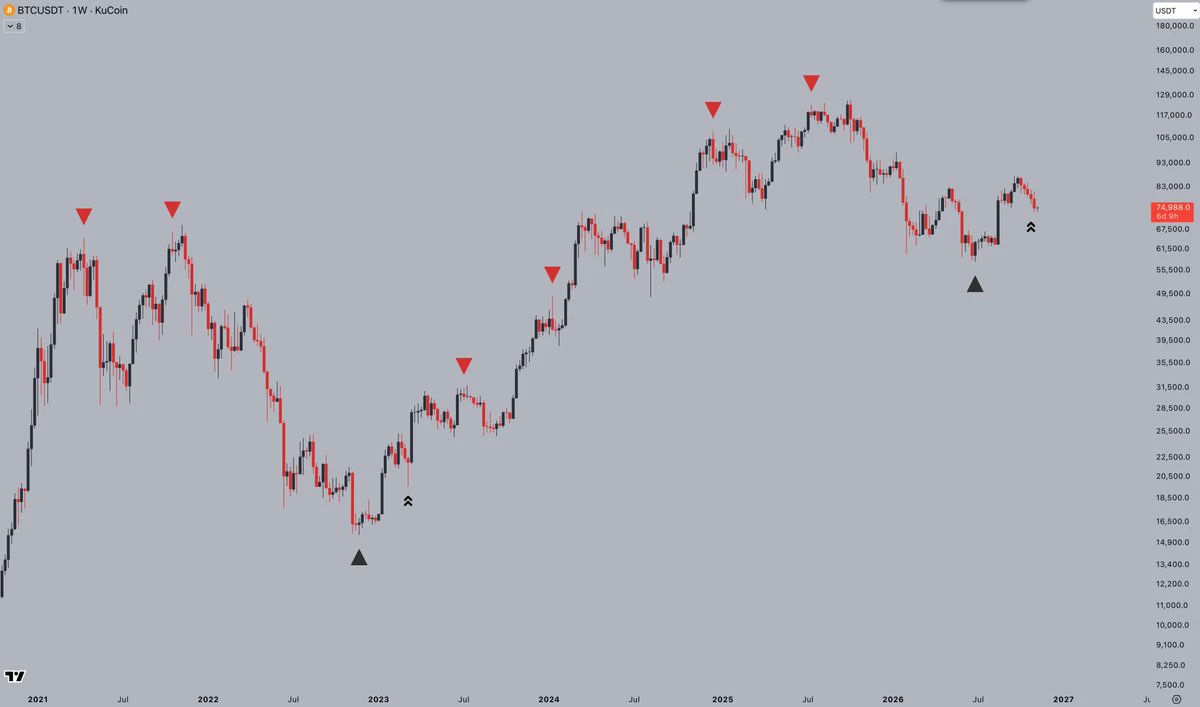
Bitcoin Weekly Update
$BTC closed the week at $74.7K, down 4.47%, just below the WMA 50.
Here's what matters:
- RSI above 44, keeping the broader bull structure intact.
- Stoch RSI still showing downside weakness.
- Support: $73.1K and $67.7K.
- Resistance: $82K and $87.5K.
The current structure looks similar to the 2022 base, where BTC consolidated between key weekly moving averages before its next major move.
Interestingly, Nasdaq dropped nearly 6% last week, while BTC fell only 4.47%.
Relative strength or just a temporary pause?
post-image
BTC-0.67%
NDAQ+1.40%
#英伟达突发风波股价承压 #Gate股票畅聊季 Jensen Huang had an affair. Will Nvidia stray too?

For now, the impact of this affair has three layers: the personal and family consequences are most severe, the short-term impact on Nvidia is manageable, and the real wild card is the chip compliance investigation.
For Jensen Huang himself, the affair damages his long-cultivated family-man image, reducing his credibility and influence. The board has launched an independent investigation focused on improper transfers of benefits, customer relationships, and information security. If the investigation confirms only a priv
post-image
NVDA-5.72%
Democrats sweep the US Congress. Is the crypto industry in for a shake-up? SEC regulatory authority
live-cover
LIVE3,028
Candlesticks tell you “what happened,” while trading volume tells you “why it happened”
Many people look only at price, not volume. The result: the patterns look right, but they’re all false signals.
Because price is the result, while trading volume is the cause.
Remember these four combinations:
1. Rising + increasing volume → real rise
Buyers are stepping in with capital, and the trend is healthy.
This is the only kind of rally worth chasing.
2. Rising + decreasing volume → false rise
No one is buying in; price is moving up on momentum alone.
This kind of rise often gives it all back in a si
post-image
BTC-0.65%
The first higher low is the scariest.
It only gets easier from here.
$BTC
post-image
BTC-0.67%
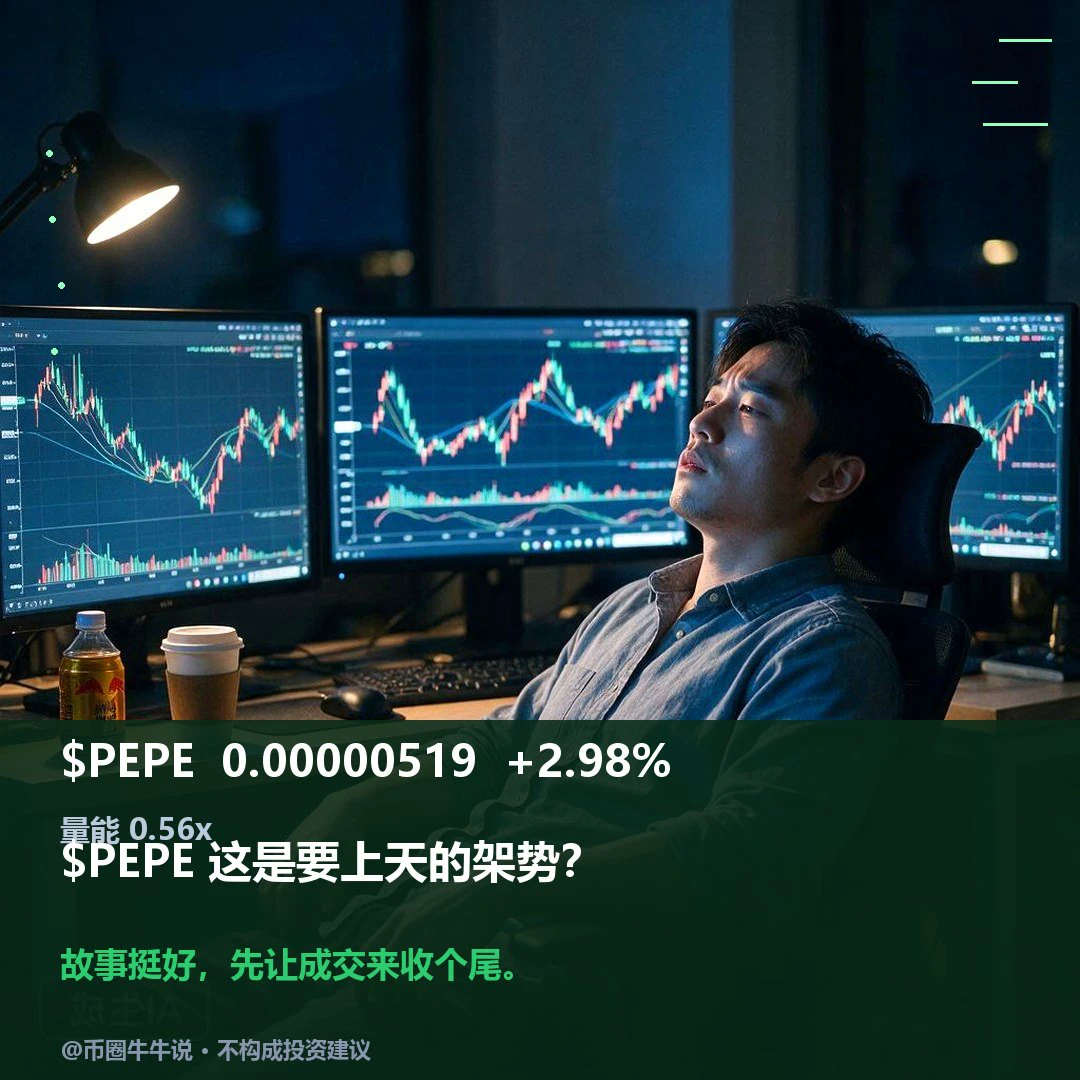
$PEPE Currently trading at 0.00000519, up 2.98% over 24H. The 1H trend is mildly strong, with RSI at 58, resistance at 0.00000524, and support at 0.00000480; the 4H trend is mildly strong, with RSI at 66, resistance at 0.00000524, and support at 0.00000466. Trading volume is 0.56x the average. The price needs to hold above 0.00000524 to move higher; a break below 0.00000480 would signal weakness. Going forward, watch whether the price can hold above 0.00000524 and recover after losing 0.00000480; a single break of either level needs volume confirmation. Markets are volatile; for observation on
post-image
PEPE+0.97%
Why do the support and resistance levels you draw keep getting broken?
Because most people aren’t drawing “support”—they’re drawing something that just looks like support.
Five common mistakes:
Mistake 1: Drawing lines based on wicks.
You see a long lower wick and draw a horizontal line.
But wicks are often traces left by a stop hunt, not price levels the market has agreed on.
The right way: Focus on areas with dense candle bodies; use the lowest wick as a reference boundary, but don’t use it on its own.
Mistake 2: Drawing lines where they “look right.”
Your lines always end up exactly where t
post-image
BTC-0.65%
The Five Most Common Misreadings of Candlesticks—Almost Everyone Falls for Them
Misreading 1: Seeing a Doji and Assuming a Reversal Is Coming
A doji only tells you that, during that period, buying and selling pressure were about equal.
But what about direction? That depends on where it appears.
Appearing at a key support/resistance level → it may be a reversal signal
Appearing in the middle of a range → it simply lacks direction; it doesn't mean a reversal is coming
The same candlestick can mean the exact opposite depending on where it appears.
Misreading 2: A large bullish candle = strength;
post-image
BTC-0.65%
Behind every get-rich-quick story you see are 100,000 people
Let’s do a simple thought experiment:
1,000 people, each with 10k U, using 20x leverage to take purely random long and short positions.
Assume each trade has a 50% win rate, and they make 10 trades.
The probability of winning 10 times in a row: about 0.1%
That means about 1 person out of 1,000 gets every trade right
That person’s account grows 1,000x. They’ll be interviewed, write articles, and become a “legend.”
The other 999 people lose everything in their accounts, and no one mentions them.
That’s survivorship bias.
You think you’
post-image
BTC-0.65%
ETH-1.23%
Post-trade reviews: 90% of people are reviewing the wrong thing
Most people’s so-called post-trade review means opening a candlestick chart and thinking, “If I’d bought here, I would’ve made money.”
That’s not a review. It’s reliving regret.
A real review examines your decisions, not the market.
Why?
Market movements always look clear in hindsight. Reviewing the market only gets you one line: “How did I not see that at the time?” That’s useless, because it doesn’t change your behavior next time.
An effective review records only four things:
1. Reason for entry (what you thought then, not what
post-image
BTC-0.65%
Guys, trust me, $ARC will soon rise to 0.0450. I'm opening a 10x long position. Take-profit: 0.0380 / 0.0420 / 0.0450 Stop-loss: 0.320 Guys, get in now and you can soon earn a considerable profit. Opportunities like this don't come every day, so don't miss out. Who wants to open a long position with me? 🤔 Not investment advice. Trade here 👉🏻 $ARC
post-image
ARC-4.26%
Load More

Join 40 M users in our growing community

⚡️ Join 40 M users in the crypto craze discussion

💬 Engage with your favorite top creators

👍 See what interests you

Trending Topics

USCPIDataIncoming

39.69k Views2k Discussing

The U.S. October CPI report will be released on November 10 at 8:30 a.m. ET. September CPI came in at 3.7% year over year, and markets will be watching closely for signs that inflation is cooling, especially in core CPI. A softer-than-expected reading could strengthen rate-cut expectations, while hotter inflation may pressure risk assets through higher Treasury yields and a stronger dollar. How do you think this CPI print will move $BTC, U.S. stocks and gold?

RedBullDoublePodiumInBrazil

7.3k Views30.58k Discussing

BTCFlashCrash

170.1k Views66.51k Discussing
View More