Square
Following
Hot
News
Notifications
Profile
Share your thoughts
placeholder
Article
🤷‍♂️Let’s start with a staggering number: $2.7 trillion vanished in a month and a half. 🥹On October 6, Nvidia was still the world’s most valuable company, with a market cap of nearly $5.77 trillion and its stock trading around $240. A month and a half later, on November 20, the stock had fallen below $126, dropping 14.01% in a single day to a new 52-week low. Its market cap had shrunk to about $3 trillion, and it had fallen to fourth place among US stocks, behind Apple, Microsoft, and Alphabet. From its October 6 peak, it was down 47.5%, marking its longest losing streak since 2008. There’s
post-image
ETH-1.26%
ZEC+1.16%
There really are more good people out there!!
Made just over 10 million, all thanks to jealous people helping me out.
post-image
Trenches
IDOL
I
bade
b
IDOL
0x3b...ab07
Market Cap
$.
Change
.
24h Vol
$.
Holders
.
JAGENT
J
bade
b
JAGENT
0x8e...ae15
Market Cap
$.
Change
.
24h Vol
$.
Holders
.
PIEVERSE
P
bade
b
PIEVERSE
0x0e...25a9
Market Cap
$.
Change
.
24h Vol
$.
Holders
.
FIONA
F
bade
b
FIONA
B34n...pump
Market Cap
$.
Change
.
24h Vol
$.
Holders
.
mihao
m
bade
b
mihao
4Cxj...pump
Market Cap
$.
Change
.
24h Vol
$.
Holders
.
Ethereum 9ETH0 surpasses 1,7000 USDT with Narrowed 1.69 Decrease in 24 hours
live-cover
LIVE1,466
BTC-0.67%
ETH-1.26%
USDC+0.01%
XRP-1.15%
Already pushing toward 4. I'll place a short order lower at 4.33 and see if it gets filled; short-term short
post-image
4-4.10%
  • 1
btc
live-cover
LIVE1,550
ETH-1.26%
BTC-0.67%
SOL-0.77%
USDC+0.01%
Damn,
I almost died laughing,
I never would’ve expected this ending...
  • 2
  • 2
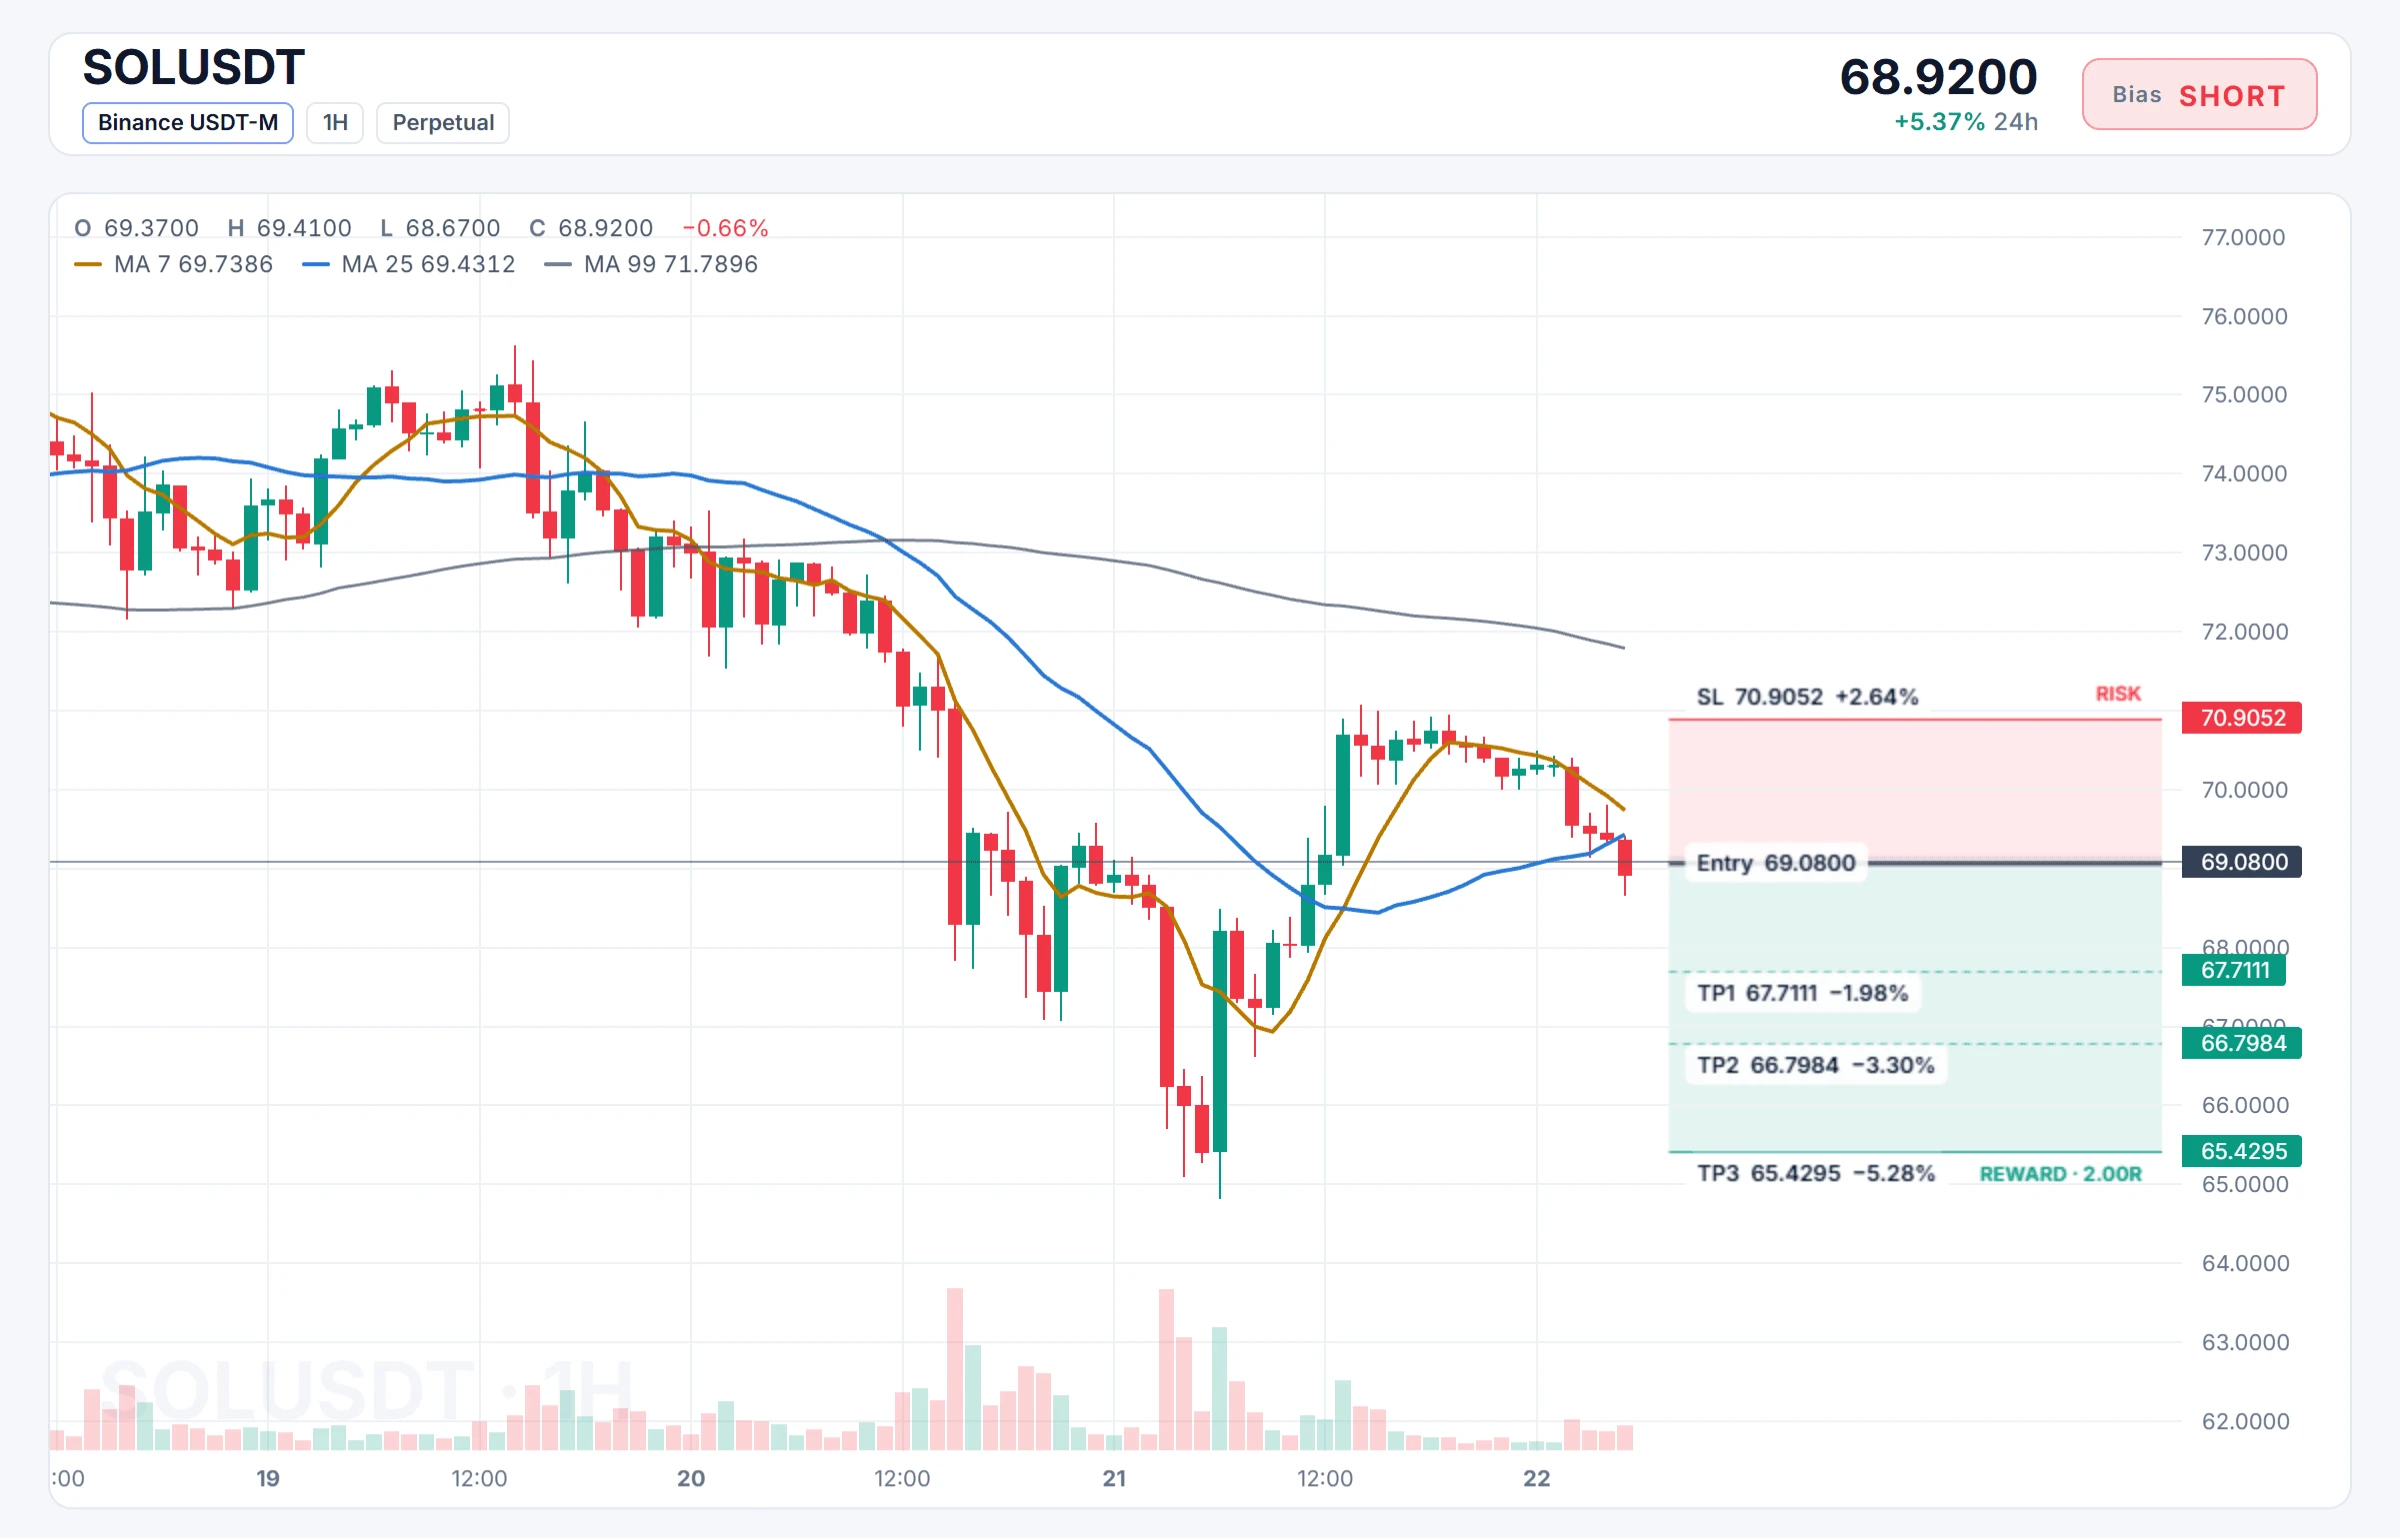
Bulls Are Caught: The $SOL USDT Short Trade Is Ready to Execute

$SOL /USDT

Trade Direction: SHORT

Entry Price: 69.0800

Take-Profit Levels
🔹 TP1: 67.7111
🔹 TP2: 66.7984
🔹 TP3: 65.4295

🛑 Stop-Loss Price: 70.9052

$SOL
post-image
SOL-0.74%
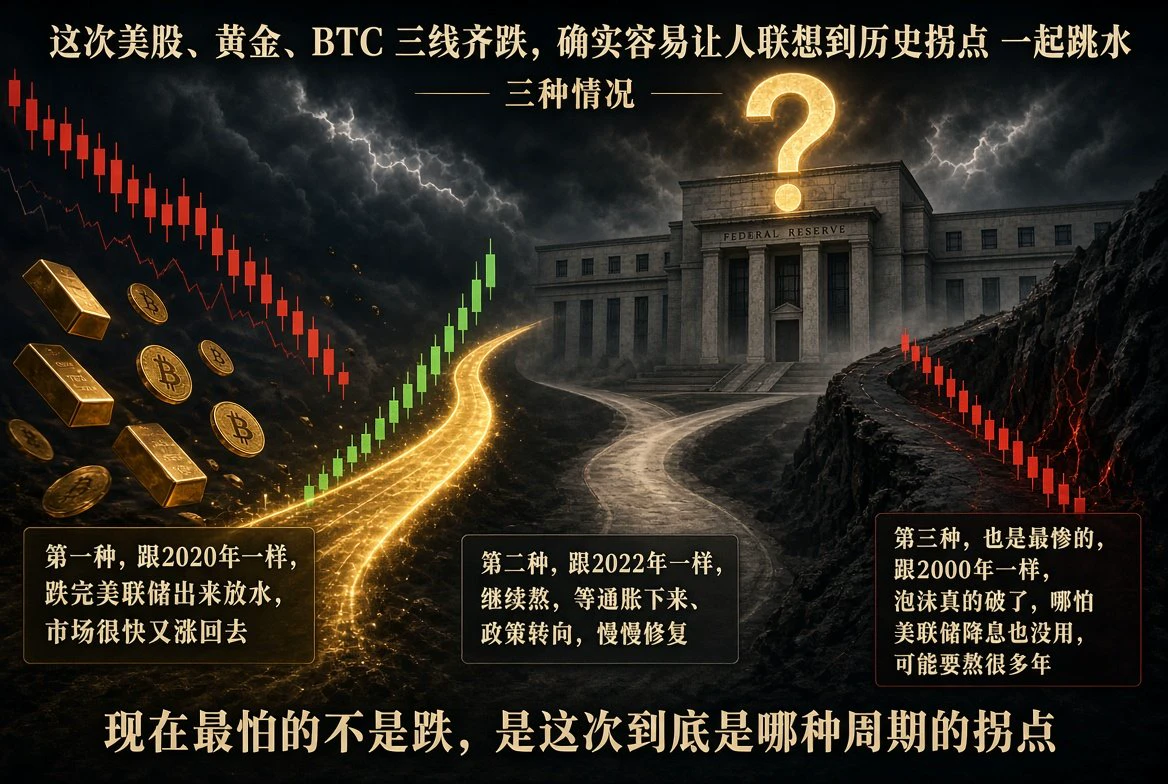
This time, U.S. stocks, gold, and BTC all fell in tandem, making it easy to think of historical turning points
The first scenario: 2020. After the drop, the Fed turned on the liquidity taps, and the market quickly climbed back up
The second scenario: 2022. Keep holding out, wait for inflation to come down and policy to pivot, then recover gradually
The third, and worst, scenario: 2000. The bubble really burst, and even Fed rate cuts did no good; it could take many years to get through
What’s most worrying now isn’t the drop, but which kind of cycle turning point this is
post-image
GLDX-0.40%
PAXG+0.37%
BTC-0.67%
  • 1
I really do have a Chinese-food palate.
Western food feels pretty exciting for the first few bites, but later, even though I’m still hungry, I don’t know what else to eat.
As expected, hot pot, noodles, and stir-fries are what really hit the spot. 😂
  • 1
GM Legends
Only the real ones are here on a Sunday.
post-image
Even hackers are starting to buy the dip in Ethereum—is that a strong enough signal? $ETH
Look at the on-chain data: even attackers are accumulating at low prices, which shows that the current price range is indeed attractive. Market sentiment often reverses at extremes. When even the “bad guys” can’t resist buying, it may mean selling pressure is nearing its end. But don’t rush to follow the crowd; hackers operate by a logic completely different from that of ordinary investors. $ETH Risk warning: The above is for market observation only and does not constitute investment advice. Crypto asse
post-image
ETH-1.26%
If you keep calling the short-haired girl a tomboy, I’ll start calling the long-haired guy a fake young woman.
post-image
For anyone unfamiliar with the “woke up at 3am to buy in” meme:
post-image
In the early hours, when liquidity was at its thinnest, a single wick sliced through 60000, burying longs before they even had time to place stop-loss orders. So here’s the question: was this a panic-driven selloff that created a golden buying opportunity, or the first sign that the AI bubble is starting to deflate? The former is suggested by social media buzz holding firm and discussion volume staying up; the latter by stock valuations shrinking across the board and risk assets plunging in unison. I’m leaning toward the latter—the answer is hidden in the details.
post-image
  • 1
🚨 CRYPTO MARKET UPDATE | NOVEMBER 22

📊 The Crypto Market Is Showing a Recovery, But Caution Remains!

Bitcoin and major altcoins are attempting to recover after the recent heavy market sell-off.

₿ Bitcoin (BTC): Around $59,000
♦️ Ethereum (ETH): Around $1,660
📉 Market Sentiment: Extreme Fear

🔥 What Should Traders Watch Today?

1. BTC needs to regain strong momentum above the $60K area.
2. ETH needs stronger buying pressure to confirm recovery.
3. Watch support and resistance levels before making decisions.
4. Trading volume will be important to confirm the next move.
5. Altcoins may rem
BTC-0.67%
ETH-1.26%
Bitcoin price analysis for the coming week,
1. Upside: If Bitcoin pulls back to around 58000, consider going long. Over the next two days, it will test resistance around 61000; a breakout would put 64600 in view.
2. Downside: If it tests around 57362 again over the next two or three days, then 55000 was not the bottom this time. If Bitcoin cannot break above 61000 next Wednesday or Thursday and continues to churn around 55000 to 568000, it will most likely test around 51400 again.
BTC-0.67%
There are few short positions and many long positions. After a big rally, one bearish candle, then it keeps rising? The chart action looks like it may be baiting traders into shorting. Long strategy $AIGENSYN , suitable for entering during sideways movement and a gradual rise: Entry: 0.0168-0.0169 Take profit: 0.0184 Stop loss: 0.0157 This strategy may suit this chart pattern. The market maker is going long at around 0.014-0.015
post-image
AIGENSYN+1.18%
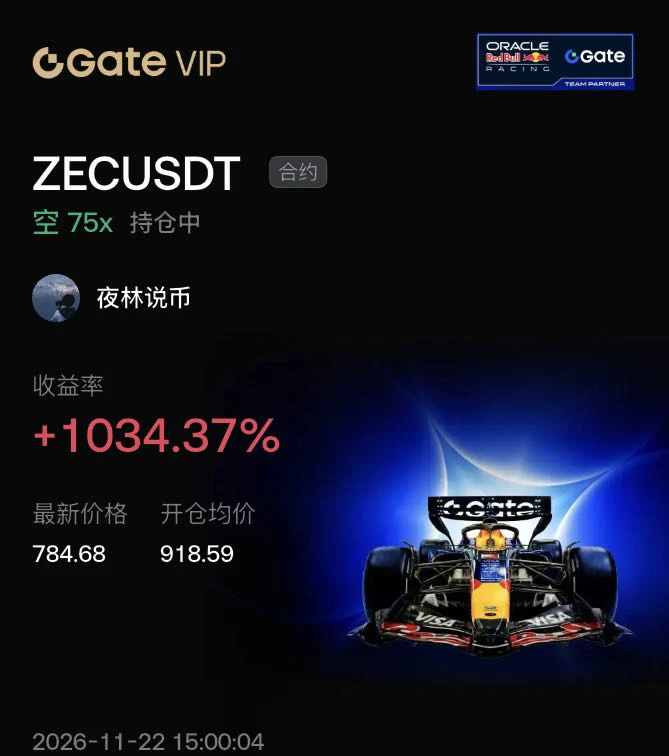
$ZEC When the market-wide long/short ratio spikes to an extreme, is this the final stage of retail investors becoming exit liquidity?
In-depth analysis: When ZEC surged to 918.59, the account long/short ratio was heavily skewed toward longs, indicating that retail investors were all in and no new buyers remained in the market. Exhausted buying pressure is the biggest bearish catalyst. I opened a short as the long/short ratio peaked and began to retreat, using 75x leverage to capitalize on the cascade in this overcrowded trade.$BTC $ETH
post-image
ZEC+1.29%
BTC-0.65%
ETH-1.23%
  • 2
$ORCA is showing strong bullish momentum—$1.32 could be next! Trading strategy: Long entry range: $1.235 – $1.250Take-profit 1: $1.280Take-profit 2: $1.300Take-profit 3: $1.326Stop-loss: $1.205ORCA is showing a strong recovery after consolidating, with buyers gradually regaining control. If the price breaks above $1.25 and holds, it could climb further toward the $1.30–$1.326 resistance zone.
post-image
ORCA-5.19%
People online these days really know how to twist the knife.
Skunked! And skunked during a nighttime “battle,” no less 🤣🤣
Load More

Join 40 M users in our growing community

⚡️ Join 40 M users in the crypto craze discussion

💬 Engage with your favorite top creators

👍 See what interests you

Trending Topics

BTCReboundFaces60KTest

2.1M Views30.1K Discussing

BTC rebounded from around $55,300 on November 21, briefly reclaiming $60,000 before pulling back to around $59,300. The $60K level is back in focus as traders assess whether the recovery can last. Is this rebound a sign of stabilization or a short-lived recovery? Would reclaiming and holding $60K be enough, or do you need confirmation from trading volume and fund flows?

PCEAndGDPDataNextWeek

258.7K Views2.6K Discussing

GateDirectIPOPhase3ANTAllocates92100Shares

823.4K Views5K Discussing

View More