Square
Following
Hot
News
Notifications
Profile
Share your thoughts
placeholder
Article
Someone I’m introducing to my brother-in-law for a blind date. What do you guys on X think?
post-image
$NEAR 3.014, 24H +9.1%. The 1h RSI is at 73, in overbought territory, and short-term momentum is stretched. The current 1h trend is strong, and the 4h trend is also strong, but the overbought risk is significant, making a pullback likely. Resistance at 3.02 is still in sight, and that’s the only level I’m watching: follow through if it holds above 3.02; otherwise, continue to wait. Don’t mistake short-term volatility for a reversal. Stay calm and don’t chase rallies or sell dips. Patiently wait for confirmation before acting. Continue to monitor. Stay patient. This is not investment advice.
#N
post-image
Trenches
IDOL
I
bade
b
IDOL
0x3b...ab07
Market Cap
$.
Change
.
24h Vol
$.
Holders
.
JAGENT
J
bade
b
JAGENT
0x8e...ae15
Market Cap
$.
Change
.
24h Vol
$.
Holders
.
PIEVERSE
P
bade
b
PIEVERSE
0x0e...25a9
Market Cap
$.
Change
.
24h Vol
$.
Holders
.
CLAUDIA
C
bade
b
CLAUDIA
2j5S...W2ZM
Market Cap
$.
Change
.
24h Vol
$.
Holders
.
mihao
m
bade
b
mihao
4Cxj...pump
Market Cap
$.
Change
.
24h Vol
$.
Holders
.
Afternoon Market Updates
live-cover
LIVE3,503
ETH-1.26%
BTC-0.67%
SOL-0.77%
ZEC+1.16%
HYPE+0.24%
Hahaha, this metaphor is pure genius!
After all, after being put through the wringer in a backpack,
the exam paper has already developed the chewy texture and aged flavor of yuba.
post-image
$PI Large screen at Shanghai Pudong Airport
PI-0.60%
  • 5
why would anyone ever use defi again if there is 2.5% upside and infinite downside?!?
post-image
Pumpkin market prediction update
live-cover
LIVE1,445
BTC-0.67%
ETH-1.26%
$SNDK With prices falling and open interest continuing to decline, are longs actively retreating?
In-depth analysis: After SNDK fell below 92.02, futures open interest continued to drop from its high, indicating that this was not a sell-off driven by new shorts entering, but existing longs actively closing their positions and exiting. Longs retreating is the most reliable fuel for a trend. I opened a short as OI contracted for three consecutive days, using 75x leverage to capture the main downward leg driven by longs exiting. $ZEC $BTC
SNDK-0.18%
ZEC+1.29%
BTC-0.65%
  • 1
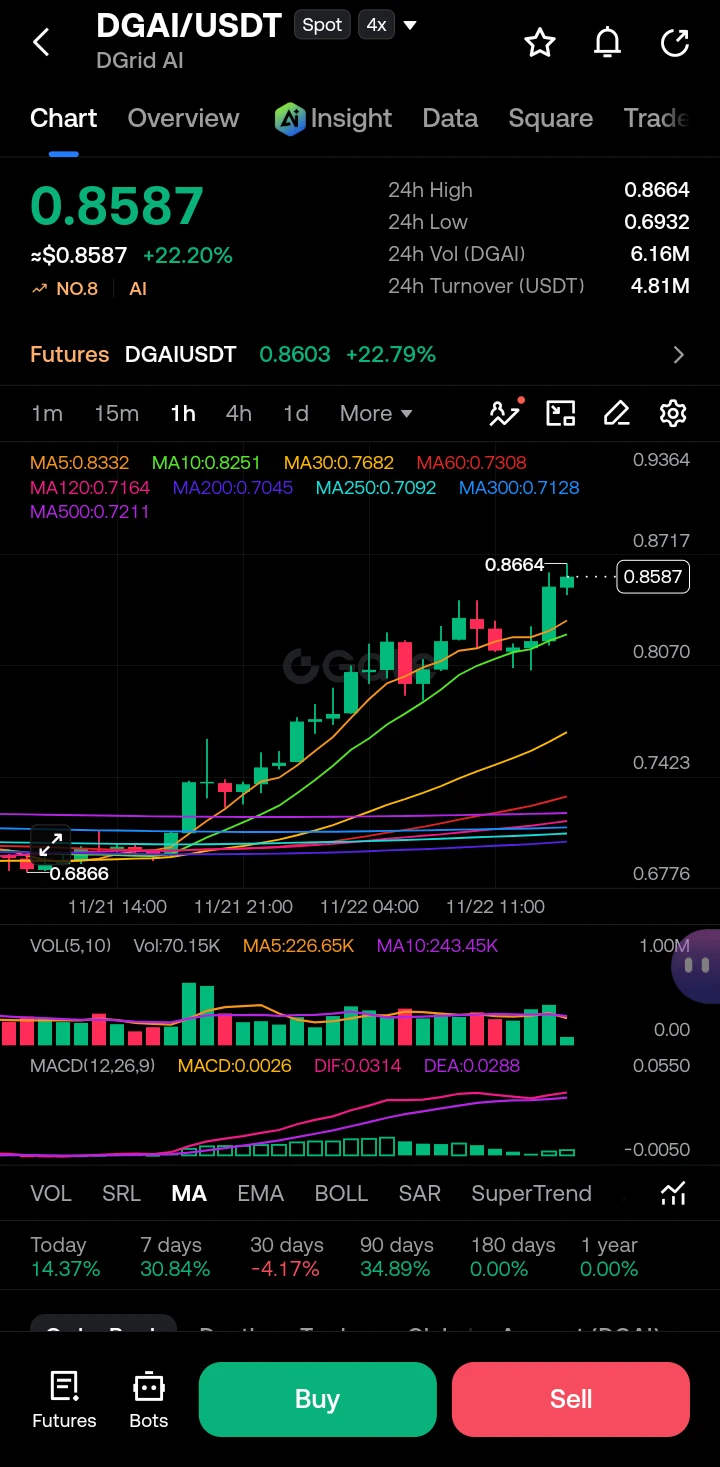
$DGAI ‌
The DGAII/USDT chart is displaying a textbook, aggressive bullish trend, having rallied over 22% in the last 24 hours to reach a current price of 0.8587. Price action is forming a series of higher highs and higher lows, riding a strong uptrend. The moving averages (MA) are in a perfect bullish fan, with the short-term MA5 (0.8332) and MA10 (0.8251) acting as dynamic support below the current price. We are currently testing the 24-hour high resistance zone at 0.8664. Volume has been noticeably elevated during this upward push (Vol MA5 is 226.65K), confirming the buying pressure behind
post-image
DGAI+0.67%
  • 4
  • 1
Bitcoin’s 4-year cycle isn’t dead; what’s dead is the patience of people in a hurry to get rich.

Everyone online is shouting “the cycle is broken” and “a financial crisis is coming.” I checked the complete data for all four cycles:

1. The timing is spot-on. This cycle’s top was October 6, 2025, 534 days after the April 2024 halving—right in the historical 12–18-month post-halving window for a top (368 / 525 / 549 days in the previous three cycles). The cycle hasn’t disappeared; it’s just been compressed by institutional capital. The maximum drawdown this cycle was about 54%, compared with 77
post-image
BTC-0.67%
  • 2
  • 1
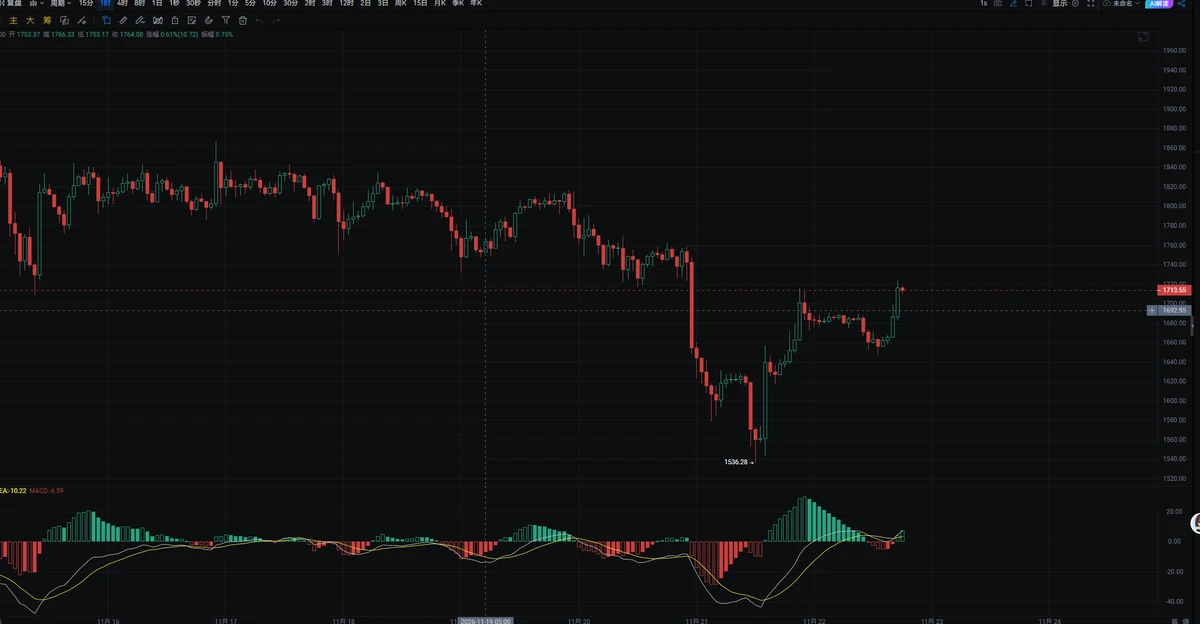
🟢 ETH LONG / BUY SETUP SUCCESSFUL! 🔥

Initially opened ETH long positions from $1,632.

After the initial entry, ETH dropped towards the $1,540 area.

According to the trading plan, the strategy was to add more long positions if ETH reached that area.

✅ Added more longs from the planned zone, with updates and proof shared.

Now, all ETH long positions have been successfully closed around $1,720.

TA CLICKED! 🎯

$ETH $BTC
ETH-1.26%
BTC-0.67%
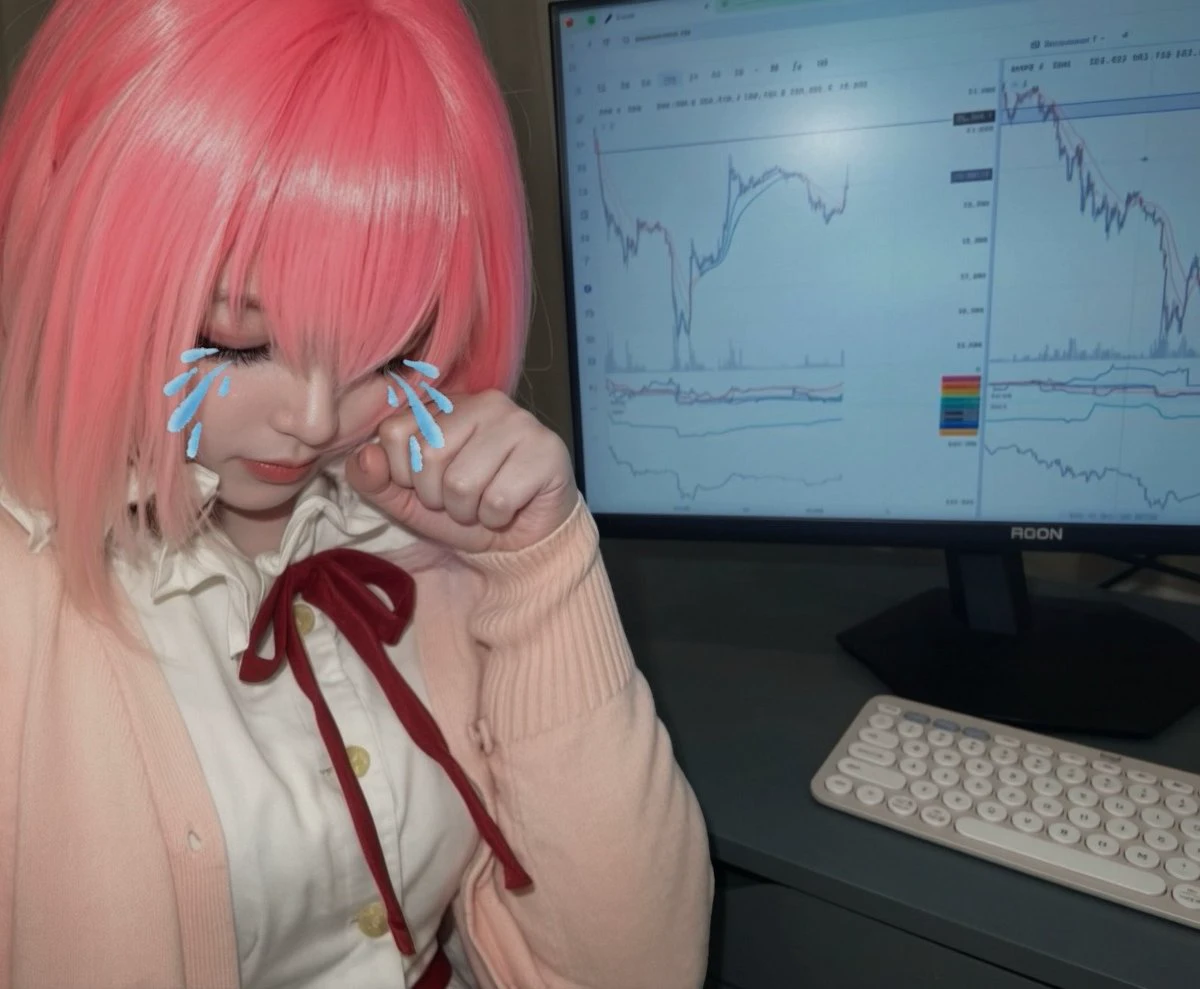
Putting it on gives you the urge to go all in
#FX戦士くるみちゃん
post-image
$ETH The ETF is the most direct force behind Ethereum’s drop.

On November 20, U.S. spot Ethereum ETFs saw net outflows of about $101 million, their second-largest since these products launched. BlackRock alone saw $93.7 million flow out; from the 16th through the 20th, outflows continued for five straight days, totaling $220 million for the week.

Ethereum ETFs are relatively small to begin with, so these outflows have a bigger impact on the price than people might expect. ETH fell 16% in a week and 34.5% in a month, with selling pressure coming mainly from ETF outflows.

Institutions moving
ETH-1.23%
BTC-0.65%
  • 1
Reverse robbery: Web3Auth itself withdrew $5.6 million from its own users 🕵️‍♂️💸
#bitcoin #trading #crypto #indicators #cryptocurrency #web3auth #keplr #cryptonews
post-image
BTC-0.67%
#GoldNears3500 $XAUUSD ‌
Navigating the Overextended Gold Market from Macro to Micro"

The current market presents a classic paradox: price action is heavily overextended, yet momentum remains tantalizing. Trading on the 4-hour and 1-hour charts right now is not about chasing the trend, but about understanding why the market is stretched. We are looking at a scenario where retail traders are caught in the crossfire of institutional liquidity hunting. This analysis breaks down the structural mapping of Gold (XAUUSD), analyzing the flow from a monthly macro perspective down to the 1-hour execu
XAUUSD-2.40%
  • 3
  • 1
Fuck your mother, fuck your mother, motherfucker, match-fixing.
post-image
  • 2
  • 3
#ETH Current price: 1713. Price action is in a weak, low-level recovery following BTC’s decline, with no independent positive catalysts to support it. It is relatively volatile: during downturns, it often falls more sharply than BTC, and resistance tends to be stronger during rebounds. The first resistance zone above is 1760-1800, where a large number of underwater holders are concentrated. A meaningful rebound will require Bitcoin to break above 62500 on strong volume and hold there; otherwise, price could easily encounter resistance and pull back at this level. The nearest support below is 1
post-image
ETH-1.26%
BTC-0.67%
  • 2
  • 1
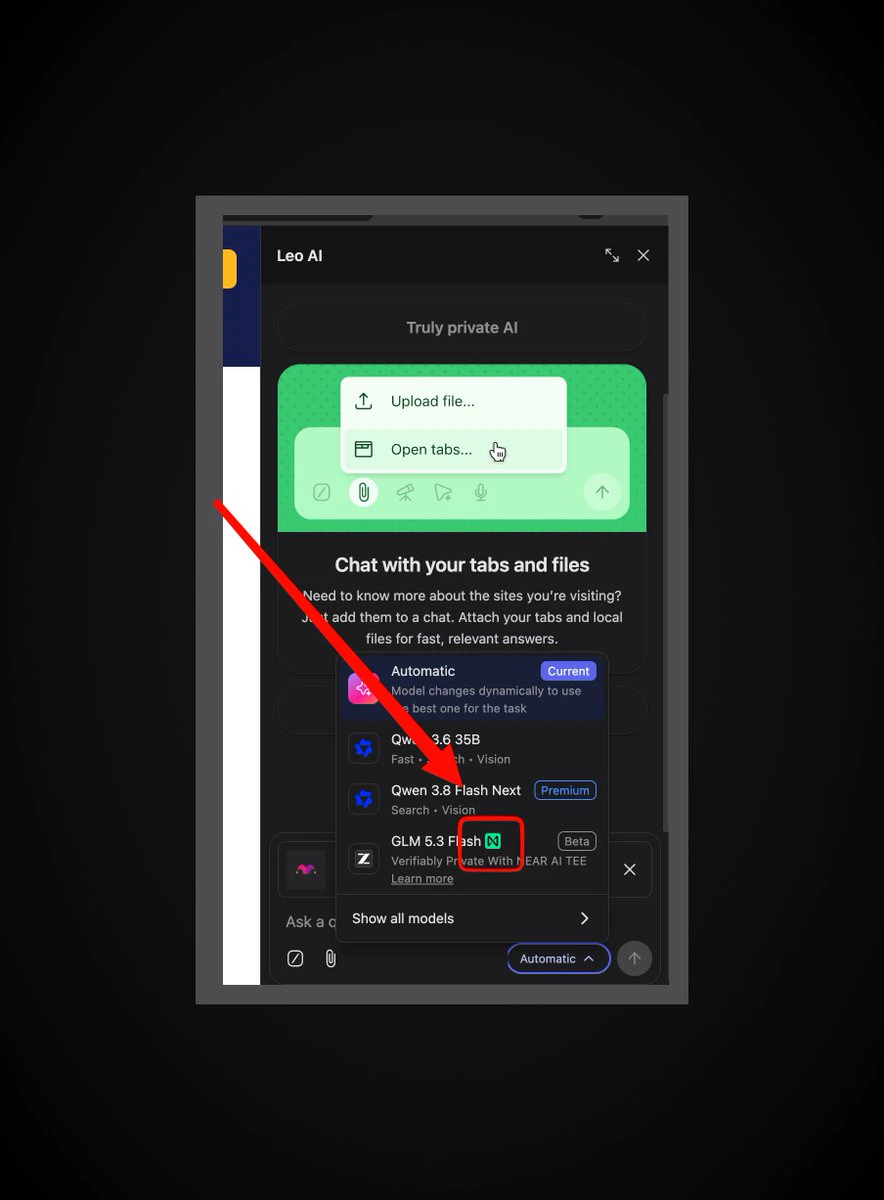
Near private inference in brave browser, cool!
post-image
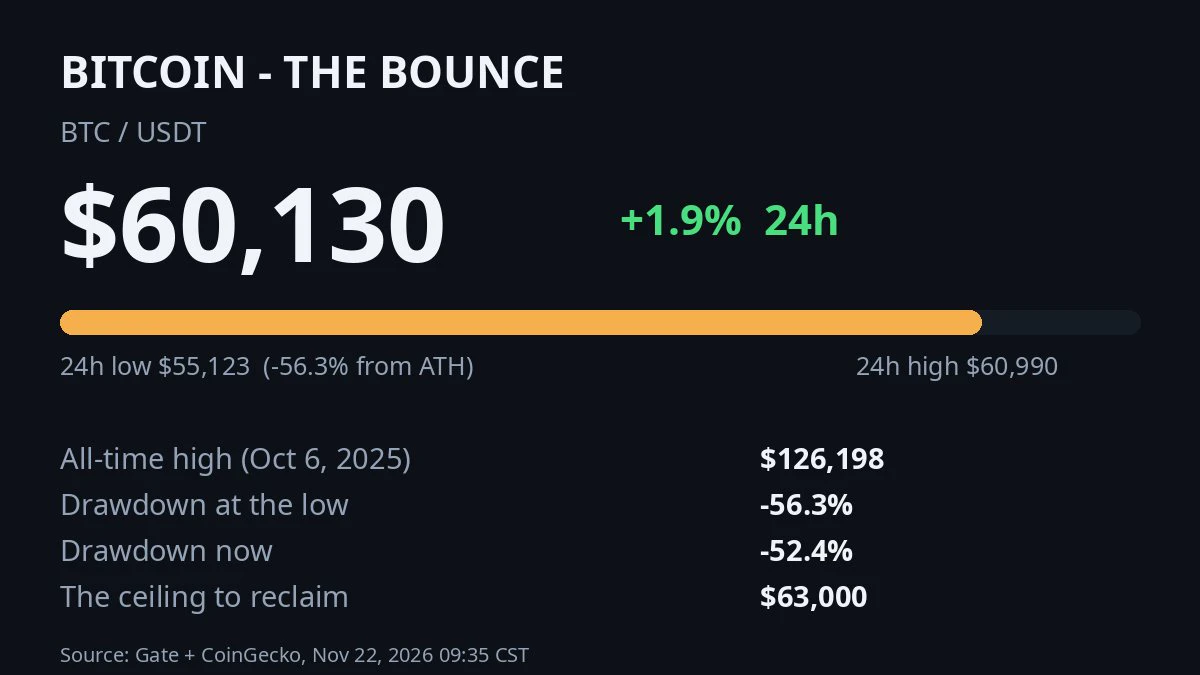
Bitcoin ran the script live: $2.4B+ liquidated, flush to $55,123, back over $60K same day. Bear bounces are the violent ones. The bounce is not the signal, the ceiling is: $63K, last support. Reclaim it, the shallow case lives. Reject it, the final leg follows.
post-image
BTC-0.65%
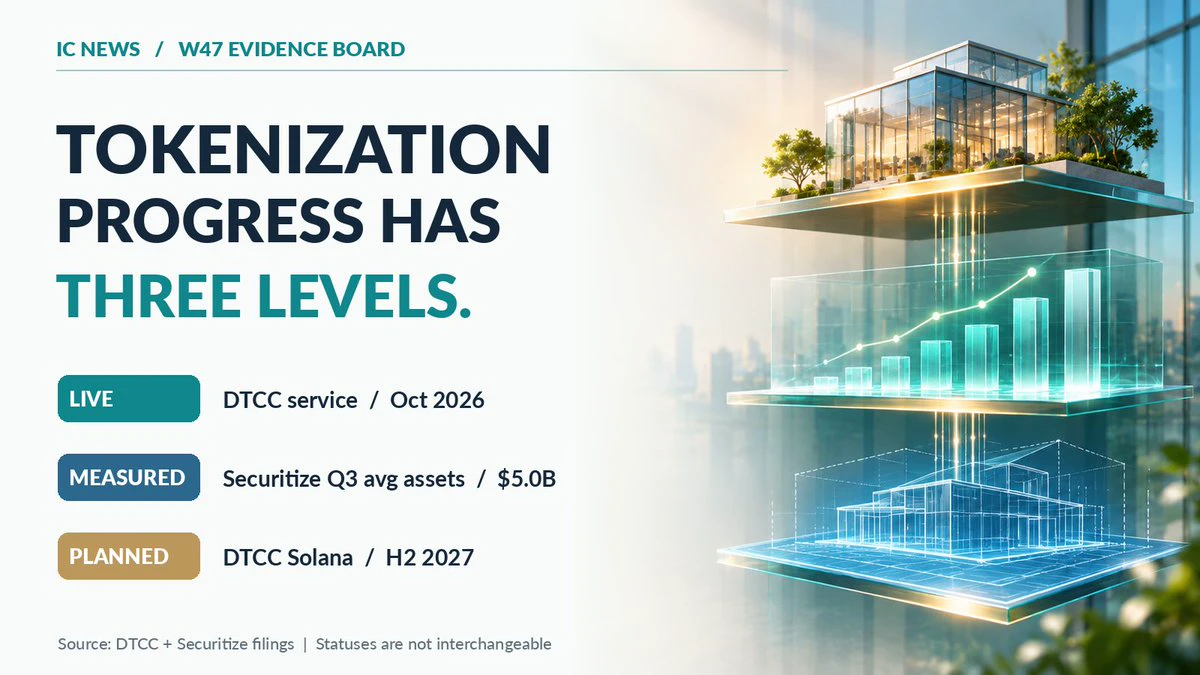
Tokenization progress takes different forms.
DTCC has a live service. Securitize reported $5.0B in average tokenized assets on the platform in Q3. DTCC's Solana expansion is planned for H2 2027.
All matter. They aren't the same kind of evidence.
#RWA #Tokenization
post-image
SOL-0.77%
RWA-0.39%
Load More

Join 40 M users in our growing community

⚡️ Join 40 M users in the crypto craze discussion

💬 Engage with your favorite top creators

👍 See what interests you

Trending Topics

BTCReboundFaces60KTest

2.1M Views30.1K Discussing

BTC rebounded from around $55,300 on November 21, briefly reclaiming $60,000 before pulling back to around $59,300. The $60K level is back in focus as traders assess whether the recovery can last. Is this rebound a sign of stabilization or a short-lived recovery? Would reclaiming and holding $60K be enough, or do you need confirmation from trading volume and fund flows?

PCEAndGDPDataNextWeek

259.2K Views2.6K Discussing

GateDirectIPOPhase3ANTAllocates92100Shares

831.8K Views5K Discussing

View More