Trade
Trading Type
Spot
Trade crypto freely
Alpha
Points
Get promising tokens in streamlined on-chain trading
Pre-Market
Trade new tokens before they are officially listed
Margin
Magnify your profit with leverage
Convert & Block Trading
0 Fees
Trade any size with no fees and no slippage
Leveraged Tokens
Get exposure to leveraged positions simply
Futures
Futures
Hundreds of contracts settled in USDT or BTC
Options
HOT
Trade European-style vanilla options
Unified Account
Maximize your capital efficiency
Demo Trading
Futures Kickoff
Get prepared for your futures trading
Futures Events
Participate in events to win generous rewards
Demo Trading
Use virtual funds to experience risk-free trading
Earn
Launch
Investment
Simple Earn
VIP
Earn interests with idle tokens
Auto-Invest
Auto-invest on a regular basis
Dual Investment
Buy low and sell high to take profits from price fluctuations
Quant Fund
VIP
Top asset management team helps you profit without hassle
Crypto Loan
0 Fees
Pledge one crypto to borrow another
Lending Center
One-Stop Lending Hub
VIP Wealth Hub
New
Customized wealth management empowers your assets growth
Private Wealth Management
Customized asset management to grow your digital assets
Staking
Stake cryptos to earn in PoS products
BTC Staking
HOT
Stake BTC and earn 10% APR
GUSD Minting
New
Use USDT/USDC to mint GUSD for treasury-level yields
Soft Staking
Earn rewards with flexible staking
More


- Trending TopicsView More
33.4K Popularity
87.2K Popularity
208.1K Popularity
167.4K Popularity
16.4K Popularity
- Pin
Analyst sets Dogecoin’s price for October
Dogecoin (DOGE) is ending September with mild bearish momentum, but technical indicators and historical performance suggest the coin could surge in October.
This outlook, shared by TradingShot in a TradingView post on September 30, indicated that Dogecoin has been moving within an upward channel since March, showing a consistent pattern of higher highs and higher lows.
TradingShot**TradingView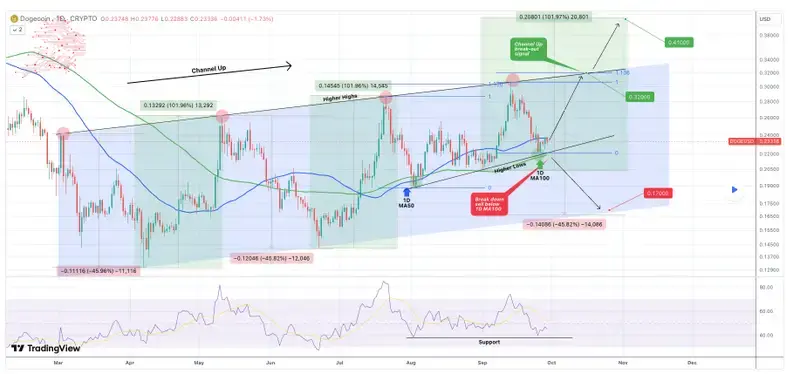 DOGE price analysis chart. Source: TradingView**DOGE price analysis chart. Source: TradingViewThe analyst noted that recent price action has found support along the higher-lows trendline that emerged from the August 3 low, reinforced by the 100-day moving average (MA)
This support level is critical, as maintaining it suggests Dogecoin could test the upper boundary of the channel, aligned with the higher-highs trendline, during October.
To this end, TradingShot’s technical projections indicate that a successful rebound from this level could see Dogecoin reaching a target of $0.32, corresponding to the 1.136 Fibonacci extension of the prior move
TradingShot’sIf Dogecoin closes a daily candle above the channel’s upper boundary, it could surge over 100% to $0.41
Conversely, a drop below the 1D MA100 would signal a bearish reversal, potentially pushing it down to $0.17, reflecting past declines of about 45% from channel lows.
DOGE price analysis
By press time, DOGE was trading at $0.23, having corrected by almost 0.5% in the last 24 hours. On the weekly timeframe, the meme cryptocurrency has plunged almost 5%.
The 200-day SMA at $0.2088 provides solid long-term support, highlighting an enduring bullish undercurrent as the price remains well above this level, avoiding a death cross and hinting at sustained recovery potential.
Complementing this, the 14-day Relative Strength Index (RSI) of 44.78 indicates neither overbought nor oversold territory, suggesting balanced momentum poised for upside if buying pressure builds to breach the 50-day SMA.
Featured image via Shutterstock
Featured image via ShutterstockFeatured image via Shutterstock