




Square
Following
Hot
News
Profile
Share your thoughts
placeholder
Article
🤯 The gold/copper ratio cycle used to last ~1,000 days. This one? Almost 1,900 days — nearly DOUBLE. Copper just started outperforming gold WITHOUT the cycle resetting to the bottom. Mariano connects the dots at 9:56 in today's video.
📊 Chart idea: @CryptoCrewU
#Gold #Copper #Macro #Bitcoin #Crypto
post-image
XAU-0.29%
XCU-2.88%
BTC-3.44%
  • 1
BTC Update
live-cover
LIVE1,888
#GateWCTCS9GlobalTradingCompetition
🏆 WCTC S9: THE GLOBAL TRADING BATTLE BEGINS — STRATEGY, DISCIPLINE & REWARDS! 🚀
The next big trading challenge is here! Gate WCTC S9 is bringing the global trading community together for a new season of competition, market discussions, trading insights, and exciting reward opportunities.
With a 50,000 USDT prize pool plus GT rewards, WCTC S9 is an opportunity for eligible participants to put their trading knowledge, discipline, and decision-making skills to the test.
But remember one thing: successful trading is not simply about making more trades. It is
GT-4.87%
BTC-3.44%
I just opened a quick short trade at $PYTH
and am entering now, with a sell price of 0.08720 or 0.08850; the first target is 0.08600, the second target is 0.08500, the third target is 0.08400, and the final target is 0.08300++; set the stop-loss above 0.09350. There is strong resistance around 0.08800, where a large number of sell orders will appear
post-image
PYTH+5.05%
Many people rush to buy the dip as soon as the price falls below the moving average, mistaking “cheap” for “safe.” The role of a moving average is not to predict the bottom, but to tell you whether the trend has been broken. Taking $BAT as an example, the current price of 0.1727 has moved above MA5 (0.1704), but remains capped by MA20 (0.174935). The MACD histogram is negative, indicating that bearish momentum has not been fully released and that only a short-term recovery has emerged.
A truly reusable assessment is: only when the price recovers MA5, MA5 begins to flatten, and RSI rebounds fr
post-image
BAT-10.26%
PUMP-14.73%
CHIP-19.54%
  • 1
If you're talking about a decline, there are only these two ways it can go—no other options. No matter how much it rises, the appearance of a second buy point on the daily timeframe is what marks the start of a bull market. Otherwise, relying solely on the 4-hour timeframe, 120k is absolutely impossible. In other words, even if it rises to 9–9.5, it still needs to form a second buy point on the daily timeframe
post-image
🔹The U.S. Dollar Takes a Roller-Coaster Ride! All post-CPI gains are wiped out. Why is the market n
live-cover
LIVE2,061
🪨 BLACKROCK & ETFs SELL $261.46M IN BITCOIN!
WALL STREET IS SELLING BITCOIN!
post-image
BLK+0.58%
BTC-3.44%
Day-session outlook;
Ethereum needs a corrective rebound
2390-2420-2490 can be traded for rebound profit opportunities
Note: The broader trend remains dominated by bears. If resistance at 2540-2580 is not broken, a new round of lows is still expected.
Long- and short-term trades are different; both monetize knowledge, experience, and technical skills.
It varies from person to person
Good luck to everyone!!!
post-image
ETH-6.15%
Short-position setups for two consecutive days, precisely capturing profits
$US
, I thought it could become a meme coin, but it turned out to be a bottomless pit, falling with absolutely no floor. Positions are all flowing out, and there hasn’t been a single decent rebound.
post-image
US-22.71%
Now, for retail investors looking to earn their first 1 million, the easiest move is to buy 5,000 $uni
post-image
UNI-6.07%
Any bosses here who trade A-shares? Is this kind of situation common?
post-image
👇🔲Gold Medal Finance | Fed rate hike probability surges
1️⃣ U.S. September CPI data rose more than expected, with inflationary pressure resurfacing
2️⃣ CME shows the probability of a Fed rate hike in October surged from 22% the previous day to 50%
3️⃣ Traders expect at least one rate hike before year-end, plus three more in total by the end of 2027
4️⃣ As rate hike expectations heat up, risk assets are under pressure, and the crypto market needs to be wary of short-term correction risks⚠️
post-image
CME+2.70%
  • 1
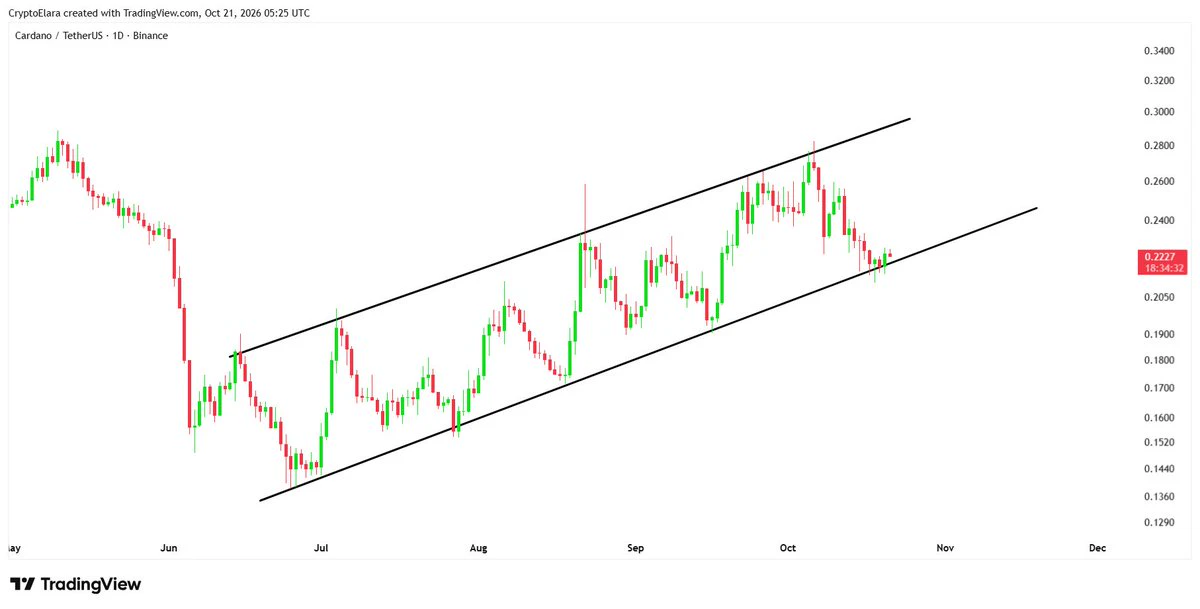
$ADA Current price is 0.2207, while the lower Bollinger Band at 0.2198 is the only valid defense line at present; the MA20 at 0.2273 above is the watershed the bears must reclaim. This is not an ambiguous position, but a multiple-choice question.
Use this coin to explain a reusable chart-reading method: use “moving average alignment + RSI position” to determine whether a trend is healthy. In a healthy downtrend, MA5 should continue to suppress MA20, while RSI consolidates in the 30-40 range; a healthy rebound requires the price to first reclaim MA5 and RSI to exit the oversold zone. ADA’s cur
post-image
AVAX-6.69%
BREAKING NEWS: 10 ALTCOIN GEMS FOR THE 2027-2028 CYCLE 💎
I have compiled 10 altcoins with the potential to rise 100-500% in a bullish scenario in 2027/2028.
This selection ? is based on fundamental, technical, on-chain, and news analysis, as well as whale accumulation (transparent transactions).
- So it is not just guesswork based on drawing lines.
The complete list along with its analysis ?
can only be accessed through X subscription: prepare your watchlist early before the next cycle begins.
I am providing: just 1 example: $SUI
post-image
SUI-6.60%
$ORBIO /USDT Perp – "Extended Downtrend – Short"
​Trading Plan Short: ORBIO
​Entry: 0.02508
​SL: 0.04381
​TP1: 0.02620
​TP2: 0.02382
​ ORBIO is down -37.43% and experiencing a sharp breakdown from the 0.04381 high. MACD is deeply negative; targeting the 0.02382 low.
#ShareWeekly
post-image
ORBIO-40.40%
$ZEC Short-term bearish; shorting rebounds is currently the more cost-effective choice.
First, here is a reusable chart-reading method: use the moving-average alignment to determine whether the trend is healthy. When MA5 crosses below MA20 and continues trading beneath it, while both move downward in tandem, it indicates that the medium-term trend has weakened. At this point, a rebound is more likely to be a correction than a reversal. Currently, $ZEC 's MA5=1122.12 is significantly below MA20=1163.66, and the moving averages are bearishly aligned—this is the first sign that the trend is unhea
ZEC-12.98%
SOL-5.31%
$PEPE What is most worth watching is not the rise or fall, but that while the price has moved for a while, participation has failed to keep up. I would rather lay out the bearish case first.
Bears see the risk after a break below 0.00000381, while bulls need to prove that buyers remain after a breakout above 0.00000426. Current volume is 0.16x.
The current price is 0.00000391, about 2.56% above the 1-hour support at 0.00000381 and about 8.95% below the resistance at 0.00000426. The position determines which side is more anxious; the next level to watch shifts to 0.00000376.
Waiting for the bou
post-image
PEPE-7.44%
Load More

Join 40 M users in our growing community

⚡️ Join 40 M users in the crypto craze discussion

💬 Engage with your favorite top creators

👍 See what interests you

Trending Topics

USSeptemberCPITopsEstimates

36.55k Views2.65k Discussing

US September CPI rose 3.7% YoY, above the 3.6% estimate; core CPI rose 2.6%, also above the 2.5% estimate. With inflation topping forecasts across the board, how will rate hike expectations shift? How will BTC react? Share your view.

DrLinHanSpeaksAtOxfordUnion

135.39k Views1.86k Discussing

USSeptemberPPIReleased

91.08k Views1.72k Discussing

View More