Square
Following
Hot
News
Profile
Share your thoughts
placeholder
Article
Bullish on $SOCKS
post-image
$FIL5L This is very unreasonable—is it fun to play like this? What a joke, right?👎
post-image
🚀 GT/USDT Technical Insights: Is GateToken Preparing for a Bullish Reversal at $10.00 Support?
Pair: GT/USDT (Spot)
Current Price: ~$10.42
24h Range: $10.00 – $10.45
24h Volume: ~67.70K GT (~$691.81K turnover)
📊 1. Key Technical Breakdown Across Timeframes
1-Hour Chart (Short-Term Recovery):
GT tested strong psychological support around $10.00 before staging a clean V-shaped rebound back above $10.40.
Short-term EMAs (EMA5 at 10.38 and EMA10 at 10.33) are sloping upward, crossing above the short-term Moving Averages, signaling early bullish momentum in micro-timeframes.
MACD has fli
GT+0.28%
  • 4
We are getting closer to $4M in fees per day on Hyperliquid again.
Add the $500k from the yield reserve and we are already there
post-image
HYPE+1.43%
$ICNT Up 21% in half a day, it surged straight from 0.1015 to 0.1371, with 13.7M in trading volume pouring in. That’s not the kind of volume retail investors can generate. I took a quick look on-chain just now: the top 10 addresses’ holding concentration hasn’t declined, indicating this move is not distribution but someone accumulating. On the macro side, here’s an anchor: during the week when the Fed minutes leaned hawkish, the 30-day correlation between altcoins and the Nasdaq surged to 0.78. Small-cap assets like ICNT have higher beta, so as long as rate-hike expectations don’t rebound, it
ICNT+23.50%
Many people see the funding rate turn positive and MACD turn green and automatically assume “the bulls are back,” then chase in with oversized positions—this is the most common position-sizing mistake: treating indicator direction as an entry signal while ignoring the moving-average structure and volatility levels. $BERA is a textbook example of this trap.
First, the structure: current price 0.2284, MA5=0.2311 remains below MA20=0.231595, and the short-term moving average has not crossed above, meaning the bearish alignment has yet to be repaired; RSI=47.3 is stuck in the neutral-to-weak zone
post-image
BERA-6.12%
1016 $DOGE Recent entry position for DOGE—just look at the daily chart. Every time the broader market makes any move, DOGE starts falling in advance.
I've bought at 0.06888 many times before and played the August range quite a bit. The last time, I held DOGE until it started moving at 0.083 and then exited. I haven't really watched DOGE since, because I think DOGE can sometimes be difficult to trade short-term.
We'll continue placing long orders around 0.06888 and 0.07, with a stop loss at the bear-market low of 0.067. Keep the stop-loss range slightly wider. Leave this long-term lottery orde
post-image
DOGE-0.55%
Midnight's newly published roadmap targets tokenized deposits, private lending and private swaps for Q4 2026. NIGHT staking and community block production are slated for Q1 2027.
@MidnightNtwrk
NIGHT-0.87%
Social experiment but after confirming villian monkey is behind the “Neymar” token.
I recant my post. I do not endorse this token or encourage anyone to buy after new evidence.
If you still buy, it’s at your own risk. Enjoy your day. 👍🏾
post-image
Excited to share our portfolio snapshot! 🚀 Focused on DeFi, yield farming, and funding arbitrage for optimal gains. 📊 Dive in and explore the insights below! #Crypto #Trading #Portfolio #DeFi
Ready to start your journey?
post-image
CPI Comes in Hotter Than Expected
live-cover
LIVE88
10.16 Gold $XAU Recent Strategy Gold has been moving sideways within this range since falling at the end of September, with 4220 on the upside and 4110 on the downside. We have gradually sold high and bought low several times here.
Here is what we are doing now: 1. Short-term strategy: go long at 4100, exit around 4200, with a hard stop-loss at 4020. 2. After playing a few short-term rounds, switch to a long-term position (you can choose PXAG due to the high weekend fees). The unchanged point for both long-term and short-term trades is going long at 4100 with a stop-loss at 4020; the only dif
post-image
XAU+1.54%
  • 3
CPI Comes in Hotter Than Expected
live-cover
LIVE64
Are you tired of watching me win yet?! 🏆
We are just getting started! ✅️
Let's go make that money! 💰
Structure, no smoke! 🔥🐶🔥
Does a bullish moving-average alignment always mean you should chase long positions?
Not necessarily. The key is whether the price’s position relative to the moving averages is synchronized with momentum. Take $ZEC as an example: the current price is 1235.97, with MA5=1225.24 above MA20=1138.62, forming a standard bullish alignment and indicating a healthy trend direction; however, RSI has reached 70.2, nearing overbought territory, while the price is hugging the Bollinger upper band at 1248.36, making the risk-reward of chasing short-term highs unattractive. A reusable approach is: use movin
post-image
ZEC+9.10%
XPL+7.13%
INJ+10.95%
With the same 1000U, some people are holding the bag at $WAL 0.0677, while others who bottom-fished at 0.0502 are already laughing. It is now 0.0512, down 15.7% in 24 hours, with a 565M trading volume—what does that indicate? Panic sellers are fleeing, but with selling this fierce, who is taking the other side?
Round one: the volume showdown. A 565M trading volume at this market-cap level means the turnover rate has been pushed to the limit. Rising volume during a decline either means the main players are unloading or that the market is shaking out and rotating holders. What is the difference
WAL-21.09%
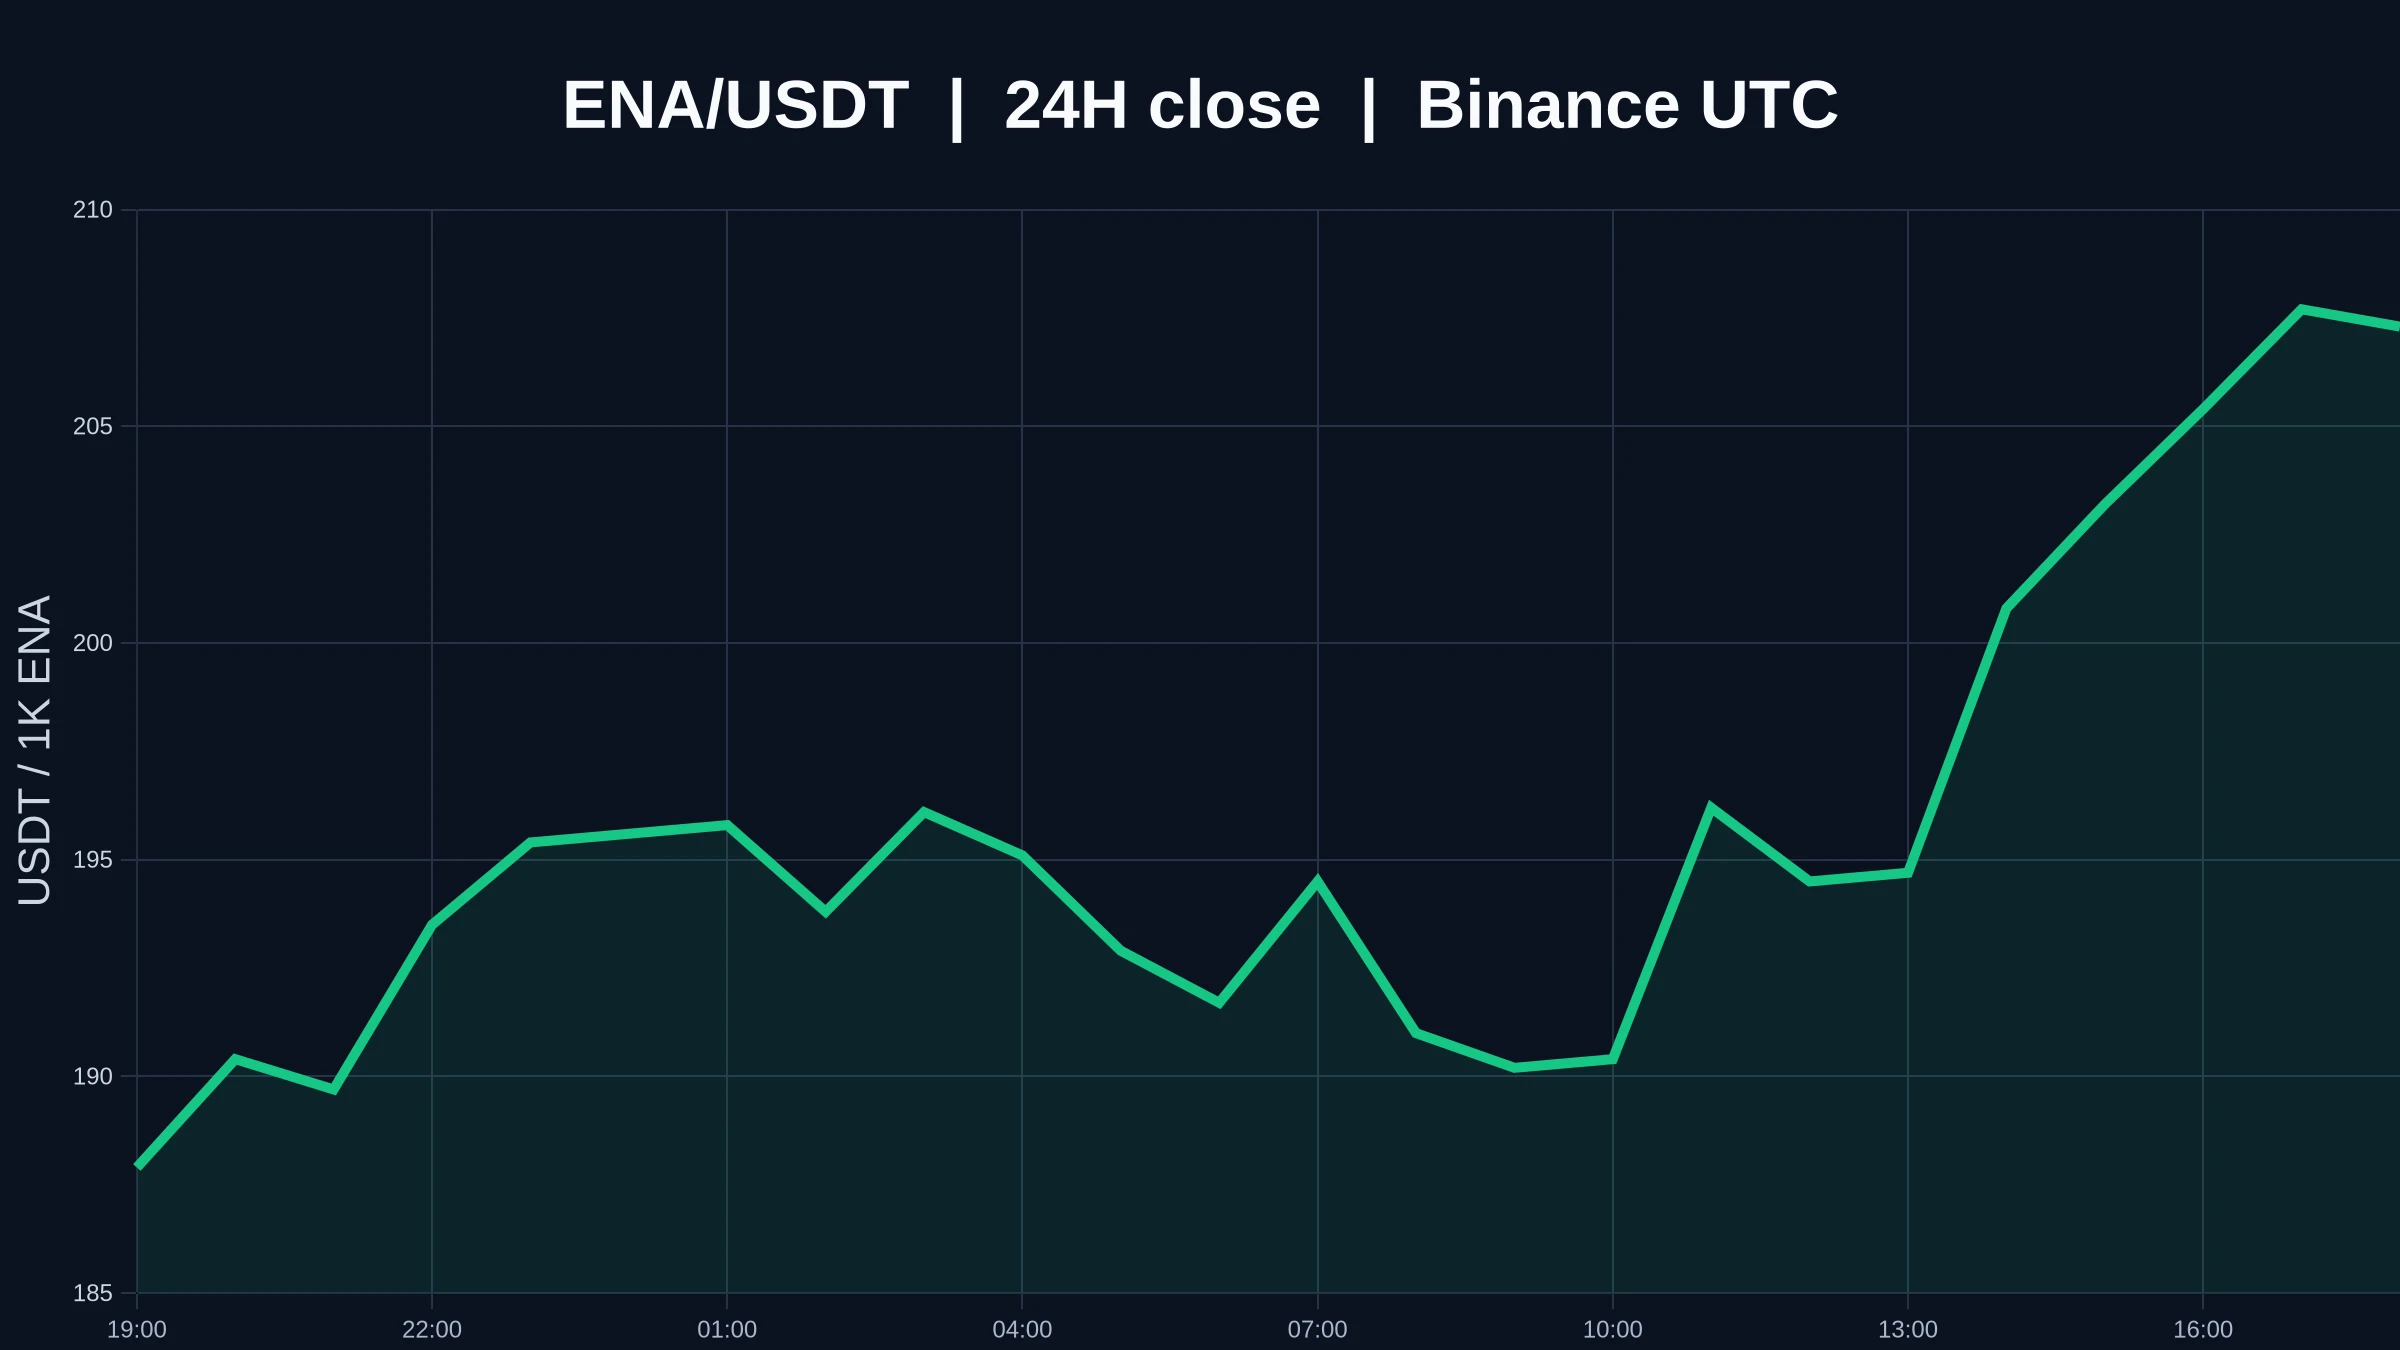
$ENA Right now it feels like a multiple-choice question with no standard answer, but the answer will not be hidden in emotions.
First, let’s copy the full question: $ENA is currently at 0.2051, up 4.32% over 24 hours. The 1-hour support is 0.1825, resistance is 0.2069, and current volume is 0.43 times the average volume of the past 20 candles. The 1-hour trend is strong, with RSI at 80; the 4-hour trend is strong, with RSI at 46.
The angle I’m watching is that $ENA remains strong, while the crowded positioning is already on the table. I acknowledge that the trend is strong, but what matters ne
post-image
ENA+4.73%
Ledger response to the recent supply chain attacks: $899 pls. Ps don't drop it
post-image
$OP
This move is pushing from 0.1397 toward 0.1418, up more than 13% over the past 7 days, while open interest is piling up as longs keep adding and driving it higher🚀 The wildest part is that shorts are effectively paying to stay in, having to hold on while funding remains negative. The pressure isn’t a bad thing—it’s an early-entry position. Break through 0.1418 and jump aboard.
post-image
OP+0.48%
Careful, @crocat_x is an impersonator and most likely a rug!
Report.
The official crocat:native X is @CroCat_Token with CA 0x7Eb480c734eC5f6bd2B918F7393b59D59913DFFA
This is a good reminder as Cronos is getting more succesful, rugs and rats are also coming back.
Invest with eyes open, very easy to run in to these!
post-image
CRO+0.20%
Load More

Join 40 M users in our growing community

⚡️ Join 40 M users in the crypto craze discussion

💬 Engage with your favorite top creators

👍 See what interests you

Trending Topics

USSeptemberPPIBeatsExpectations

91.35k Views1.88k Discussing

US September PPI came in at 6.3% YoY, well above the 5.3% market expectation, pointing to renewed producer-side inflation pressure. Weekly jobless claims were 199K, broadly in line with forecasts. Could hotter inflation further reduce room for rate cuts, and what does it mean for $BTC, US stocks, and gold?

DrLinHanSpeaksAtOxfordUnion

135.63k Views1.86k Discussing

JapanAndKoreaStocksPlunge

47.27k Views1.76k Discussing

View More