Share your thoughts
placeholder
Article
Everyone’s staring at SUI’s range—but the 4H tape is quietly loading the short that nobody’s ready for.

$SUI /USDT - SHORT

Trade Plan:
Entry: 0.7908 – 0.7958
SL: 0.8177
TP1: 0.7750
TP2: 0.7628
TP3: 0.7445

Why this setup?
Why now? The 1D is *range*, not trend—so we fade the top, not chase it.
- Price sits at 0.7933, with RSI (15m) at 46.6: no buying pressure to break out.
- ATR (1h) at 0.0101 means tight stops—but our SL at 0.8177 gives a 3% buffer against a fake pump.
- TP1 at 0.7750 is the first magnet; if that cracks, TP2 at 0.7628 opens a fast 200-pip slide.
This is a low-conv
post-image
SUI-1.02%
This long trade was actually quite uncomfortable. Right after entering, I got hit by a fake breakout wick, which nearly took out my stop-loss at a key level. I didn’t cut the position at the key level because volume had not expanded; instead, it looked more like a shakeout. The market then saw a series of small bullish candles, with the battle between bulls and bears quickly shifting in favor of the bulls. When the price reached around 87.793, I took profit on 70% of the position and moved the stop-loss on the remaining position above breakeven. The profit is currently at +519.96%, and the rem
post-image
ETH+0.49%
SOL+1.89%
I didn’t chase $EDGEX when it surged during the day, as a long-term trendline was right above it and it would have been difficult to place a stop-loss after entering. I waited for it to pull back and regain its footing before entering a long position based on the lower-timeframe structure.

After entering, it consolidated for a while. I didn’t rush to trade back and forth; once the price moved a certain distance away from my cost basis, I first closed 80% to lock in the profit on the core position, leaving the remaining 20% to follow the trend.

After the breakout candlestick appeared, I too
post-image
EDGEX-1.76%
XRP-0.91%
LAB-2.88%
Bought some tomatoes today and one was a $NUKE ☢️,☢️
post-image
$UAI bounced after plunging 25%; my long position entered at 0.42 is still open, with an unrealized profit of 42%, but I didn’t exit at 0.69 just now and am kicking myself. This coin’s volatility is extreme: its 24-hour price range is 45%, and the $180 million trading volume shows that bulls and bears are aggressively rotating positions.
My view: short-term support is at 0.55; breaking it would mean a deep drop to 0.48. 0.62 is the key level above; if it fails to hold, I’ll short. I’m reducing my position by one-third to lock in profits, and moving the stop-loss on the remainder to 0.55.
If v
UAI+23.90%
This was purely the market being in a good mood and casually tossing out some gold coins—they just happened to land on my head. When the screen was glowing green, I posted a long-entry alert at this level, and hardly anyone believed it at the time. Now $OKB has risen from 89.13 to 112.77, with floating profit at +653.07%; the brothers on board should be laughing in their sleep. After the pullback held and buying strengthened, we nailed the rhythm of this move from start to finish. The first target has been reached, so I’m taking 80% off the table to lock in the profits, and using a trailing s
post-image
OKB-0.73%
BTC-0.45%
SNDK+0.25%
respect the pump.
$LINK
PUMP+2.13%
🚀 Solana just crushed it with $348M in real-world asset inflows this past month, outpacing all competitors! That's a staggering 11.13% jump! 🤑 What could this mean for $SOL 's future? #Blockchain
SOL+1.98%
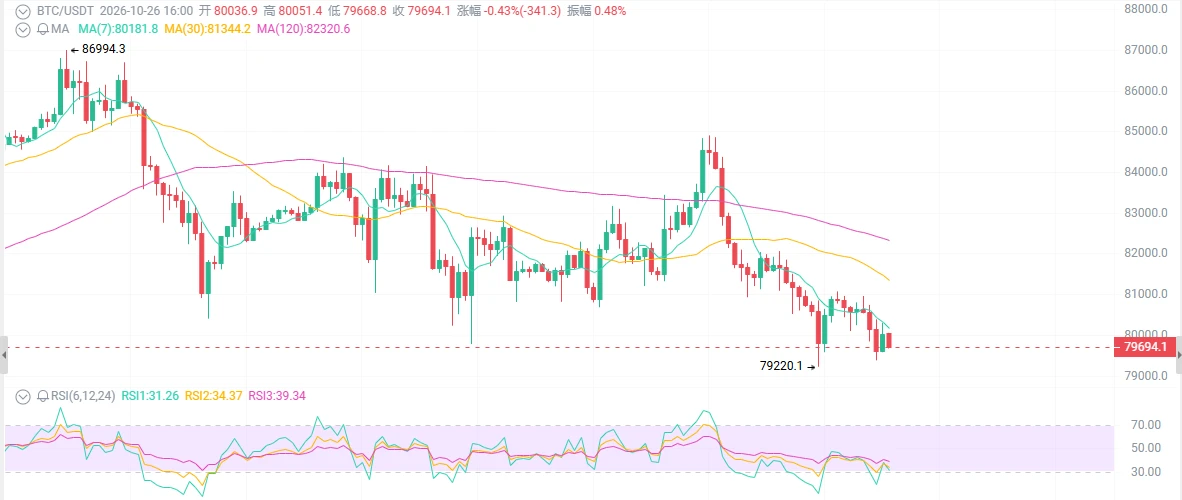
Everyone’s staring at $BTC /USDT’s breakout—but the 4h just whispered a secret that flips the script.

$BTC /USDT - SHORT

Trade Plan:
Entry: 79656.5 – 79778.1
SL: 80301.0
TP1: 79279.6
TP2: 78987.7
TP3: 78550.0

Why this setup?
Why now?
- 1D is *range*, not trend—so longs are borrowing trouble.
- RSI (15m) at 49.44 = zero momentum fuel; we’re stalling right under resistance.
- ATR (1h) at 243 shows calm—but calm before the 4h dump, targeting TP1 79,279 first.

Debate:
Is this the fake pump before the 4h flush, or are you fading the range too?

⚠️ Personal market analysis only. NFA —
BTC-0.45%
[New Streamer] Whales Move in Sync!
live-cover
LIVE1,045
$1000CAT 24 hours plunged 24%, falling straight from 0.0029 to 0.0021, with $19.9 million in trading volume—meaning it’s not that nobody is buying; everyone who did got buried. BTC has no direction today either, the Fed is turning hawkish again, and risk assets are all shaking, so it’s normal for an altcoin cat to get no love in conditions like this. But let me tell you, the more blood in the streets, the more you should watch those that refuse to die.
Let’s look at the data first: $1000CAT saw declining volume at 0.0021, and the profit-taking from the previous move up to 0.0029 has basically
BTC-0.41%
MEME-3.49%
These returns have me feeling nervous, worried that the market will come to its senses tomorrow and blacklist me.
When I opened the chart this morning, it was still grinding sideways. The key was that the bottom held, while volume was quietly picking up and signs of funds entering were all too obvious. With a signal like that right in front of me, not taking it would have been letting all those late nights down. So I entered directly at 91.82, set my stop-loss, closed the software, and went back to work.
When I returned to my computer, the price had already reached 103.5, with the position’s r
post-image
ADA-0.73%
SNDK+0.25%
Everyone’s staring at 0.849, but the 4H just whispered a secret about PONS that most will ignore.

$PONS /USDT - SHORT

Trade Plan:
Entry: N/A – N/A
SL: N/A
TP1: N/A
TP2: N/A
TP3: N/A

Why this setup?
- 1D is *range*, not a breakout—so chasing longs is a trap.
- RSI on 15m at 42.93 = weak bounce fuel, not reversal strength.
- SHORT bias armed at 0.849 with 55% confidence: the edge is fading rallies into resistance, not buying dips.
- Why now? The 4H timeframe says the path of least resistance is down while price hugs the middle of the range.

Debate:
Is 0.849 the ceiling for PONS thi
PONS-11.13%
$SUSHI Signal】Long + 1H pullback to EMA20
$SUSHI After surging to 0.2828 on the 4H chart, price retraced to 0.2445 and is now near the 1H EMA20, with order book imbalance at -13.18% and 1H MACD bearish momentum expanding.
🎯Direction: Long
⚡Entry/Limit order: 0.243766 - 0.244500
🛑Stop-loss: 0.242055
🚀Target 1: 0.248167
🚀Target 2: 0.250001
🛡️Trade management:
- Execution strategy: After reaching Target 1, reduce the position by 50% and move the stop-loss up to breakeven. If the price falls back to the entry level, exit automatically to protect the principal.
In-depth logic: OI is stable, a
post-image
SUSHI+1.08%
$BTC Signal】Short continuation: 1H breakdown + 4H death cross
$BTC The 1H lower Bollinger Band has been breached, the MACD histogram continues to weaken, and the 4H bearish trend is confirmed simultaneously.
🎯Direction: Short
⚡Entry/Pending Order: 79312.930 - 79490.200
🛑Stop Loss: 80376.550
🚀Target 1: 78160.675
🚀Target 2: 77495.912
🛡️Trade Management:
- Execution strategy: After reaching Target 1, reduce the position by 50% and move the stop loss up to breakeven. If the price falls back to the entry level, exit automatically to protect the principal.
Aggressive selling pressure in the or
post-image
BTC-0.45%
ZEC has climbed nearly 1,000 points in three months! Has September reached the fish tail, or is the bull’s head just beginning?
As early as when ZEC was at 800, Qingyao posted to remind everyone! 1,100 is our ultimate target! Shipan also genuinely banked 300 points, and the market performance exceeded expectations! But the fish tail has too many spines, so we chose not to eat it! Many people say to blindly go long and buy the pullback. I even saw someone say to go long to 2,000? All I can say is, the more skilled you are, the bolder you become!
As for the altcoin sector, I have always emphasiz
post-image
ZEC+17.05%
  • 3
So my babe gave me this to eat to console myself for the Chelsea loss tonight. This is a win to me!
post-image
Dollar surges, gold plunges $70, Dow drops 380 points—a cross-asset massacre triggered by one data release
After the nonfarm payrolls release, the U.S. Dollar Index instantly climbed 35 points, rising from 99.035 to 99.932, up 0.5% intraday. The 10-year U.S. Treasury yield jumped 5 basis points. Spot gold plunged $70 in a short period, briefly falling below $4,400 per ounce, down 1.66% intraday.
But one detail is particularly intriguing: Gold’s decline was clearly larger than the moves in the dollar and yields would suggest. Analysts at HuiTong Finance pointed out that this indicates technical
MU+5.89%
A surprised $319m airdrop is coming to Solana users all over the world.
Stay updated for the day it'll happen and be active.
Generational wealth is here!
SOL+1.98%
Load More

Join 40 M users in our growing community

⚡️ Join 40 M users in the crypto craze discussion

💬 Engage with your favorite top creators

👍 See what interests you

View More