Square
Following
Hot
News
Notifications
Profile
Share your thoughts
placeholder
Article
💰 Your stock insights deserve rewards—and to be seen
What signals do you look for when you’re bullish on a company? What concerns make you decide to keep waiting?

Join Gate Square’s stock discussion season to share your views and the reasoning behind them.
🌟 Each day, 3 quality creators will be selected to receive 5 USDT each, plus official featured placement to help more people see their valuable content.

Selection isn’t based on correctly predicting price movements or the number of posts. Well-supported opinions, valuable observations, and thoughtful reviews all have a chance to be selec
GateSquare
💰 Your stock insights deserve rewards—and to be seen
What signals do you look for when you’re bullish on a company? What concerns make you decide to keep waiting?

Join Gate Square’s stock discussion season to share your views and the reasoning behind them.
🌟 Each day, 3 quality creators will be selected to receive 5 USDT each, plus official featured placement to help more people see their valuable content.

Selection isn’t based on correctly predicting price movements or the number of posts. Well-supported opinions, valuable observations, and thoughtful reviews all have a chance to be selected.

Sign up first, then #Gate股票畅聊季 publish original content👇
👉 Sign up now:
https://www.gate.com/campaigns/6898
📄 Event details:
https://www.gate.com/announcements/article/102611
repost-content-media
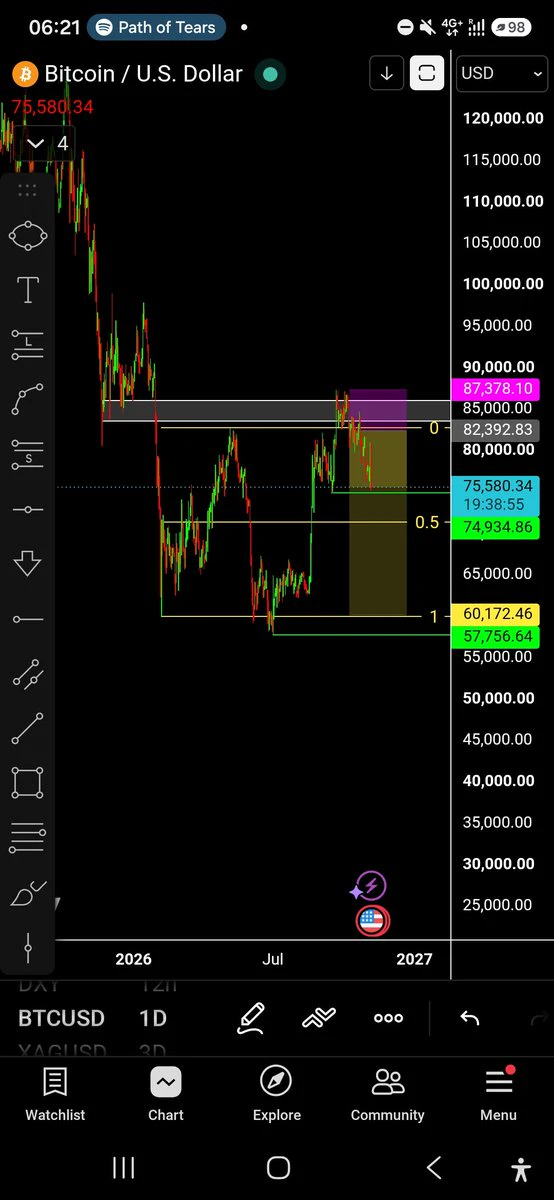
$BTC
My hedge short setup
And levels I'm interested in looking for longs:
Deviation/SFP of upper green line = long
0.5 fib - bounce or deviations = long... Least favorite, 0.5 Fibs usually bring chop
Deviation/SFP of lower green line = long
NOTE: SFP's can get SFP'd
post-image
BTC-0.67%
Trenches
fxUSD
f
bade
b
fxUSD
0x08...d8f6
Market Cap
$.
Change
.
24h Vol
$.
Holders
.
ZIG
Z
bade
b
ZIG
0x8c...1145
Market Cap
$.
Change
.
24h Vol
$.
Holders
.
BTC
B
bade
b
BTC
C5xp...pump
Market Cap
$.
Change
.
24h Vol
$.
Holders
.
CORLA
C
bade
b
CORLA
0xba...7777
Market Cap
$.
Change
.
24h Vol
$.
Holders
.
STONK
S
bade
b
STONK
6GmA...UNgx
Market Cap
$.
Change
.
24h Vol
$.
Holders
.
What is a mean reversion strategy? Why do prices sometimes return to the historical mean after deviating from it, while at other times they continue moving farther away?

In cryptocurrency trading, prices often fluctuate within a certain range. When a price deviates significantly from its recent mean, some traders look for opportunities to trade in the opposite direction, hoping the price will return to its normal range. But mean reversion is no guaranteed market rule. Especially when trends are strong or fundamentals change, prices may continue moving farther away from the mean.

First, what
post-image
I’m planning to hold for the long term. My friend says it could reach 8,000. I’ll be happy with 3,600—I’m not greedy. $SNXX
SNXX-0.43%
#AsiaPacificStocksPlunge 🔬

Is the sea of red in Asia merely profit-taking?

Those fixated on the massive red percentages flashing across their screens during the historic collapse of Asian markets are missing the true paradox: the very companies that ignited the artificial intelligence revolution are now buckling under the political uncertainty of the future they themselves created.

The wave of selling triggered in global markets following the U.S. midterm elections has swept across the Pacific, striking the heart of Asia’s technology sector with the force of a bombshell. In South Korea, th
post-image
User_any
Don’t let the numbers mislead you; those figures don’t point to a market collapse, but rather to an entirely different structural mechanism.

The real story lies within a historic wave of selling—triggered in the artificial intelligence and semiconductor sectors following the U.S. midterm elections—that rippled across the Pacific all the way to Seoul. What unfolded on Thursday, November 5, 2026, was more than just a correction; it was a watershed moment—a stress test for the AI trade, challenging both its valuations and the underlying policy landscape.

Just how severe was the sell-off on Wall Street?

The wave of selling that hit U.S. markets on Thursday marked the sharpest decline in recent years. The Nasdaq tumbled 5.52% to 24,315 points, falling 11.9% from its early-October peak and officially entering correction territory. The S&P 500 dropped 4.36%, while the Dow Jones slid 3.44%, shedding 1,833 points.

The devastation was most acute in the semiconductor sector. The semiconductor index plummeted 12.25% in a single day—its worst performance since March 2020. The stocks on your screen tell the story: Nvidia fell 9.33%, AMD 17.64%, Micron 17.23%, and SanDisk 22.24%, with various Asian ADRs also posting losses exceeding 10%. In total, approximately $2 trillion in market capitalization evaporated in just one day.

What was the hidden cause behind the sell-off?

There isn’t a single reason, but the midterm elections served as the primary catalyst. The Democrats gaining the upper hand in Congress has raised questions among investors as to whether regulations concerning the construction of data centers might become more stringent.

The market has begun to price in the possibility that the development of data centers—the backbone of the artificial intelligence revolution—could slow down due to new energy and environmental regulations. Signals from newly elected officials in states like Texas, Georgia, and Ohio, suggesting potential restrictions on data centers, have further fueled these concerns. According to one analysis, approximately 30% of the projected data center capacity in the United States through 2028 is now at risk due to potential construction delays.

Compounding this, a chip manufacturer’s announcement of a 26% decline in sales for its mobile phone chips has led the market to wonder: is spending on artificial intelligence beginning to cool off?

How did the shockwave from across the Pacific hit Seoul?

The turmoil on Wall Street spread to South Korea the moment its markets opened. The KOSPI index plummeted by more than 8%, falling below the 5,000-point mark and triggering a circuit breaker just three minutes into the trading session.

Korean corporate giants were at the heart of this collapse: SK Hynix shares fell by as much as 11.71% to 1,116,000 won—a sharp reversal, considering the company had reported record-breaking quarterly sales just a week earlier. Samsung Electronics shares dropped 9.98% to 181,400 won. A similar trend emerged in Japan, where Tokyo Electron, SoftBank, and Advantest saw their values decline by 2.58%, 8.59%, and 5.07%, respectively. Because the stock markets in South Korea and Japan are heavily weighted toward the semiconductor sector, they tend to amplify any technology-related shock originating in the United States. What is the secret behind the "-38" figures on the screen?

The extreme figures—such as -38.65% and +38.64%—seen in the leveraged products in the image do not represent a market collapse; rather, they are the result of reverse splits and the structural nature of leveraged ETFs.

For a product designed to deliver triple the daily performance of an index, a 12% decline in the semiconductor index would mathematically result in a drop of approximately 36%. The 38% decline shown on the screen also reflects a price adjustment following a reverse split. Conversely, a product designed to move inversely to the index (betting on a decline) will rise as the index falls. However, because such funds tend to lose value consistently over the long term, they frequently undergo reverse splits. The +38% increase seen on the screen is actually a byproduct of the consolidation process intended to offset the fund's historical loss in value.

In short, these figures are "structural noise" inherent to the nature of leveraged ETFs; they do not reflect the actual performance of the underlying stocks.

Is this a buying opportunity or a new regime?

The market is currently caught between two opposing scenarios. On one side are those who argue that this is merely a temporary correction—a liquidation of overheated positions in the artificial intelligence sector. On the other side are those who believe that AI valuations remain detached from reality and that this is, therefore, not a buying opportunity.

One thing is certain: the market is no longer driven by the same narrative. The triad of valuation, policy, and liquidity is being recalibrated. It would not be surprising to see further macro shocks of this nature until regulations regarding data centers in the United States are clarified. What you should monitor is the distinction between technical price adjustments in leveraged products and the primary market trend; the extent to which the declines in Seoul and Tokyo are driven by regulatory uncertainty in the United States; and whether semiconductor companies—despite these policy-related headwinds—are managing to maintain their order backlogs.

This content is for informational purposes only and does not constitute investment advice.

$MU $AMD $SNDK $TSLA $INTC
#USStocksFaceHistoricSelloff
#GateSquareTradingChallenge #Gate股票畅聊季 #GateStockTalkSeason #ShareWeekly
repost-content-media
HK50+0.15%
JPN225+0.52%
NAS100+1.53%
US30-0.35%
  • 5
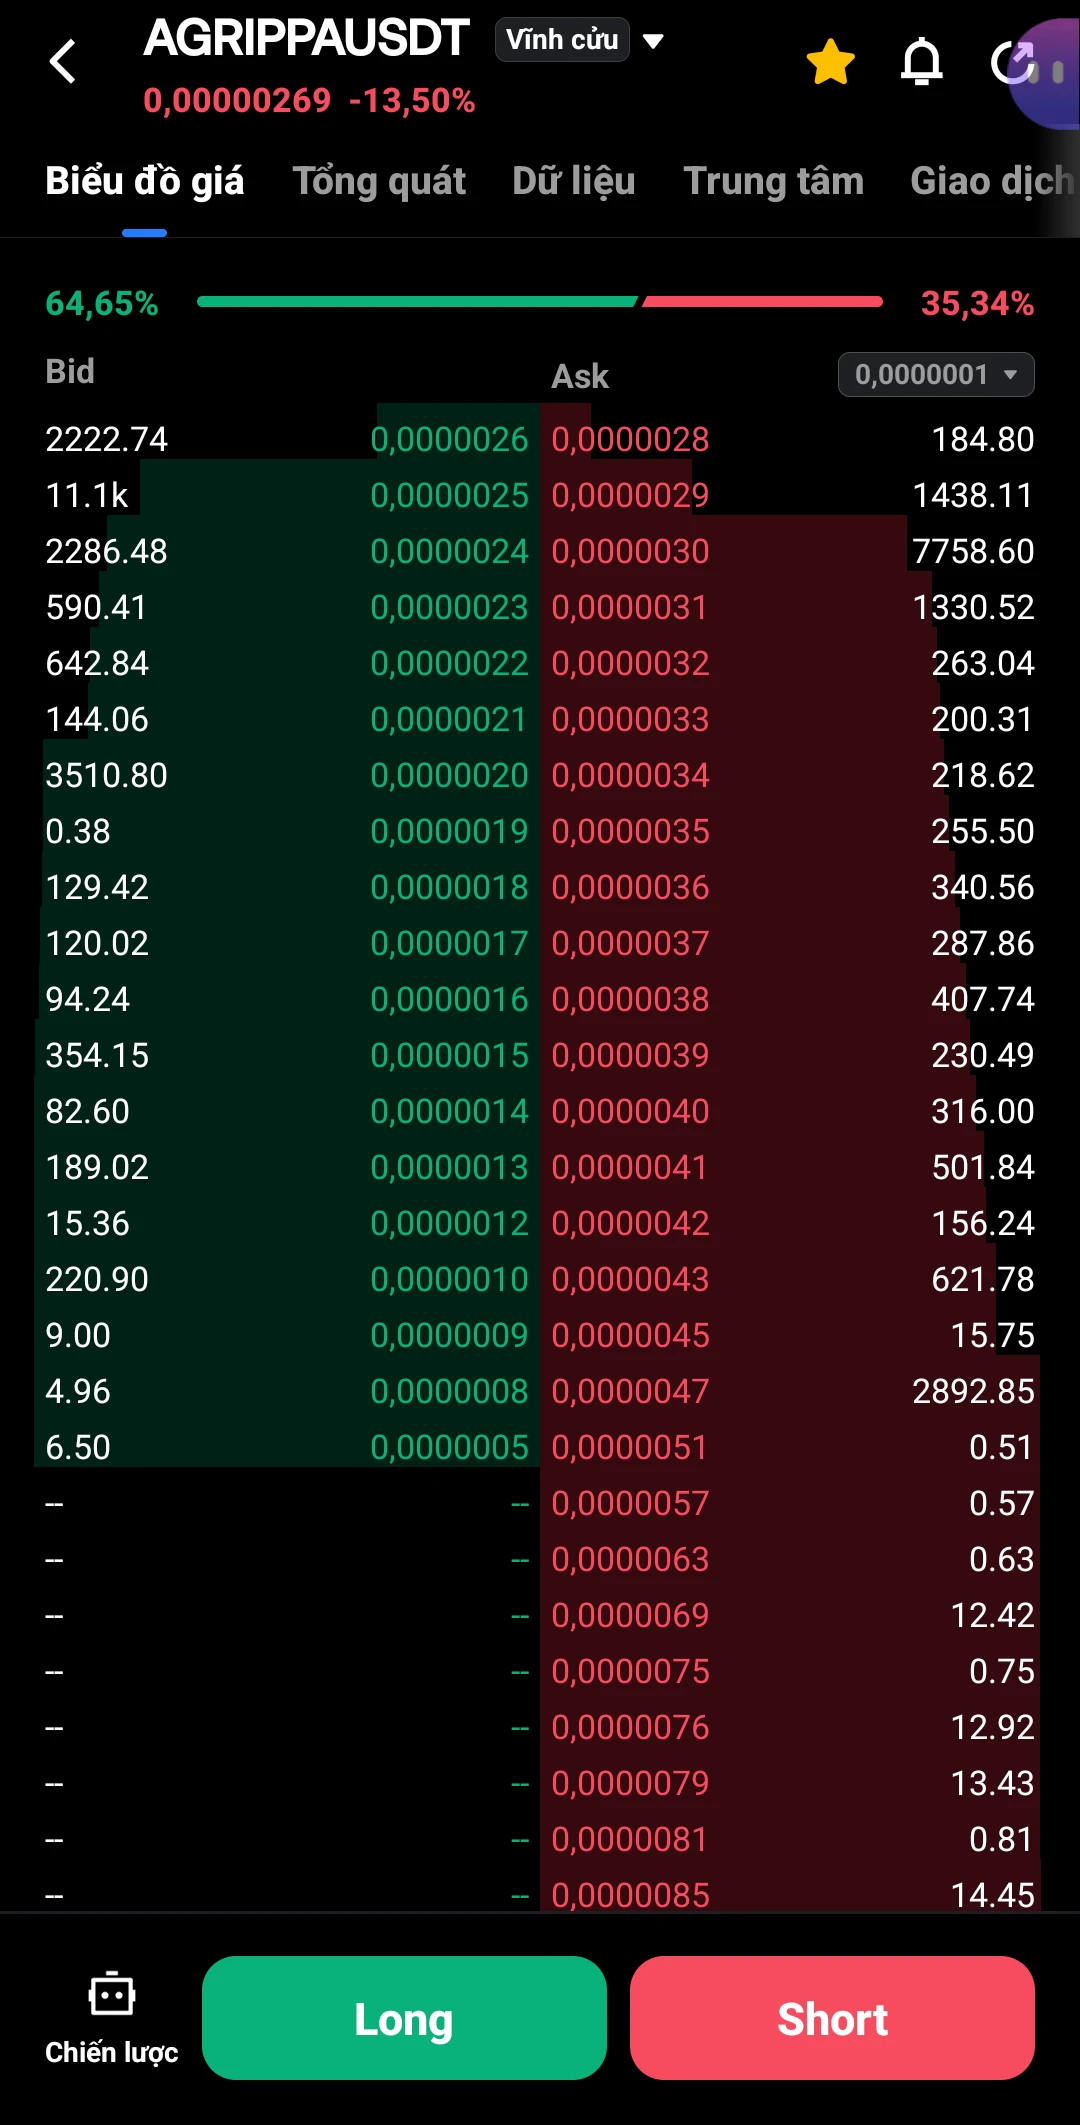
$AGRIPPA Prepare $15K to wipe out Short orders 🎯🚨🚀🔥🔥🔥🔥🔥🔥🚀🚀🚀
post-image
AGRIPPA-9.88%
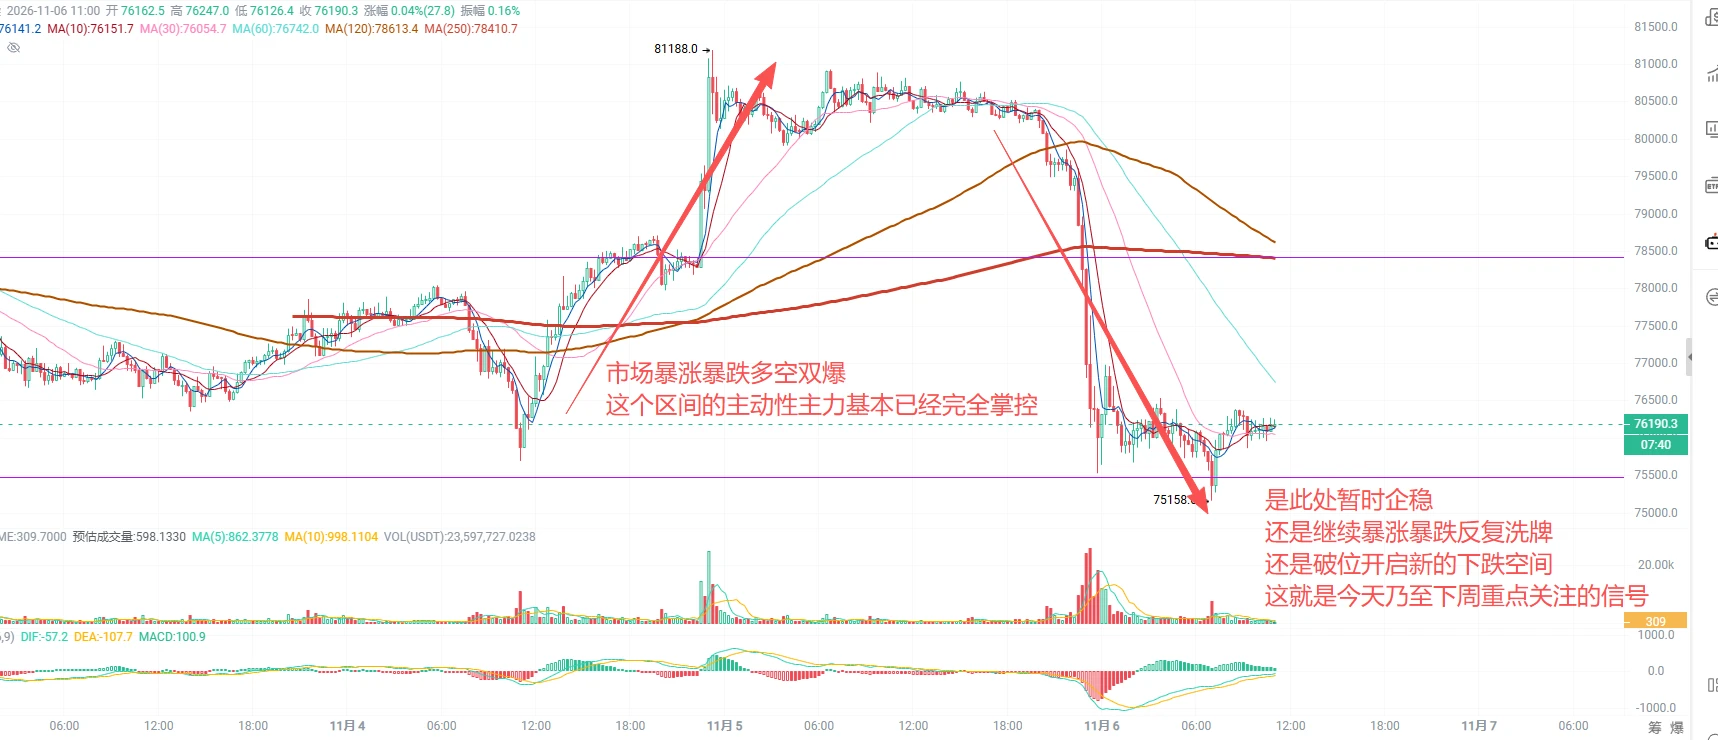
$BTC $ETH Midday Analysis, Nov. 6, published at 12:12 p.m.

The midterm elections are the fuse; last night’s sharp drop was just the appetizer. Tonight will be the hunt. The short on Sandisk at 996 and the short on gold at 4129 both hit their take-profit targets last night. Congratulations to everyone who followed along. Here at Rui Ge’s, all take-profit and stop-loss trades are reviewed so you can learn to respect the market. By reviewing and reflecting with me, you’ll become stronger. If you like the streamer, feel free to follow and watch for a while to see whether a subscription is worthwh
BTC-0.65%
ETH-1.23%
  • 3
How to Build a Complete Trading Plan: From Entry and Stop-Loss to Position Management, So Every Trade Follows a Clear Process

In the cryptocurrency market, some traders watch the market, study indicators, and look for opportunities every day, yet still struggle to develop consistent trading habits.

Sometimes, they get the direction right but exit early because their position is too large; sometimes, they can’t resist moving their stop-loss when the market moves slightly against them; and sometimes, after several consecutive losses, they start trading frequently, hoping to quickly make back w
#黄金突破4100美元 #ShareWeekly
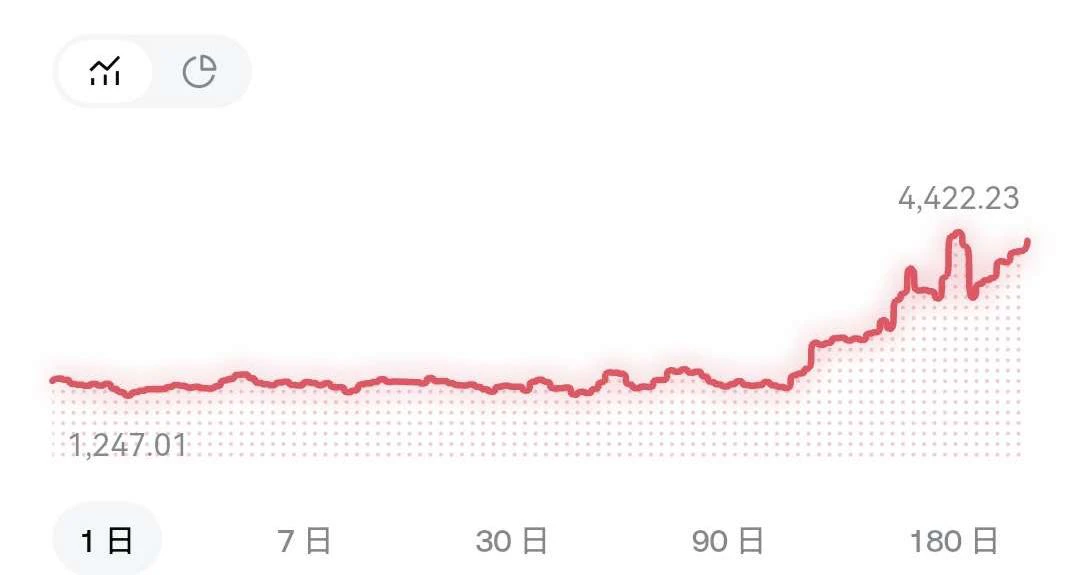
Gold Breaks Above $4,100: Is a New Bullish Era Beginning?
The global financial market is witnessing an important development as gold breaks above the $4,100 per ounce level. This milestone has attracted significant attention from investors, analysts, and financial market participants around the world. Gold has always been considered an important safe-haven asset, especially during periods of economic uncertainty, geopolitical tensions, and changing monetary policies.
But the big question is: What is driving gold higher, and can this bullish momentum continue?
1. Why I
GLDX-0.40%
PAXG+0.37%
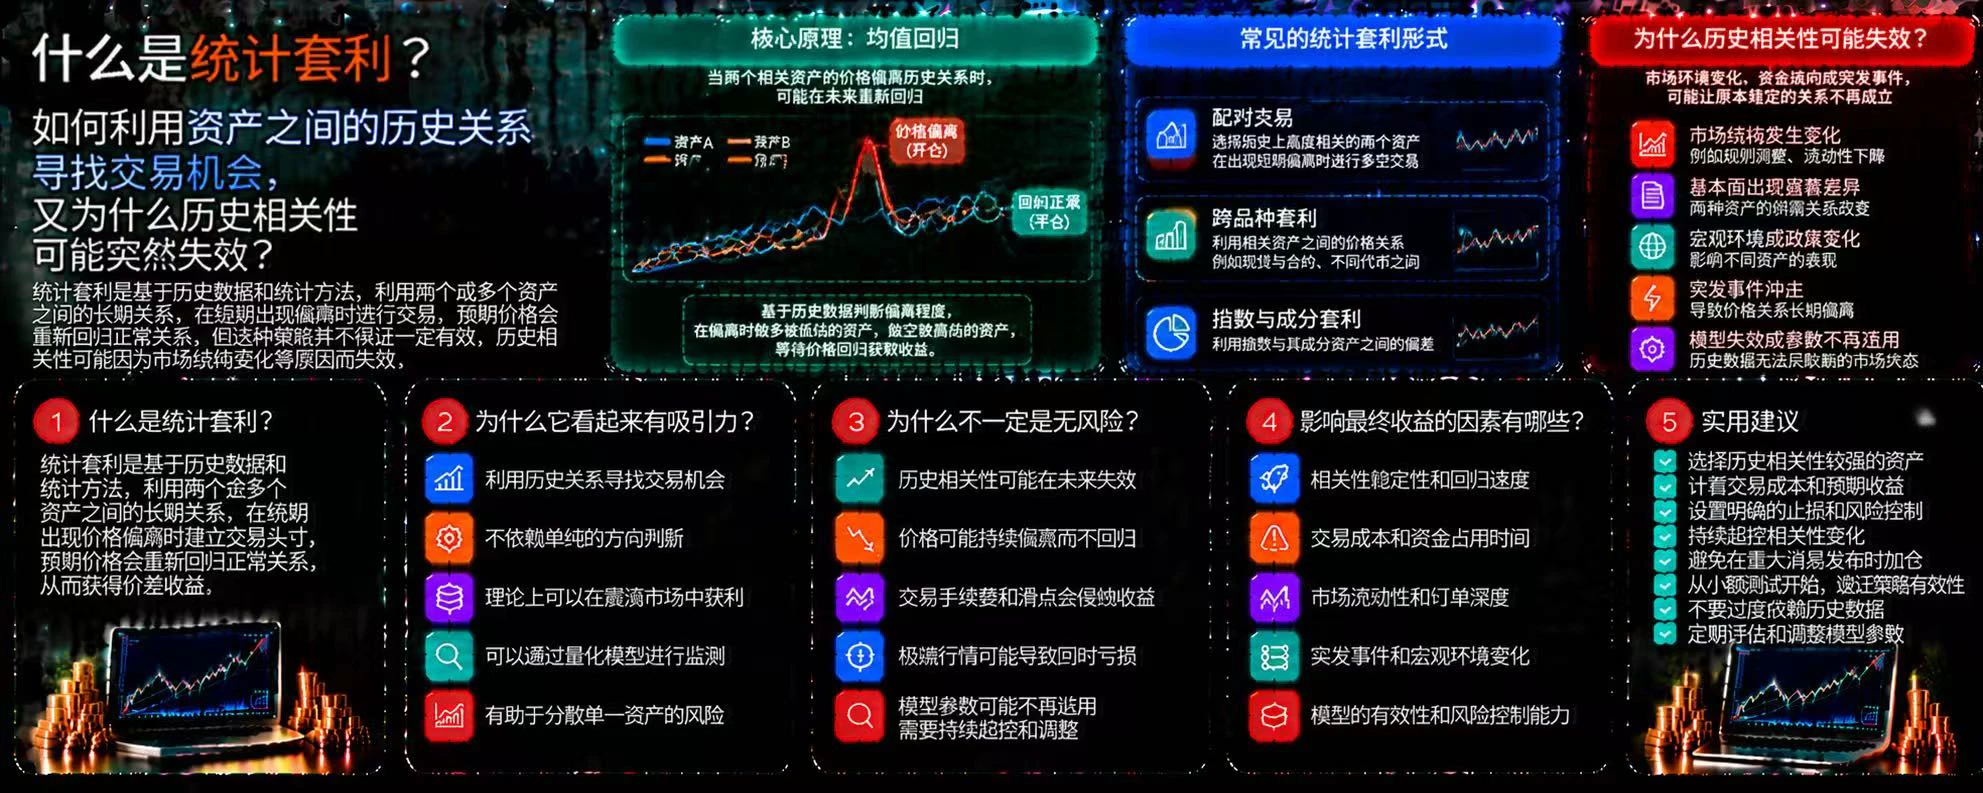
What is statistical arbitrage? How can historical relationships between assets be used to identify trading opportunities, and why might historical correlations suddenly break down?

In the cryptocurrency market, some assets have long exhibited similar price movements. When their historical relationship temporarily deviates, traders may try to exploit the discrepancy. This is the basic idea behind statistical arbitrage, but historical patterns do not guarantee that they will repeat.

First, what is statistical arbitrage?

Statistical arbitrage is a type of trading strategy that uses historical
post-image
#WCTCS9 2026.11.6 BTC/ETH/XAU/SNDK Analysis
The market kept right on going overnight, plunging again and wiping out $1.25 billion. 235346 people were wiped out; hopefully you weren’t among them!
In recent market conditions, it’s been impossible for bulls not to lose money, even when being extremely cautious. In my view, losses capped at 30% in this move are barely acceptable. If you’re down more than 30%, you should reconsider whether your position size is appropriate. As for those who were wiped out, there’s not much more to say: with absolutely no trading discipline, they served as pure liqu
post-image
DominanceWillMakeYou
2026.11.6 BTC/ETH/XAU/SNDK Analysis
The market took another beating overnight, wiping out $1.25 billion and liquidating 235,346 traders; hope you weren't among them!
For bulls, in this recent market, even playing it safe makes it impossible not to lose money. In my view, losses capped at 30% in this downturn are barely acceptable. If your losses exceed 30%, rethink whether your position sizing is reasonable. As for those who got liquidated, there's not much more to say—they had no trading discipline and became pure liquidity for the market!
BTC
Market sentiment is completely in control right now. 72850 is key support after the break below 75475. If support at this level cannot be confirmed, price may break below the 70000 round-number level and even test 67135;
Price is currently consolidating in the 75475-78425 range, with violent swings and aggressive shakeouts;
For last night's trade, 75500 was the final line of defense. If price breaks below it on rising volume during the day, just stop out; if volume contracts near 75700, consider lowering your cost basis below 77000 and see if there's a chance to break even tonight. The stop-loss condition remains unchanged: if price breaks below 75500, fails to reclaim it quickly, and continues falling on rising volume, stop out;
ETH
Support: 2150/2095/2010
Resistance: 2403
Watch 2215 and 2345 during the day to see whether price breaks through on rising volume or can retest 2345 to the upside tonight. Take-profit and stop-loss approach is the same as for BTC;
XAU eventually pulled back as well, under pressure from the violent selloff in US equities. The key levels below remain the 3970-4000 zone—let's see how it plays out!
SNDK: Democrats have put forward a proposal to ban the construction of computing centers. In fact, this was the reason for the sharp plunge in July this year, when SNDK fell 59% from its high. This latest downturn has also seen a 58% drop from September's high. If it falls further, it really could reach the 500-700 range. If it gets there, a sharp rebound will likely follow. For now, just watch for signs of a bottom;
Trading suggestions do not constitute investment advice: This market is undoubtedly a great opportunity for spot buying. Don't expect an immediate reversal, but spot has reached the point where you need to start building a position; especially ETH, where starting to build a position in batches is perfectly reasonable;
In this market, you can take a loss, but don't get liquidated. Play it safe, build positions slowly, and accumulate cheap tokens—that's the best strategy!
#美股史诗级抛售
repost-content-media
ETH-1.26%
XAU+0.38%
SNDK-22.24%
BTC-0.67%
  • 3
What Is Momentum Trading? Why Can Sustained Price Increases Attract More Buyers, While Momentum May Suddenly Fade?

In the cryptocurrency market, sustained price increases may attract more traders to follow suit and buy, while sustained declines may trigger more selling. Momentum trading seeks opportunities by taking advantage of the possibility that these trends will continue. But a price rise does not mean it will necessarily keep rising, and momentum can weaken or even reverse at any time.

First, what is momentum trading?

Momentum trading is a trend-following strategy that mainly observes
post-image
🔹Democrats Sweep Both Chambers of Congress as the Dow Surges Over 3! But AI Stocks F
live-cover
LIVE2,060
Downloaded SOUL and Momo,
then added a few alt girls and sent them money for a few milk teas, and then got this. Did they take me for some old guy they could fleece?
post-image
Right-side opportunities require watching the market. You may only get a few in a week, so you need to wait for a breakout before entering, and then use protection.

With left-side trades, you must never get greedy; they’re all short-term. However, 80-90% of the market is range-bound, so there are plenty of opportunities. As long as you maintain a certain win rate and get your entry points right, compounding can still deliver big results.

In other words, trade both higher and lower timeframes at once[阴险]
post-image
Zec market update
live-cover
LIVE2,020
What Is Cross-Exchange Arbitrage? Why Can Price Differences Between Two Platforms Be Offset by Transfer Time and Capital Lock-Up Costs?

The same crypto asset may have different quoted prices on different exchanges. Traders can try to buy on the platform with the lower price and sell on the one with the higher price to capture the spread. But this seemingly simple trade is also affected by fees, transfer speed, and market volatility.

First, what is cross-exchange arbitrage?

Cross-exchange arbitrage involves trading on price differences for the same asset across different platforms. For examp
post-image
BTC-0.67%
I was taken aback for a moment too, then I figured out what was going on.
post-image
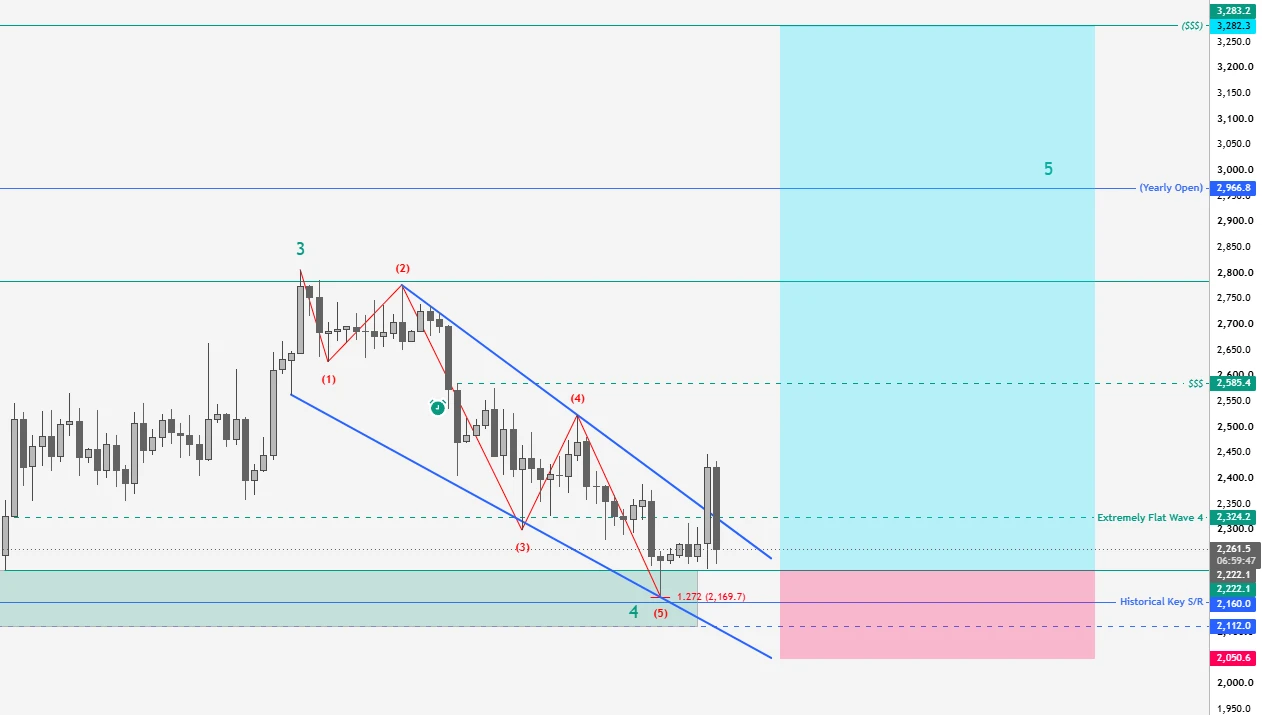
$ETH Removing the SL from BE on ETH and moving it back to 2050.

It's more likely that we'll get wicked out at BE and reverse than actually hit the original SL.

The odds are simply better keeping the original SL in place, considering that our entry isn't at the pico bottom either.
post-image
ETH-1.23%
Load More

Join 40 M users in our growing community

⚡️ Join 40 M users in the crypto craze discussion

💬 Engage with your favorite top creators

👍 See what interests you

Trending Topics

USStocksFaceHistoricSelloff

987 Views3.48k Discussing

U.S. stocks suffered a sharp selloff on Thursday, with the Nasdaq closing down more than 5% and the Philadelphia Semiconductor Index falling over 12%. AI and chip stocks including $NVDA and $AMD were hit especially hard. Markets are reassessing AI valuations, data-center spending and future returns. Is this just short-term deleveraging, or the start of a deeper correction in the AI trade? Which sectors are you watching next?

GateLaunchesPoSECProofOfSecurity

12.01k Views570 Discussing

USNonfarmPayrolls

9.34k Views3.99k Discussing

View More