
Square
Following
Hot
News
Profile
Share your thoughts
placeholder
Article
$ETH Key resistance ahead?
Ethereum (ETH/USD) is rising toward the pivot, which has been identified as an overlap resistance, and could reverse toward the 1st support, which is a pullback support.
Pivot: 2,566.05
1st Support: 2,344.48
1st Resistance: 2,780.51
‍#ShareWeekly #USCPISoon
post-image
ETH+1.62%
🔴 Strategy (MSTR) could be excluded from major MSCI indices (such as the MSCI USA, MSCI World, or MSCI ACWI) starting in late November 2026.
MSCI is one of the largest index providers in the world. Thousands of billions of dollars are invested in funds that automatically track these indices. If a stock is removed, these funds are required to sell it.
This is not yet certain: MSCI has introduced “buffers” to limit abrupt changes. A company already in the index, such as Strategy, will only be removed if it fails to meet the new criteria for two consecutive years. The final list of affected secu
post-image
MSTR+5.58%
MSCI+2.49%
Many people see the funding rate turn positive and MACD turn green and automatically assume “the bulls are back,” then chase in with oversized positions—this is the most common position-sizing mistake: treating indicator direction as an entry signal while ignoring the moving-average structure and volatility levels. $BERA is a textbook example of this trap.
First, the structure: current price 0.2284, MA5=0.2311 remains below MA20=0.231595, and the short-term moving average has not crossed above, meaning the bearish alignment has yet to be repaired; RSI=47.3 is stuck in the neutral-to-weak zone
post-image
BERA-6.28%
Range-bound SKHYNIX is about to break out and most traders are positioned the wrong way.

$SKHYNIX /USDT - SHORT

Trade Plan:
Entry: 971.37 – 978.79
SL: 1010.69
TP1: 948.37
TP2: 930.56
TP3: 903.85

Why this setup?
Why now? The daily trend is range, but the 1h ATR of 14.839521 signals a squeeze is building inside that range. The 15m RSI at 58.85 shows momentum is not yet exhausted, so a short entry near 975.08 is valid as long as we stay below 978.79. TP1 at 948.37 and TP2 at 930.56 define the first two targets on the path down, while the invalidation level of 1156.63 is the hard line that w
SKHYNIX-3.64%
$PI The old system will not collapse because of hacking, but because it is completely abandoned. Don’t panic, adapt.
As traditional finance decays, sovereign protocols like PiNetwork replace it with real utility through RWA tokenization and immutable code
Change is underway.
Stay calm & build.
post-image
PI+1.55%
$QNT
A steady grind lower all the way, with longs liquidating longs—everyone trying to catch the falling knife got buried.😤 A rebound to 213.7 is the window to escape; if 201.8 breaks, it will head straight down. Don’t wait until the waterfall comes to run.
post-image
QNT+0.98%
Bitcoin Whale That Sat Through Every Crash Since 2020 Just Moved $377M
A Bitcoin whale moved 4,581.94 BTC, worth roughly $377 million, to five new addresses on Oct. 12. The transaction confirmed in block 971,126 around 18:37 UTC, when Bitcoin was trading near $82,350, and it paid a fee of just 732 satoshis — about 60 cents.
The coins have been sitting in the wallet since March 2020, when they arrived in a transaction that split a 5,081.95 BTC balance three ways. At roughly $8,830 per Bitcoin, the 4,581.95 BTC landing in the wallet was worth about $40.5 million. The value of the Bitcoin has nea
post-image
BTC+0.98%
10.16 Gold $XAU Recent Strategy Gold has been moving sideways within this range since falling at the end of September, with 4220 on the upside and 4110 on the downside. We have gradually sold high and bought low several times here.
Here is what we are doing now: 1. Short-term strategy: go long at 4100, exit around 4200, with a hard stop-loss at 4020. 2. After playing a few short-term rounds, switch to a long-term position (you can choose PXAG due to the high weekend fees). The unchanged point for both long-term and short-term trades is going long at 4100 with a stop-loss at 4020; the only dif
post-image
XAU+1.38%
  • 4
In this $ZRO move, which step is easiest to be fooled by?
When I looked at $ZRO again, I first covered up the 24-hour +9.37%. It’s not that this number is unimportant, but it is too good at grabbing attention. What really needs explaining right now is that after $ZRO’s sharp 24-hour rise, momentum and continuation are not the same thing. I won’t extrapolate the large move that has already happened into the next leg; I’ll first see whether the price can hold in the new range.
The most convenient—and easiest to get wrong—reading is that the gainers and losers list records the past, while the mo
post-image
ZRO+9.49%
$AAOI
The correction continues. If the index hadn’t made a liquidity sweep, the other path would have remained valid. Today, it pulled back to the monthly EMA21-$74. On the other hand, it has also dipped as far as the support band during previous corrections. I normally use the support band as my reference for trends anyway.
I still think it’s forming a handle here. There’s no topping structure like the one at the 2017 peak
post-image
AAOI-2.87%
INDEX-2.36%
Bitcoin Mining Stocks Plunge: 4 Major Firms Lose Over 12% in One Day
Bitcoin miners took a severe hit on Wednesday as higher-than-expected US inflation data triggered a broad selloff across tech and AI stocks.
TeraWulf fell 12.64%, Core Scientific dropped 12.44%, Cipher Mining declined 12.35%, and IREN lost roughly 12.2% in a single session.
⚠️ Personal market analysis only. NFA — manage risk and DYOR.
Educational content, not investment advice or a recommendation to buy, sell, deposit, or withdraw any asset. No paid promotion or referral/affiliate links.
post-image
CORZ+7.03%
IREN-0.55%
$AGT Square has scored a resounding victory for the fifth consecutive month. The more people try to suppress us, the more we stand out; the more people try to suppress us, the better we perform; the more people try to suppress us, the stronger people's trust in us becomes.
1,200 traders, 1,200 qualified individuals. Thank you to each and every one of you. $ZE
$ETH
post-image
ETH+1.65%
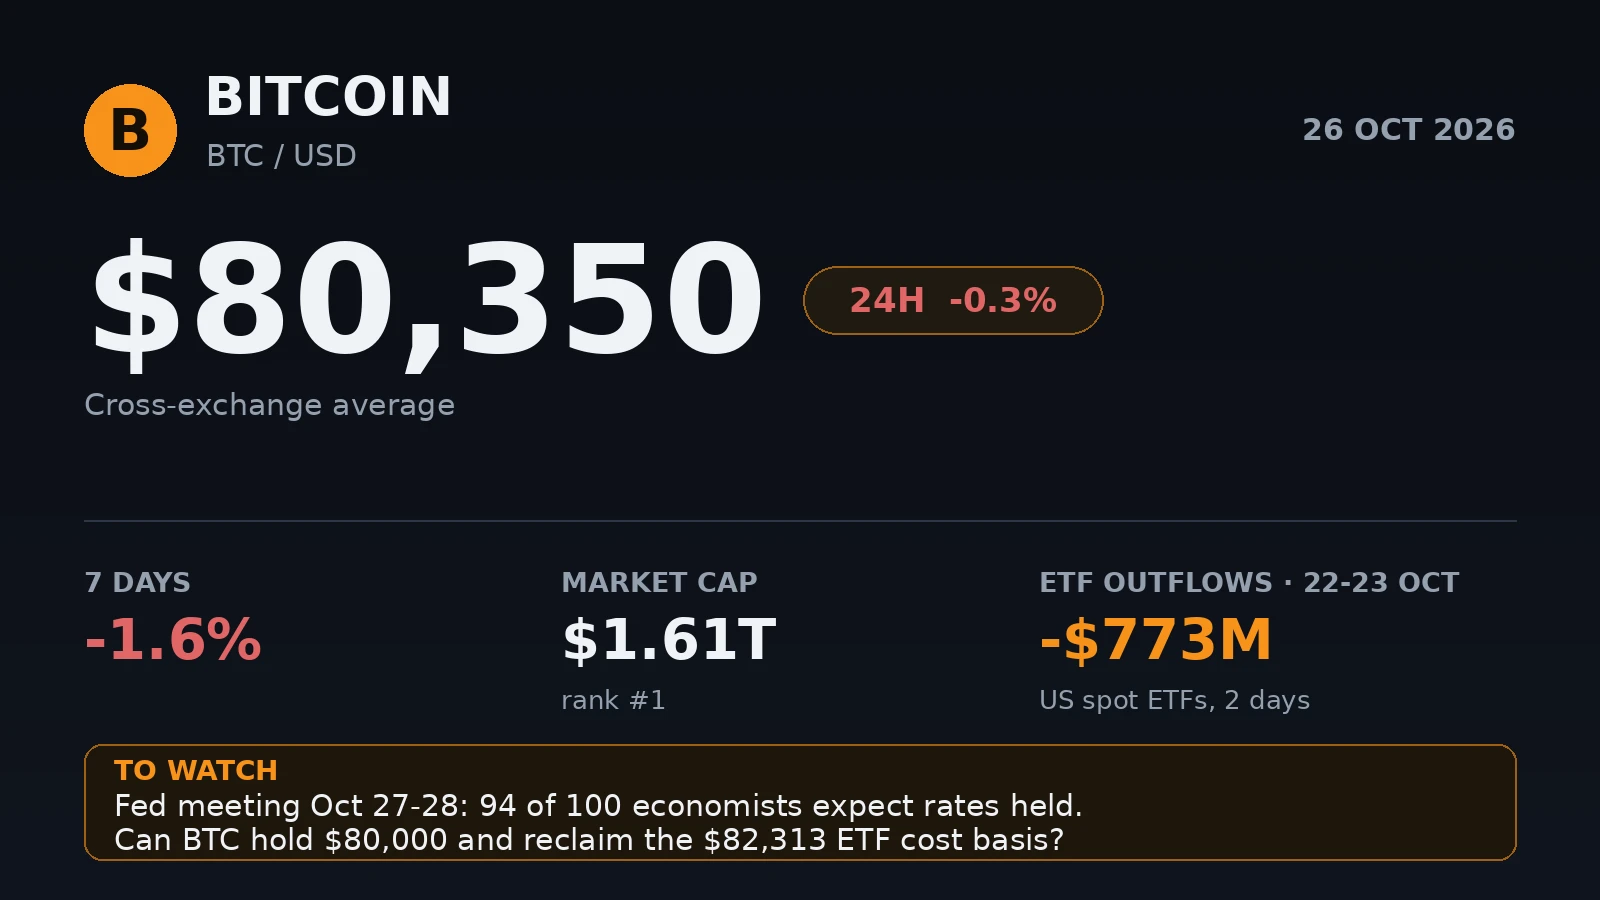
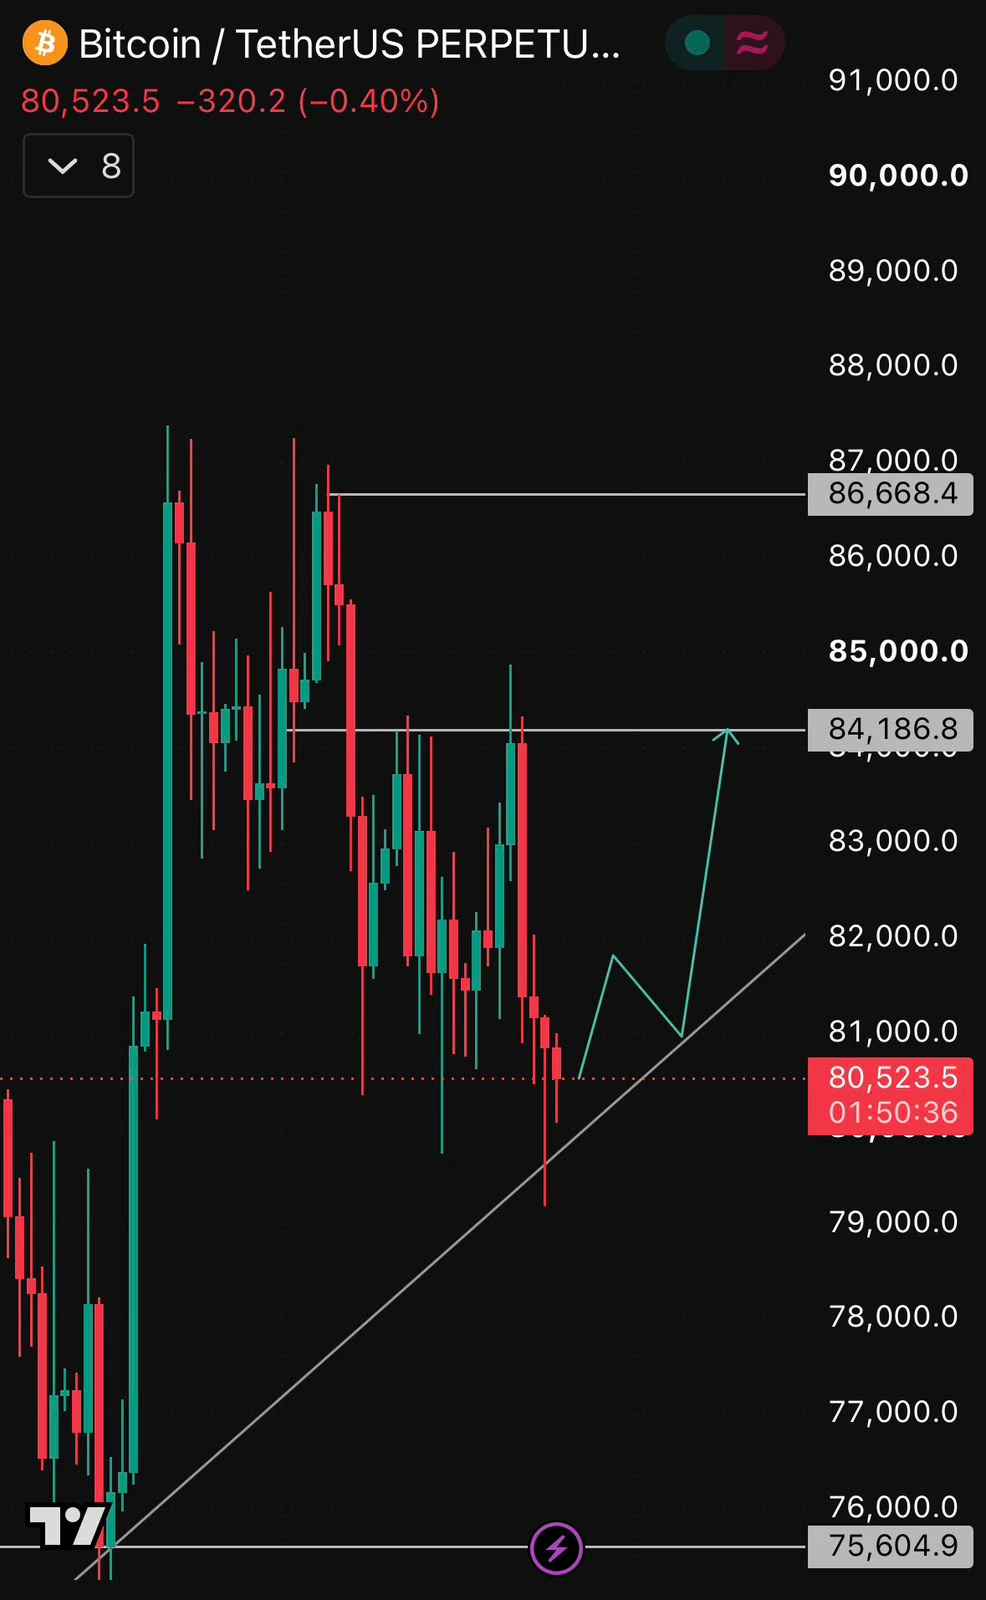
BTC UPDATE
live-cover
LIVE48
$AKE Something is off with this data.
While scanning the market just now, I saw $AKE jump straight from 0.026 to 0.0375, gaining 22 points in 24 hours, with trading volume surging to 179 million. This volume is unusual—normally this coin only does several tens of millions in daily volume, but today it suddenly expanded by so many times. There must be something going on.
Three possibilities: first, the project team is making a move. I haven't seen any positive announcements recently, so it could be capital aggressively pushing the price up; second, someone is aggressively buying spot in prepar
AKE+18.43%
An unpopular take: $INJ ’s current +10.99% gain is not as conclusive as it looks.
$INJ is currently at 8.423, up +10.99% over 24 hours. The 1-hour support is 7.061, resistance is 8.562, and current volume is 0.77 times the average volume of the past 20 periods. What is truly useful in these numbers is where 7.061 and 8.562 are containing the range.
This is where I currently stand: I acknowledge that the trend is strong, but what matters next is not how much higher it can surge, but whether buyers step in during the first pullback. The 1-hour trend is strong, with an RSI of 86; the 4-hour trend
post-image
INJ+11.45%
How to Manage Your Positions After a Crash? Let Me Share My Hands-On Experience Using Gate
We’ve talked about a lot of analysis and judgments before, so in this final article, let’s discuss something practical—how to manage your positions on Gate after a crash?
Step one: First, assess your position exposure. If you hold spot or futures positions related to SK hynix, SanDisk, Samsung, and others, the first thing you need to do is understand the size of your risk exposure. On Gate, the open interest in SK hynix and SanDisk futures accounts for 15.8% and 18.15% of the entire market, respectively,
SK Hynix-11.06%
SKHY+0.45%
SKHYNIX-3.64%
SNDK+1.33%
SNDKG+1.48%
$ETH Key resistance ahead?
Ethereum (ETH/USD) is rising toward the pivot, which has been identified as an overlap resistance, and could reverse toward the 1st support, which is a pullback support.
Pivot: 2,566.05
1st Support: 2,344.48
1st Resistance: 2,780.51
Disclaimer:
The opinions given above constitute general market commentary and do not constitute the opinion or advice of Markets or any form of personal or investment advice.
Any opinions, news, research, analyses, prices, other information, or links to third-party sites contained on this website are provided on an "as-is" basis, are inte
post-image
ETH+1.62%
First, a word for the bullish side $AAVE , then one for the bearish side.
The bullish side needs to prove that someone is buying above 158.98; the bearish side needs to prove that nobody is catching it after 147.05 gives way. $AAVE is currently at 158.72, up 3.44% over 24 hours. The 1-hour support is 147.05, resistance is 158.98, and current volume is 0.23 times the average volume of nearly 20 candles.
Before either side has fully presented its evidence, I’m more focused on the fact that $AAVE’s price has already moved, while trading activity and volume have not kept up. We can temporarily bel
post-image
AAVE+2.99%
Guys, the AI narrative on the BNB Chain is really taking off, so $SI Super Intelligence absolutely needs to be on your radar!
The name is instantly recognizable, and the AI + Meme combination is just waiting for a capital spark. The expectation gap is ridiculously huge!
Once a project like this connects with the community and gains momentum, it can move very quickly. Let’s make an initial push to build a position, then add as the market action develops!
CA :
0xfef4d972bec2319ffbe8698f9f71c7b392ae7777
#SI #BNB #AI #Meme #DOGE #PEPE
post-image
BNB+0.12%
SI+30.95%
MEME-0.09%
DOGE-0.53%
PEPE+1.15%
CPI Comes in Hotter Than Expected
live-cover
LIVE51
Load More

Join 40 M users in our growing community

⚡️ Join 40 M users in the crypto craze discussion

💬 Engage with your favorite top creators

👍 See what interests you

Trending Topics

USSeptemberPPIBeatsExpectations

91.35k Views1.88k Discussing

US September PPI came in at 6.3% YoY, well above the 5.3% market expectation, pointing to renewed producer-side inflation pressure. Weekly jobless claims were 199K, broadly in line with forecasts. Could hotter inflation further reduce room for rate cuts, and what does it mean for $BTC, US stocks, and gold?

DrLinHanSpeaksAtOxfordUnion

135.63k Views1.86k Discussing

JapanAndKoreaStocksPlunge

47.27k Views1.76k Discussing

View More