Share your thoughts
placeholder
Article
Insiders are quietly fading the bounce on SYMBOL while range-bound charts hide a bigger move.

$PONS /USDT - SHORT

Trade Plan:
Entry: N/A – N/A
SL: N/A
TP1: N/A
TP2: N/A
TP3: N/A

Why this setup?
Why now? The 1d trend is range, which means price is coiling and a directional break is overdue. The 15m RSI sits at 57.04, showing mild bullish exhaustion rather than conviction, so fading upside makes sense. The 1h ATR is unavailable, meaning current hourly volatility is quiet and a sudden expansion could catch overextended longs off guard. The entry zone is anchored at 0.7236, a precise level w
PONS-13.78%
I was just about to curse it out, but then I looked at my account and thought, never mind. Let it fall however it wants—I’ll keep quiet.

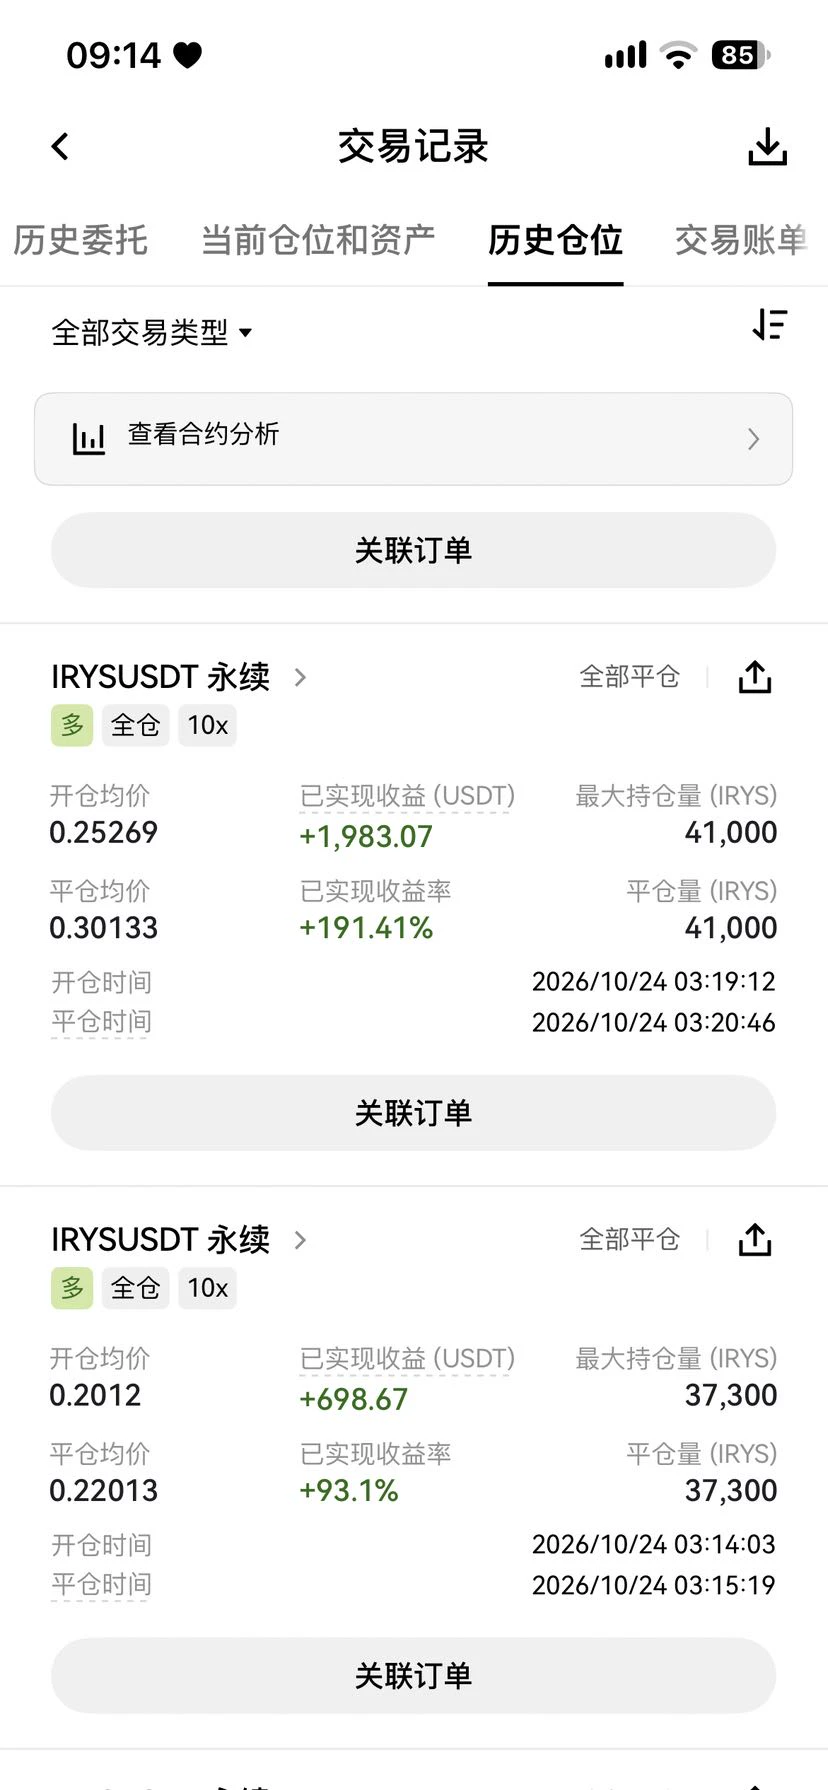
During the intraday plunge, it weakly bounced to around 0.06198. The trading volume looked half-asleep, bids were weak, and it was obvious it couldn’t go any higher. I placed a short order, and sure enough, it later ground all the way down to 0.05601, +236.19%. That profit felt great.

The operation wasn’t complicated: lock in 80% first, and set breakeven protection for the remaining 30%. Even if it bounces, it won’t touch my profits. With a coin you’re no
post-image
SNDK+1.42%
SOL-2.50%
September 8 15-minute short-term strategy:
ETH: Short around 2526-2545, take profit around 2500-2482-2466, stop loss if it breaks above 2550. Long around 2448-2436, take profit around 2466-2480, stop loss if it breaks below 2430.
BTC: Short around 79365-79530, take profit around 78811-78600, stop loss if it breaks above 80000.
SOL: Short around 105.70--106.87, take profit around 103.58-103.16, stop loss if it breaks above 107.50.
For ETH, due to price differences across platforms, entries can be taken $1-3 above or below; for BTC, entries can be taken $50-100 above or below.
The breakouts and
ETH-1.25%
BTC-1.50%
SOL-2.53%
$SYRUP is showing some interesting momentum.
After trading around $0.194 at the start of September, Maple’s native token pushed above $0.22, briefly reaching around $0.234 before cooling off.
Today’s slight pullback doesn’t change the bigger picture:
Maple finance continues to expand its institutional lending ecosystem, while products like syrupUSDC, syrupUSDT and syrupUSDG continue bringing more capital and utility into the network.
Price moves come and go.
The real story is whether Maple finance can keep growing its fundamentals.
Stay bullish on $SYRUP
This is not a Financial Advice, Always
post-image
SYRUP-1.16%
BTC is currently around $79,244, down slightly by 0.94% over 24 hours, repeatedly battling below the $80k round-number level: spot ETFs saw net inflows of $987 million last week, while positive remarks from the U.S. Treasury Secretary provided downside support; whale selling pressure, CPI/FOMC uncertainty, and multiple security incidents capped the upside. Technically, the RSI at 42.1 indicates a neutral-to-weak short-term bias, with the direction likely to be determined after macro developments play out. #Gate闲钱宝自动生息享3%年化
BTC-1.50%
Nobody is talking about this SYMBOL move yet

$ZEC /USDT - LONG

Trade Plan:
Entry: 1132.33 – 1144.33
SL: 1080.77
TP1: 1181.50
TP2: 1210.28
TP3: 1253.45

Why this setup?
Why now? The daily trend is bullish and the 1h price is holding at 1138.20, which aligns with the entry reference of 1138.33, confirming that buyers are defending this zone. The 15m RSI sits at 31.31, indicating oversold momentum that often precedes a sharp reversal higher in a trending market. The 1h ATR of 23.98 shows enough volatility to push the price from the entry zone toward the first target at 1181.50 and then towar
ZEC-6.93%
I’m bearish on this batch with no spot market. Of the 207, 83 are inverted, while only 53 are whale-skewed; retail is more bullish than whales, and this structure usually does not look like a bottom—the bottom is often when retail lies flat and whales take positions first, whereas the opposite is happening now. $AT Whales are 14.87 times higher than retail, with only $9M in OI; $HUMA 7.37 times with $12M; $KITE 7.19 times and $21M. Put simply, the few markets with the most extreme skew are all painfully thin; positions in the $20 million range can be pushed around by virtually any wave. Tot
post-image
AT-3.66%
HUMA-1.37%
KITE-4.37%
Everyone is sleeping on UNI while the 1h setup screams long right now.

$UNI /USDT - LONG

Trade Plan:
Entry: 6.824 – 6.888
SL: 6.553
TP1: 7.083
TP2: 7.234
TP3: 7.462

Why this setup?
Why now? The daily trend is bullish and the 1h price is sitting at 6.856, perfectly aligned with a high-confidence entry zone between 6.824 and 6.888. The 15m RSI at 44.18 shows room to run before overbought territory, while the 1h ATR of 0.126158 confirms enough volatility to push toward the first target at 7.083 and beyond to 7.234. The daily structure supports a move toward 7.462, but this entire long thesi
UNI-6.18%
$MU /USDT is about to expose the biggest range trap of the week.

$MU /USDT - SHORT

Trade Plan:
Entry: 1035.35 – 1037.39
SL: 1046.17
TP1: 1029.02
TP2: 1024.12
TP3: 1016.77

Why this setup?
Why now? The daily trend is a range, but the 1h price is sitting at 1036.37, right inside the entry zone where the 15m RSI has dropped to 35.35, signaling bearish exhaustion is setting in. The 1h ATR of 4.083077 confirms enough volatility to push the price from the entry_ref toward TP1 at 1029.02 and then TP2 at 1024.12. The invalidation level at 995.15 is the hard line that separates a clean short from
MU+2.03%
>driving 1 mile to pick up groceries
>google maps:
post-image
No More Switching Back and Forth Between Wallets! Gate’s “Trenches” Makes On-Chain Trading Feel More Like Spot Trading
Many people aren’t unwilling to play on-chain Meme coins—they’re simply put off by the complicated process.
Connecting a wallet, transferring assets, paying Gas fees, granting approvals… by the time everything is done, they’re exhausted before even buying any coins.
Gate’s launch of “Trenches” takes the opposite approach: it puts the on-chain trading process directly into a familiar trading environment. Users can trade using assets in their Gate accounts, and search for tokens
MEME-0.24%
  • 28
I was just about to go to the forum and rant, but then I looked at my balance and decided against it—the market is always right. 😂
When the sell-off hit early in the session, many people panicked and cut their losses. I kept an eye on $ZKC and instead thought: each rebound was weaker than the last, volume kept shrinking, and nobody was buying into the rise. How long can a market with insufficient support hold up? I directly placed a short order at 0.04950.
The rest played out just as I had expected: the price slowly drifted downward, with the current price touching 0.04878, locking in +35.66%
post-image
ZKC-0.81%
SOL-2.50%
LAB-2.64%
With this trend, I don't even need to think—the account is dancing on its own. Before the market fully took off, $XRP held its key level, had consolidated at the bottom for so long, and buying pressure was strengthening. I judged this move was highly likely to step up, so I went long directly. Entered at 1.3837, now at 1.3929, +60.5%. It was truly sluggish before, but once it broke out, it felt great. Getting the rhythm right is just comfortable. In terms of execution: take 80% off the table first—don't get greedy for the last bite. Move the stop loss on the remaining 20% to the entry price an
post-image
XRP-1.81%
BNB-1.81%
LAB-2.64%
Insiders are calling this the most overlooked long setup on the board right now.

$USELESS /USDT - LONG

Trade Plan:
Entry: 0.22852 – 0.23442
SL: 0.20310
TP1: 0.25274
TP2: 0.26693
TP3: 0.28820

Why this setup?
Why now? The 1D trend is already bullish, which gives the 1h price of 0.23147 a clear tailwind. The 15m RSI sitting at 51.41 shows the asset is neutral, not overbought, leaving room to run before exhaustion. The 1h ATR of 0.011819 tells us the current hourly volatility is tight enough that a breakout from the entry zone between 0.22852 and 0.23442 will likely be decisive. With TP1 at
USELESS+5.39%
$XAUT 9.8 morning gold outlook
Yesterday’s price action can be summed up in one word: “weak.” After Friday’s bearish nonfarm payrolls data knocked the price down 110 points, the market entered a range-bound consolidation, with the candlesticks becoming progressively smaller.
Market conditions show that gold lacks sufficient upside momentum. U.S. Treasury yields remain elevated, while the dollar has stabilized. The current rebound in gold prices is merely a technical correction, not a trend reversal, so the strategy remains to sell rallies.
Trade reference: Short near 4435, with targets at 4370
post-image
XAUT-0.01%
9.8 Gold Morning Review

Yesterday at midnight, support was correctly anticipated to hold, and the market maintained range-bound movement. The pace aligned with expectations from the analysis, with the current gold price around 4411.

Technical analysis: The 1-hour Bollinger Bands continue to narrow and flatten, with the gold price oscillating around the middle band; the 30-minute Bollinger Bands are narrowing, the KDJ indicator is turning downward, short-term rebound momentum is weakening, and the market has entered range consolidation. The bearish structure on the larger time frame remains
post-image
GLDX-0.07%
$ZEC Bro, you’re freaking amazing—did you really stop me out here? Set the stop-loss wider next time! For this position, I took 25% profit at 1140 and closed the entire position at 1111. I went to sleep thinking I’d wake up to a nice payout, only to find that it had hit my stop-loss right on the nose. You took me out with a 0.16 difference—I can only say, impressive. You came specifically to hunt me down... Set the stop-loss wider next time. That way, the risk-reward ratio will look better when we land a big result. What do a few U matter compared with the final big result? This trade offered
post-image
ZEC-6.93%
ZEC Breaks Above $1,200—Who Is Still Shorting? Shorts Are Being Taught a Lesson by the Market!
This ZEC rally has one very obvious driving factor: shorts are being continuously squeezed.
ZEC has recently broken through key round-number levels in succession, from $900 to $1,000 and then $1,200, with the pace of gains accelerating. As the price continues to break past previous highs, shorts who had bet on a pullback have been forced to close their positions, further creating a cycle of “rally—liquidations—further rally.”
This is a classic short-squeeze rally.
The most exciting part is that those
ZEC-6.93%
  • 26
Load More

Join 40 M users in our growing community

⚡️ Join 40 M users in the crypto craze discussion

💬 Engage with your favorite top creators

👍 See what interests you

View More