Square
Following
Hot
News
Profile
Share your thoughts
placeholder
Article
Sunday, October 18 [Macro]
✅The US postpones imposing a new round of large-scale sanctions on Russia
✅The ECB warns that geopolitical conflicts are driving up inflation risks
📅Sunday, October 18 [Geopolitics]
✅Strait of Hormuz: Iran opens fire to intercept vessels in violation, and an oil tanker hits a mine and catches fire
✅Ukraine: Ukraine and the US may begin a new round of talks as early as next week
✅Egypt says it can provide security protection at Saudi Arabia's request
#DOGE DOGE ETF switches from consecutive net inflows to redemptions! Can the $0.08 support hold?
Dogecoin fever cools! ETF funds flee, with $0.08 becoming a crucial line in the sand🐶
Once wildly popular Dogecoin (DOGE) is now facing a subdued market atmosphere. Dogecoin ETFs had previously seen three consecutive weeks of inflows, but the trend completely reversed in October as institutional funds began to pull out, putting considerable pressure on the price.
📉ETF funds see $540k in outflows over two days.
According to SoSoValue data, spot Dogecoin ETF flows were virtually flat from October 1
post-image
ThisIsTranslateContent:
#DOGE DOGE ETFs switch from consecutive net inflows to redemptions! Can the $0.08 support hold?
Dogecoin hype cools! ETF funds flee, with $0.08 becoming a make-or-break line🐶
Dogecoin DOGE, once hugely popular, is now facing a subdued market atmosphere. Dogecoin ETFs had previously seen three consecutive weeks of inflows, but the trend completely reversed in October as institutional funds began to pull out, putting significant pressure on the price.
📉ETF funds see $540,000 in outflows over two days.
According to SoSoValue data, from October 1 to 9, flows in and out of Dogecoin spot ETFs were virtually flat, with no funds entering or leaving. Instead of a turnaround, a wave of redemptions followed. Around $400,000 flowed out on October 12, followed by another $138,600 on the 13th, bringing total outflows to $540,000 in just two days.
Fund net assets also shrank from nearly $17 million at the start of the month to $14.44 million. The retreat of institutional funds is a major headwind DOGE must now face.
📊The price continues to weaken, with bearish technical indicators.
DOGE is down 14% overall this month. It was still holding at $0.095 at the start of the month, but slid steadily after October 7 and is now trading at around $0.0800.
Although it briefly rebounded to a high of $0.088 on the 12th, the recovery was short-lived, and the price quickly fell again, touching a low of $0.08. Technical indicators are also unpromising: the RSI has fallen below its signal line, while the CMF money flow indicator briefly dropped to near -0.90 and has now recovered to -0.30, indicating that the overall trend of capital outflows remains unchanged.
⚖️Futures market sees a tug-of-war between bulls and bears, with bullish positions weakening.
Signals from the derivatives market are mixed. DOGE open interest first surged to $652 million, then fell to $598 million before edging back up to $609 million. The funding rate remains positive at 0.0088%, indicating that the market still retains some long positions, with bulls continuing to pay fees to bears. However, the overall decline in open interest means bullish momentum in the futures market is weakening.
📌Market Summary and Key Points to Watch
$0.08 is a key short-term support level for DOGE. If it breaks decisively below this level, pressure on bulls will intensify sharply, and the price could fall further. The market is currently weak overall, and the rebound lacks strength, so it is unwise to blindly buy the dip. Watch closely to see whether the $0.08 support holds.#WCTCS9
repost-content-media
DOGE-0.93%
Trenches
AGT
A
bade
b
AGT
0x5d...e274
Market Cap
$
Change
.
24h Vol
$.
Holders
.
CNPY
C
bade
b
CNPY
0xc6...ddd2
Market Cap
$.
Change
.
24h Vol
$.
Holders
.
COVENANT
C
bade
b
COVENANT
0xcd...de79
Market Cap
$.
Change
.
24h Vol
$.
Holders
.
Q
Q
bade
b
Q
0xc0...0589
Market Cap
$.
Change
.
24h Vol
$.
Holders
.
Gato
G
bade
b
Gato
55A3...pump
Market Cap
$.
Change
.
24h Vol
$.
Holders
.
$BTC BOOM💣It's about to explode soon; the big player is starting to accumulate, forming a daily double bottom, with a large pool of liquidity above🤩
Long, long, long🔥🔥TP1: 82500 TP2: 84000 TP3: 87000-90000 SL: 78200$AG $ETH
post-image
BTC+0.01%
AG-0.65%
ETH-0.60%
#GateBTCAndETHFuturesVolumeRanksTop3
Gate BTC and ETH Futures Trading Volume: Can the Momentum Continue?
In my view, the momentum Gate is seeing in the derivatives market could persist; however, sustainable growth depends on whether this increased trading activity is driven by lasting demand rather than mere short-term speculation.
The reported figures are encouraging: with BTC and ETH in an uptrend, Gate ranks among the top three exchanges globally for futures trading volume in both assets, with BTC futures volume reaching approximately $7.18 billion over a 24-hour period.
Nevertheless, high
BTC+0.01%
ETH-0.60%
GT-3.00%
XTIUSD+2.67%
TSLA-2.17%
  • 4
Let’s start with a term: weekend gold prices.
The $XAU on screen isn’t gold moving now; it’s quotes with no takers shifting around.
Only 5.97 million traded in the last hour, compared with 150 million in a single hour a few days ago.
“Breaking above 4205 means a new rally.”
I’ve heard that twice in the past three days. Here are the numbers:
1. 4205.65 was touched only once, at 10-16 22:00, and it hasn’t gone higher since.
2. Since then, over the past 34 hours, it has steadily ground back to 4164.07.
3. The 24-hour range is 4157.36 to 4173.66, a spread of 0.39%.
With a range this narrow, it’s
post-image
XAU-0.17%
🧧 First Post, First Reward! Earn up to 10 USDT on Gate Square!
New users 100% win! Climb the leaderboard and split 15,000 USDT!
Limited rewards—the more & better you post, the more you earn!
3 Key Rewards:
1️⃣ First-Post Bonus: 100% win rate, up to 10 USDT Red Packets.
2️⃣ Daily Top Picks: 3 creators daily get a 100 USDT coupon + official interact.
3️⃣ Monthly Board: Share 10,000 USDT & Gate merch (T-shirts, umbrellas, mugs).
✍️ Share market insights, trade recaps, or hot topics—any thought counts!
Post Now 👉 www.gate.com/post
Details: https://www.gate.com/announcements/article/102256
Gate_Square
🧧 First Post, First Reward! Earn up to 10 USDT on Gate Square!
New users 100% win! Climb the leaderboard and split 15,000 USDT!
Limited rewards—the more & better you post, the more you earn!
3 Key Rewards:
1️⃣ First-Post Bonus: 100% win rate, up to 10 USDT Red Packets.
2️⃣ Daily Top Picks: 3 creators daily get a 100 USDT coupon + official interact.
3️⃣ Monthly Board: Share 10,000 USDT & Gate merch (T-shirts, umbrellas, mugs).
✍️ Share market insights, trade recaps, or hot topics—any thought counts!
Post Now 👉 www.gate.com/post
Details: https://www.gate.com/announcements/article/102256
repost-content-media
$USD1 has reached 1.0003USDT, but hourly trading participation is only 0.30x, making the move look somewhat weak. The price has moved, but volume has not followed. In this situation, focusing only on candlestick colors can easily lead you to overestimate the move’s staying power. The price has already broken above the 1-hour support at 1.0001, while the 1-hour resistance at 1.0004 still lies ahead. This looks more like a tentative breakout than the start of a genuine trend.
If 1.0004 is actually broken, the credibility of this rally will improve significantly. But low participation currently u
post-image
USD1-0.02%
Making a little bear—almost 2 hours and it’s still not done. At a rough glance, the interface looks inferior to SOL6.1 but better than LUNA. So this is the DEEPSEEK-V4.1-FLAH-1017 you were hyping? By the way, it has cost ¥3 so far
post-image
LUNA-5.24%
DEEPSEEK-4.55%
#DOGE #WCTCS9 Dogecoin May See Its First Major Daily Death Cross of 2026: Is a Potential Trend Reversal Coming?
A potential trend reversal could offset bearish pressure and invalidate the current pattern.
Dogecoin could see its first daily death cross of 2026 as moving averages suggest they will converge in the coming days. The daily 50-day moving average is currently trending downward, while the daily 200-day moving average is flattening, highlighting the potential for a death cross. Dogecoin saw its first daily golden cross since 2026 in October, but profit-taking in the crypto market drove
post-image
ThisIsTranslateContent:
#DOGE #WCTCS9 Dogecoin may see its first major daily death cross of 2026: Is a potential trend shift approaching?
A potential trend shift could counter bearish pressure and invalidate the current setup.
Dogecoin could see its first daily death cross of 2026, as moving averages point to convergence in the coming days. The daily 50-day moving average is currently sloping downward, while the daily 200-day moving average is flattening, highlighting the potential for a death cross. Dogecoin saw its first daily golden cross of 2026 in October, but profit-taking in the crypto market drove its price down to a low of $0.077. Bears seem to be making an aggressive effort to negate this bullish signal, with the possibility of a death cross drawing near.
The timing of a death cross remains uncertain, as a trend shift could counter the bears’ push and invalidate the current pattern. At the time of writing, Dogecoin was up 3.19% over the past 24 hours to $0.081, after briefly selling off as investors weighed higher-than-expected inflation data and the latest remarks on interest rates from Fed Chair Kevin Warsh.
Inflation data released this week was strong: the Producer Price Index released Thursday showed wholesale prices rose 6.3% year over year in September, the biggest increase since 2022. The Consumer Price Index also rose in data released Wednesday. Fed officials responded in September by approving the first rate hike in more than three years; markets expect the Fed to hold rates steady in October and hike again in December.
Could a trend shift be coming? The last time Dogecoin saw a death cross on the daily chart was in November 2025, followed by months of selling until a golden cross appeared recently. This has focused market attention on price action in case a death cross ultimately appears again.
Crypto analyst Ali recently posted a contrarian take on X, sharing three reasons to be bullish on Dogecoin.
First, the TD Sequential indicator has previously marked potential turning points for Dogecoin several times, and this time it issued a buy signal on the daily chart as the price neared $0.081.
Second, URPD data shows that about 36 billion DOGE previously traded near $0.081.
Third, whales appear to be buying near this support level, having accumulated 600 million DOGE since October 12.
If $0.081 holds and Dogecoin rebounds, Ali identifies the $0.16 to $0.17 range as a potential profit-taking zone. $DOGE
repost-content-media
DOGE-0.93%
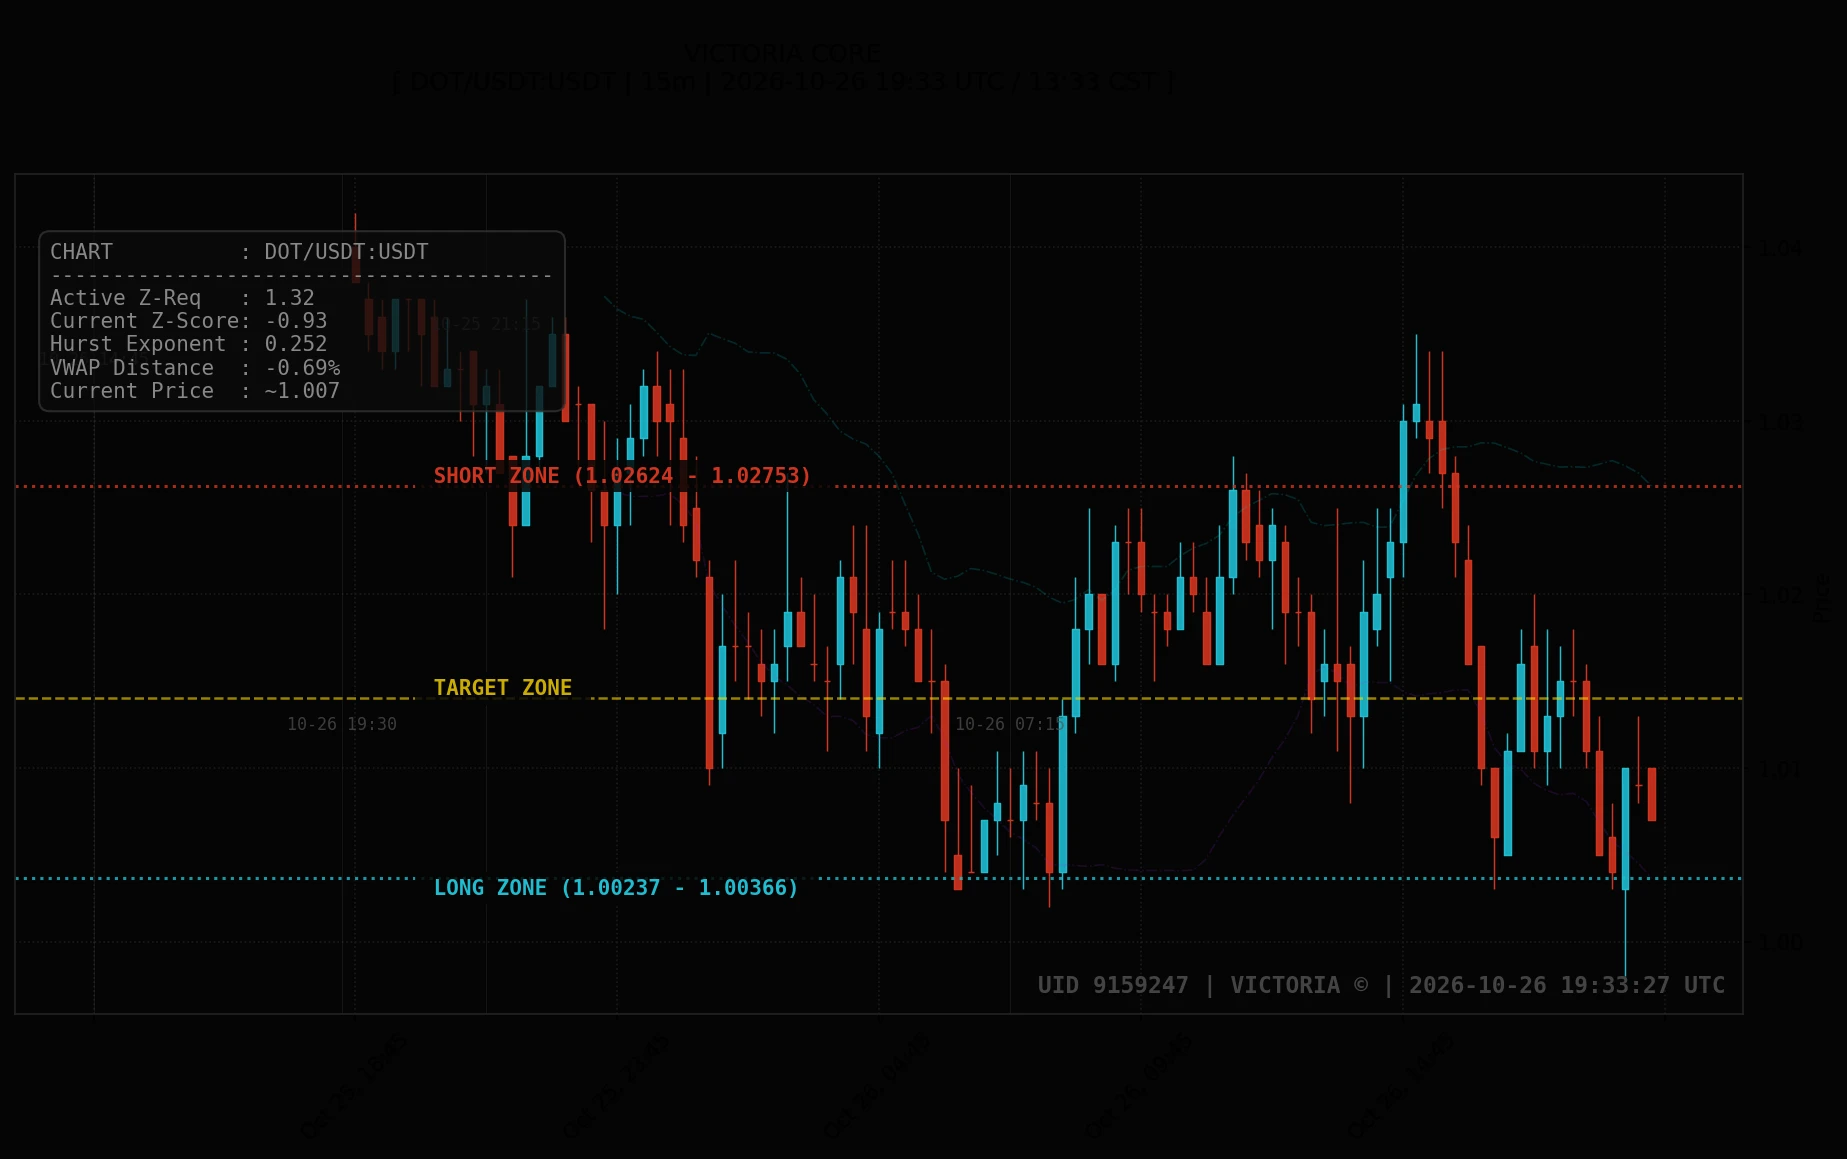
Can stablecoins also have a directional bias? Bottom line: yes, but only for mean reversion within an extremely narrow range, and $U currently has a clear edge in relative sideways strength.
Sector comparison: $SOL is trading at 103.48, with MA5 below MA20, RSI at 44.7, bearish MACD, a funding rate of -0.0022%, and a range of about 3.89% over 30 candles; $APT is trading at 0.7936, down 5.56% over 24h, with RSI at just 37.2, bearish MACD, and a range of about 10.99%. Both are below their moving averages, with weak momentum. By contrast, $U is trading at 1.0007, with MA5=1.00064 above MA20=1.
post-image
SOL-0.73%
APT-5.42%
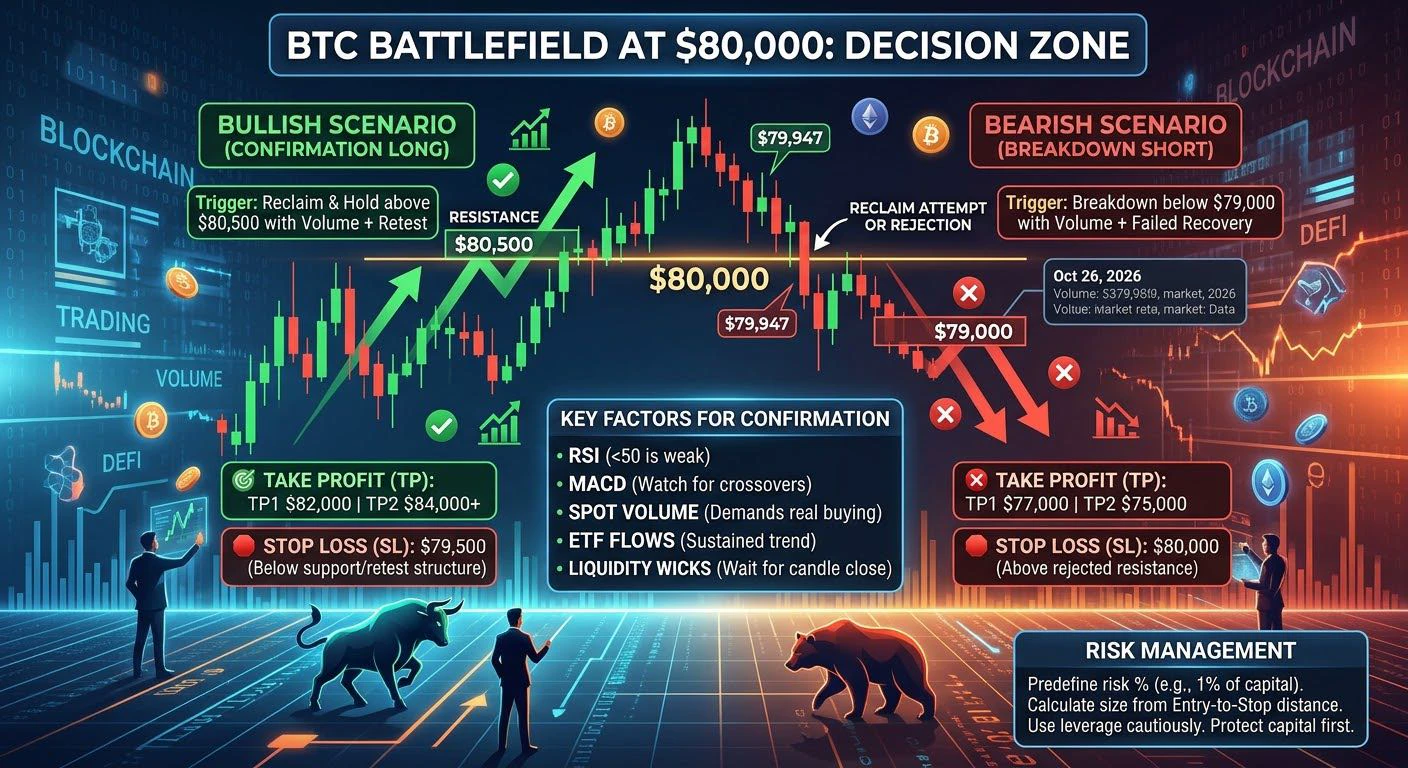
BTC’s battle to defend 80,000 goes into overtime after Warsh’s remarks

Before Warsh’s remarks, BTC seesawed between 80,443 and 82,000. After he began speaking, the price saw no sharp moves—because there were no unexpectedly hawkish or dovish signals. As I write this post, BTC is hovering around 80,800.

Why is the 80,000 level so important? I looked at a few data points.

The first is the ETF cost basis. The average cost basis for U.S. spot Bitcoin ETFs is around $81,500. BTC has fallen below this level, meaning most investors who bought through ETFs are now at a loss. If the price stays b
NVDA-1.42%
#NEARJumpsNearly10% #ShareWeekly
INFLATION SHOCK, BITCOIN AT $82K, NEAR’S RALLY, AND NVIDIA: WHAT COMES NEXT FOR THE CRYPTO MARKET?
The financial markets are entering a critical phase where inflation, Federal Reserve policy, technological innovation, and speculative trading are shaping investor sentiment. The latest U.S. Producer Price Index (PPI) data has challenged expectations of a smooth monetary easing cycle, while Bitcoin’s recovery toward $82,000, NEAR Protocol’s nearly 10% surge, and renewed meme-coin speculation reveal a market full of contrasting signals.
1. U.S. PPI: Inflation Rema
BTC+0.01%
NVDA-1.42%
MEME-2.90%
TSLAX-0.75%
TOKEN-1.74%
$TIA SHORT SETUP — BEARS TAKING CONTROL! 📉**
Entry: 0.6480 – 0.6600 (Short)
SL: 0.6750
TP1: 0.6345
TP2: 0.6100
TP3: 0.5800
$TIA is showing weakness after a sharp rejection from 0.7676. Price is forming lower highs, and sellers remain in control.
As long as 0.6750 holds, further downside is possible.
**Watch for a bearish rejection before entry.**
post-image
TIA-5.49%
This week, Bitcoin and Ethereum spot ETFs recorded a total of $548.55 million in outflows.
$BTC spot ETFs recorded a total outflow of $228.58 million, while $ETH spot ETFs recorded a total outflow of $319.97 million.
post-image
BTC-0.96%
ETH-1.64%
  • 1
Crypto Trade Today
live-cover
LIVE897
Good morning, $DOGE fam! 🤝🐕
Gm C X ☕️🌎
Happy weekend! ✌️🌦🍂
Dogecoin to the moon! 🚀🌑
post-image
DOGE-0.93%
Money is already piling in to assets pre-market, have they forgotten how these external markets operate? Its about to get very violent.
Hyperliquid, slaughter house edition.
post-image
HYPE-2.03%
⚠️ CAN P2P CAUSE A BANK ACCOUNT TO BE LOCKED?
A user shared the following experience after visiting their bank to ask about an account being flagged by the system for unusual transactions.
• Some transactions were only 10,000 - 50,000 VND but were still scanned because the transfer descriptions contained characters matching the system's warning patterns.
• The bank required them to sign a commitment confirming that they would not lend out their account to receive or transfer money.
• After that, the bank notified them that the account needed to remain locked for another 2 - 3 days for review.
post-image
EIA data determines the short-term direction of crude oil
live-cover
LIVE24
$CT I took the full -12.73% hit on this move: entered at 0.385, cut at 0.34, down 11 points. The post-mortem is simple: greed. Before the Fed minutes, I clearly saw $CT 24h volume shrink to just over 20M and large on-chain transfers start flowing out, but I still fantasized that dovish minutes would spark a rally. Instead, the minutes were hawkish, and $CT plunged straight through 0.35, hitting a low of 0.3155. I set my stop at 0.34 and at least stuck to my discipline, but the entry thesis itself was wrong—loading up on a small-cap token ahead of a macro event; correlation is no excuse, I was
CT-13.58%
Load More

Join 40 M users in our growing community

⚡️ Join 40 M users in the crypto craze discussion

💬 Engage with your favorite top creators

👍 See what interests you

Trending Topics

USSeptemberPPIBeatsExpectations

91.35k Views1.93k Discussing

US September PPI came in at 6.3% YoY, well above the 5.3% market expectation, pointing to renewed producer-side inflation pressure. Weekly jobless claims were 199K, broadly in line with forecasts. Could hotter inflation further reduce room for rate cuts, and what does it mean for $BTC, US stocks, and gold?

GateWCTCS9GlobalTradingCompetition

37.87k Views6.68k Discussing

GateBTCAndETHFuturesVolumeRanksTop3

53.8k Views1.81k Discussing

View More