
Square
Following
Hot
News
Notifications
Profile
Share your thoughts
placeholder
Article
[ NEW STREAMER ] MARKET UPDATE
live-cover
LIVE1,652
$BAT
UPDATE
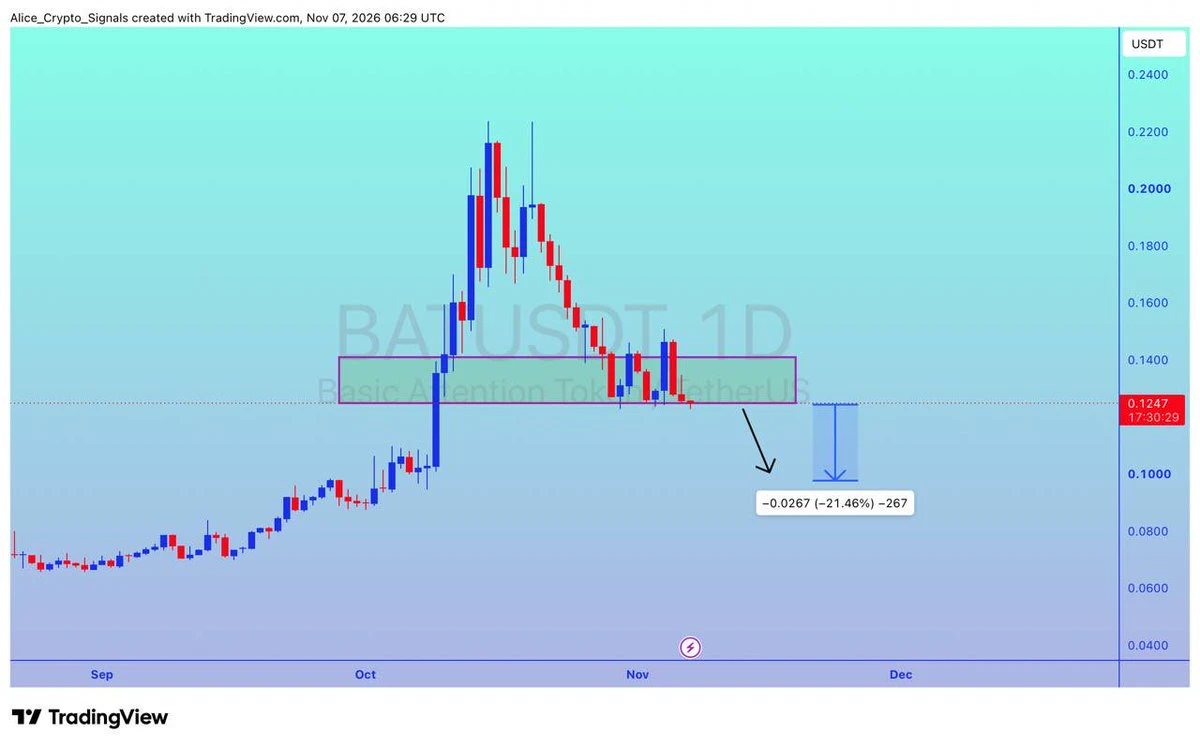
#BAT is looking for breakout. We can see 20%+ drop here ✍🏻
#BATUSDT #BATBTC #Bitcoin #Crypto #NFTs
post-image
BAT-6.72%
BTC-0.67%
Trenches
ZIG
Z
bade
b
ZIG
0x8c...1145
Market Cap
$.
Change
.
24h Vol
$.
Holders
.
BTC
B
bade
b
BTC
C5xp...pump
Market Cap
$.
Change
.
24h Vol
$.
Holders
.
Diamond
D
bade
b
Diamond
5VCE...pump
Market Cap
$.
Change
.
24h Vol
$.
Holders
.
GM
G
bade
b
GM
0x13...7777
Market Cap
$.
Change
.
24h Vol
$.
Holders
.
DOGE
D
bade
b
DOGE
DoGE...fm7R
Market Cap
$.
Change
.
24h Vol
$.
Holders
.
Rumors say GPT has started banning accounts en masse?
I bet it wouldn't dare ban a single account that logged in directly with an Apple ID👀
post-image
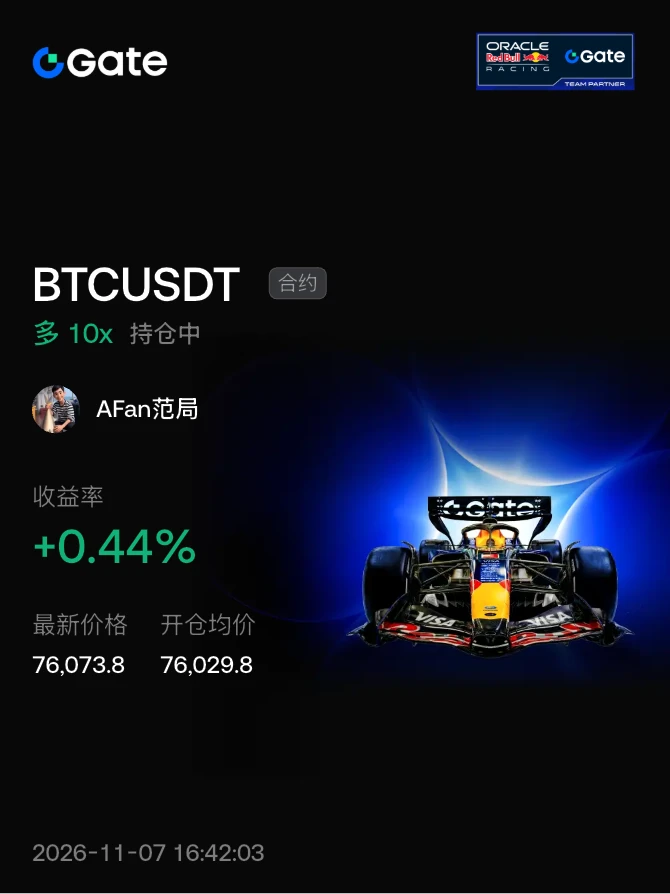
#晒出我的持仓收益 Feels like bro is about to make a big move.
post-image
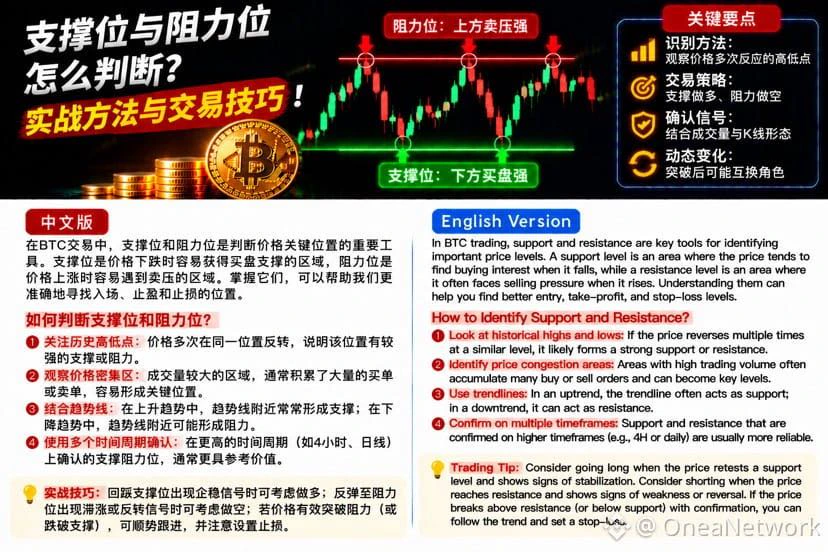
In BTC trading, there is a market phenomenon worth paying close attention to: after the price breaks below a key support level, the area that previously supported an uptrend may become resistance during the next rebound.
Why does this happen?
First, buying confidence changes. When BTC finds support multiple times in a certain price area, many traders choose to buy there. But once the price decisively breaks below that area, those who were waiting to buy may start sitting on the sidelines, weakening buying pressure.
Second, trapped traders start looking for a way out. Some investors bought near
post-image
BTC-0.67%
PoR answers “Do you have the money?”, while PoSEC answers “Where is the money held?”—these are two completely different questions

When FTX collapsed, many people began seriously looking into what “Proof of Reserves” meant for the first time. Then they realized that even if an exchange publishes a PoR, users’ funds may still be unsafe. Why? Because PoR answers only one question: Does the platform have enough assets to cover its liabilities to users?

But it doesn’t answer the second question: How exactly are those assets stored?

Gate’s newly launched PoSEC addresses precisely this gap that Po
NVDA+2.80%
  • 2
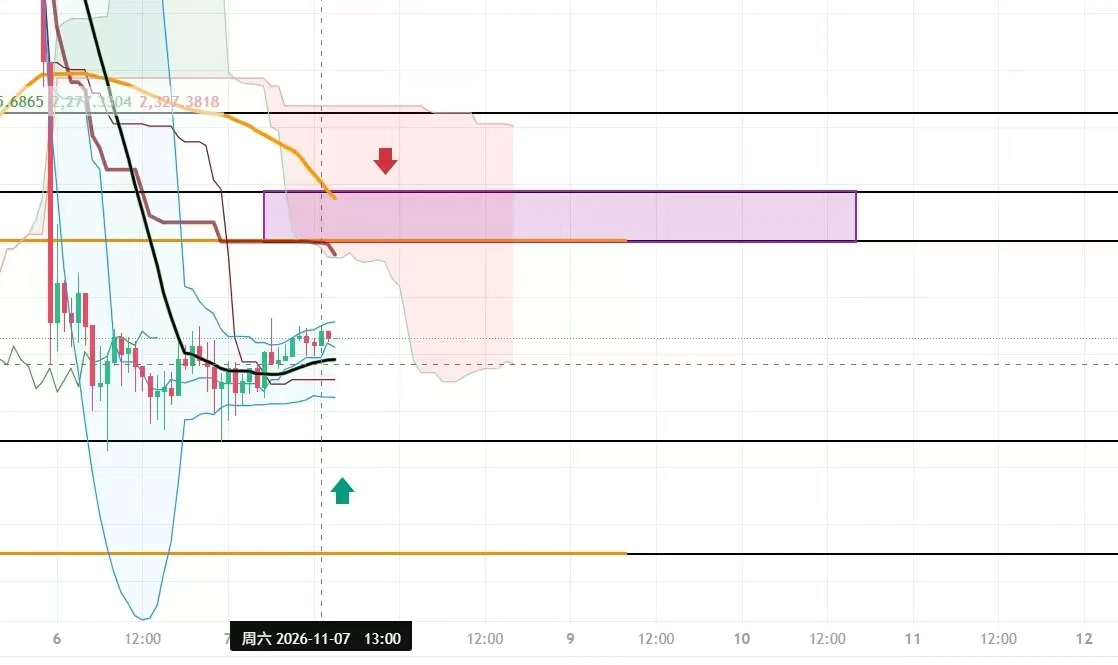
11.7 ETH Public Trading Strategy
【Short Trade Strategy】$ETH
  Entry range: around 2250-2270
  Stop-loss level: 2280
Zhiying's Take-Profit Tiers
  First target: 2230
  Second target: 2210

Trading factors: The price is at the lower Bollinger Band. The rebound after the MACD bullish crossover has not continued. Market depth shows that long positions are dominant, while liquidity is weakening.

Trading recommendation: Focus on range trading, shorting at the highs and buying at the lows within the 2180-2380 range.

Plan B $BTC $GT
Execute if the price does not reach the short entry range
ETH-1.23%
BTC-0.65%
GT-2.24%
#美股AI板块遭遇重挫

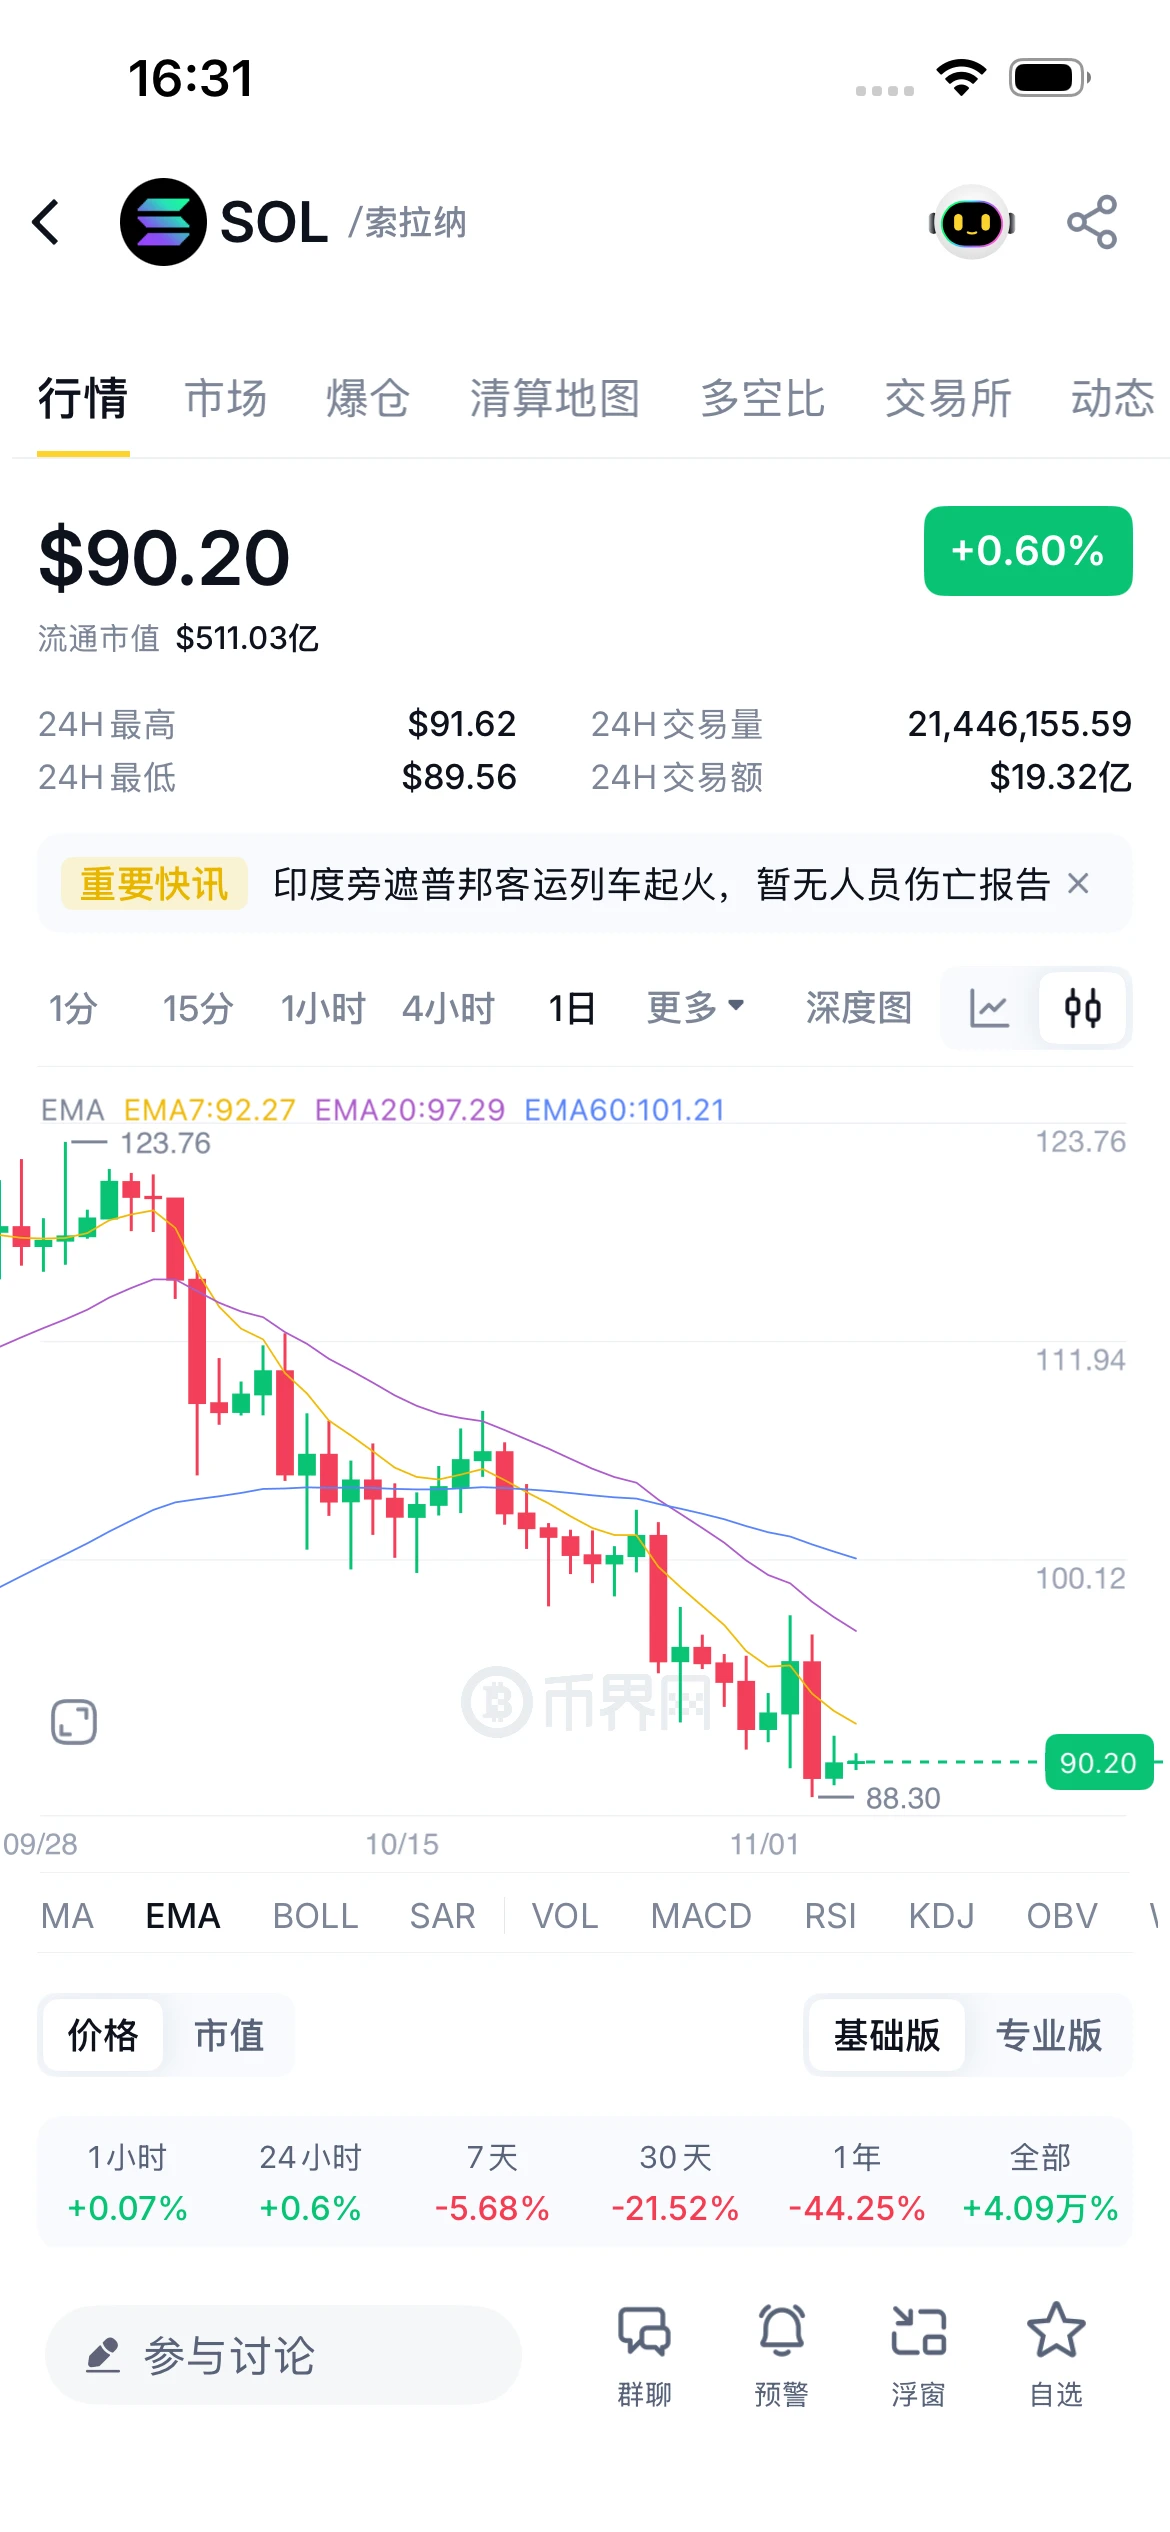
SOL tests the lows on the daily chart with a slight rebound; support at lows awaits recovery

Currently at 90.20 (+0.60%), stabilizing and edging up from the low of 88.30. On the 1-day chart, EMA7 (92.27) has crossed below EMA60 (101.21), forming a bearish alignment. Support has emerged at the lows after consecutive declines; reclaiming EMA7 would be the first confirmation. Intraday trading is likely to be choppy.

Scenario: If it stabilizes → holds above 88.30 and rises straight to 92.27; if it breaks below → first wicks down to 85.00, then sharply rebounds. Only a break below 8
post-image
SOL-0.74%
afternoon updates
live-cover
LIVE1,105
Volvo issued a statement saying that scammers are impersonating the company to spread false recall notices involving airbags and using links or QR codes to trick vehicle owners into submitting their information. Official recalls will never ask you to provide sensitive information or transfer money. SAIC-GM, BYD, AITO, BMW China, Volkswagen China, Li Auto, and other automakers have issued similar warnings.

If you receive a “recall” notice, don’t rush to comply—verify who sent it first. Scammers are better at customer service than automakers; at least they reach out to you first. Don’t scan unk
BTC-0.67%
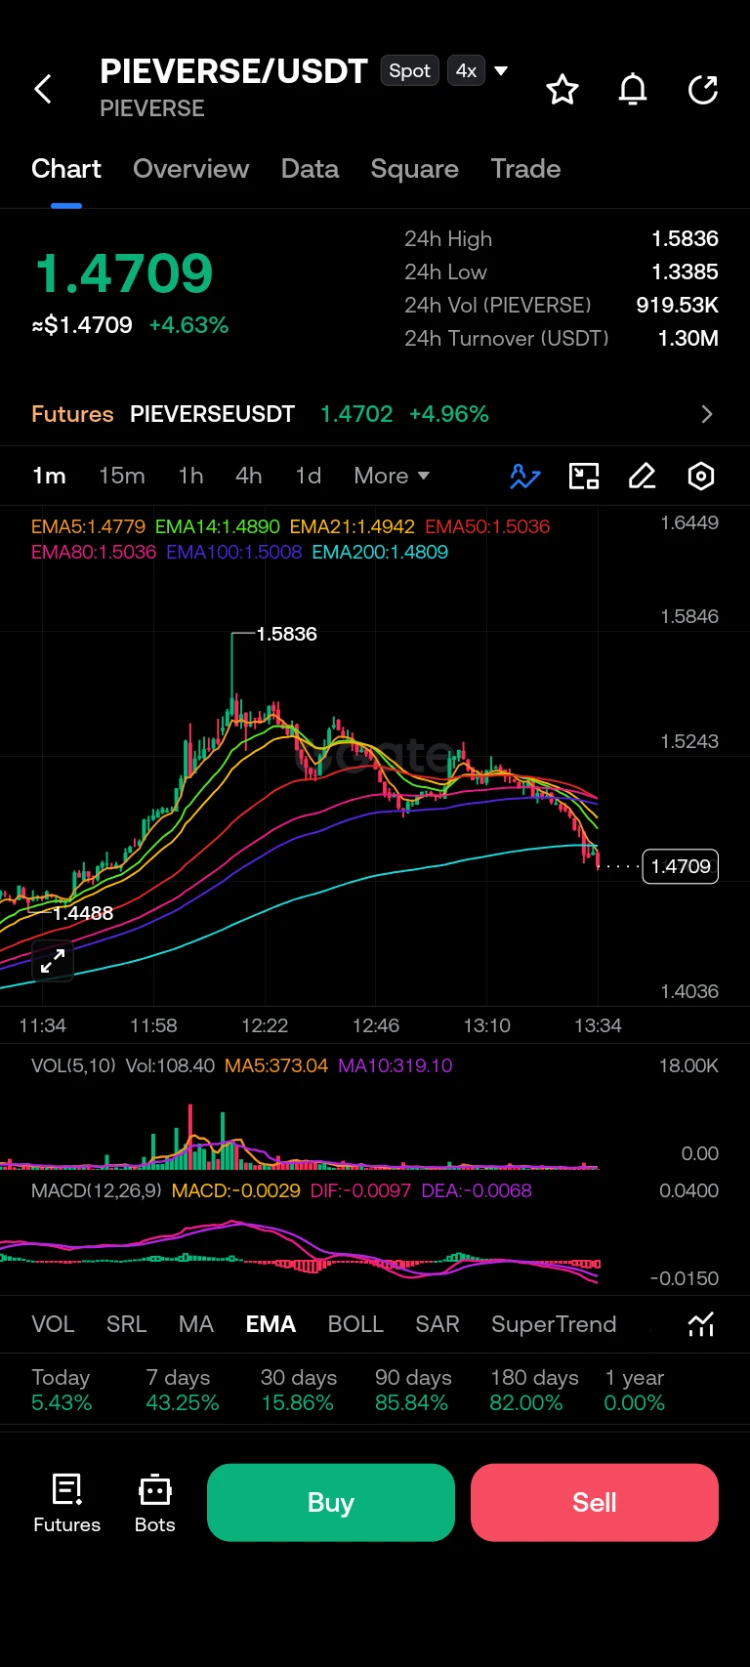
M1. 200 EMA just crossed
post-image
$APP ‌

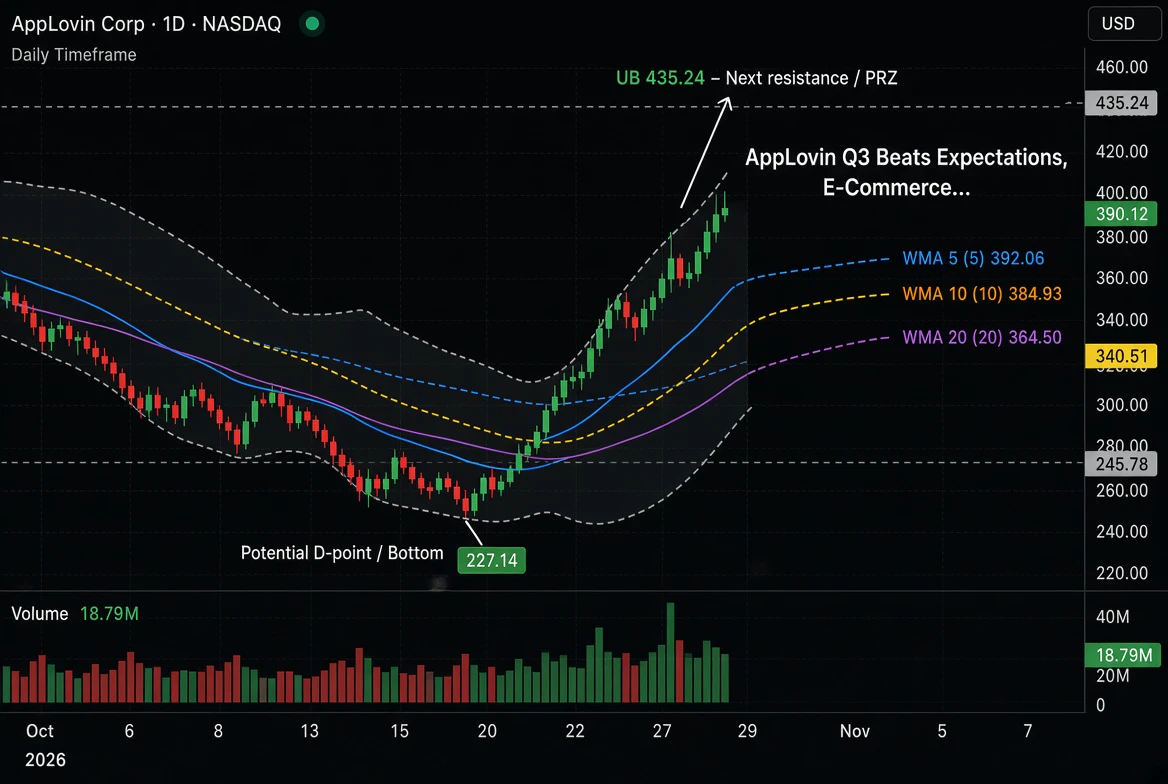
Decoding the Bull Run: Analyzing AppLovin (APP) with the Gartley Pattern

While the chart above for AppLovin Corp (APP) shows a massive bullish breakout (up nearly 10% in a single session), we can use the principles of the Gartley pattern and the visible technical indicators to understand the momentum behind this move and where the stock might be headed.

Analyzing the APP Chart

Looking at the daily chart for AppLovin, we see a textbook example of harmonic movement turning into a parabolic trend.

1. The "W" Formation (The Setup)
If we look at the price action leading up to the recen
post-image
APP+9.73%
  • 5
##GateGuardNowAvailableForFree

Gate is taking another positive step toward improving account security by making GateGuard available for free. This is important news for the entire Gate community because security should never be a luxury. Every user deserves access to tools that can help protect their account and digital assets.

In the cryptocurrency industry, account protection is extremely important. People use crypto platforms for trading, investing, staking, and managing their digital assets. With more people joining the crypto market, online security has become one of the biggest priorit
  • 3
In crypto, information moves fast.
One minute, nobody is talking about a project. The next minute, it's everywhere.
But being early to a conversation doesn't automatically mean you've found an opportunity.
Read. Research. Verify. Think independently.
Knowledge is an advantage worth developing.
#Crypto #DYOR #Blockchain #Web3
post-image
Ether is currently trading within a medium-term bearish framework, with this move being an oversold recovery rally following a deep decline. The daily bearish structure remains intact, with no confirmed trend reversal signals. Downward momentum on the 4-hour chart is gradually fading, and the market has entered a range-bound recovery phase. On the 1-hour chart, price has staged a modest short-term rebound, edging higher on support from the lows, and bullish sentiment on the shorter timeframe has improved somewhat. The three timeframes converge at 2279 to form resistance, making this the short-
post-image
ETH-1.26%
What Is Trading Expectancy? How Can You Tell Whether a Strategy Has an Edge Over the Long Run?

In cryptocurrency trading, some people review their win rate and look for better entry points every day, while overlooking a more fundamental question: If you repeatedly trade according to the same set of rules, how much will you earn or lose per trade on average over the long run?

That is the question trading expectancy aims to answer.

First, what is trading expectancy?

Trading expectancy is the theoretical average return per trade under a given strategy and set of statistical conditions. It ana
LIT | Long 🟢 | Bullish | 15m24h: +0.88% | Volume: 73.4M USDT
Long rationale: Price is above EMA200; EMA20/50/200 are in bullish alignment; RSI14 is 64.2; MACD histogram is positive; ADX14 is 20.3; volume is 0.92 times the 20-candle average; trend pullback/continuation.
Entry: 3.4907
Stop-loss: 3.4131
Take-profit 1: 3.5877 | Take-profit 2: 3.64591 | Take-profit 3: 3.72351
Entry price is for reference only; do not chase the price. This trading strategy is invalidated if the stop-loss level is reached. Technical analysis only; this is not investment advice.
$LIT
post-image
LIT-4.56%
$ESPORTS It wasn't long before it hit TP2 🔥🔥🔥 Whoa! 🤤🤤🤤🤤🤤🤤🤤🤤🤤🤤🤤🤤🤤🤤🤤🤤🤤🤤🤤🤤🤤PandaTraders has pulled off another perfect trade. Who caught this dump? Comment your profits below, and don't forget to move your stop loss into profit. ESPOPTSUSDT JobsReportRaisesHikeOdds CPITestsDecemberRateOutlook WillUS-IranTensionsBoostSafe-HavenDemand?
post-image
ESPORTS-5.30%
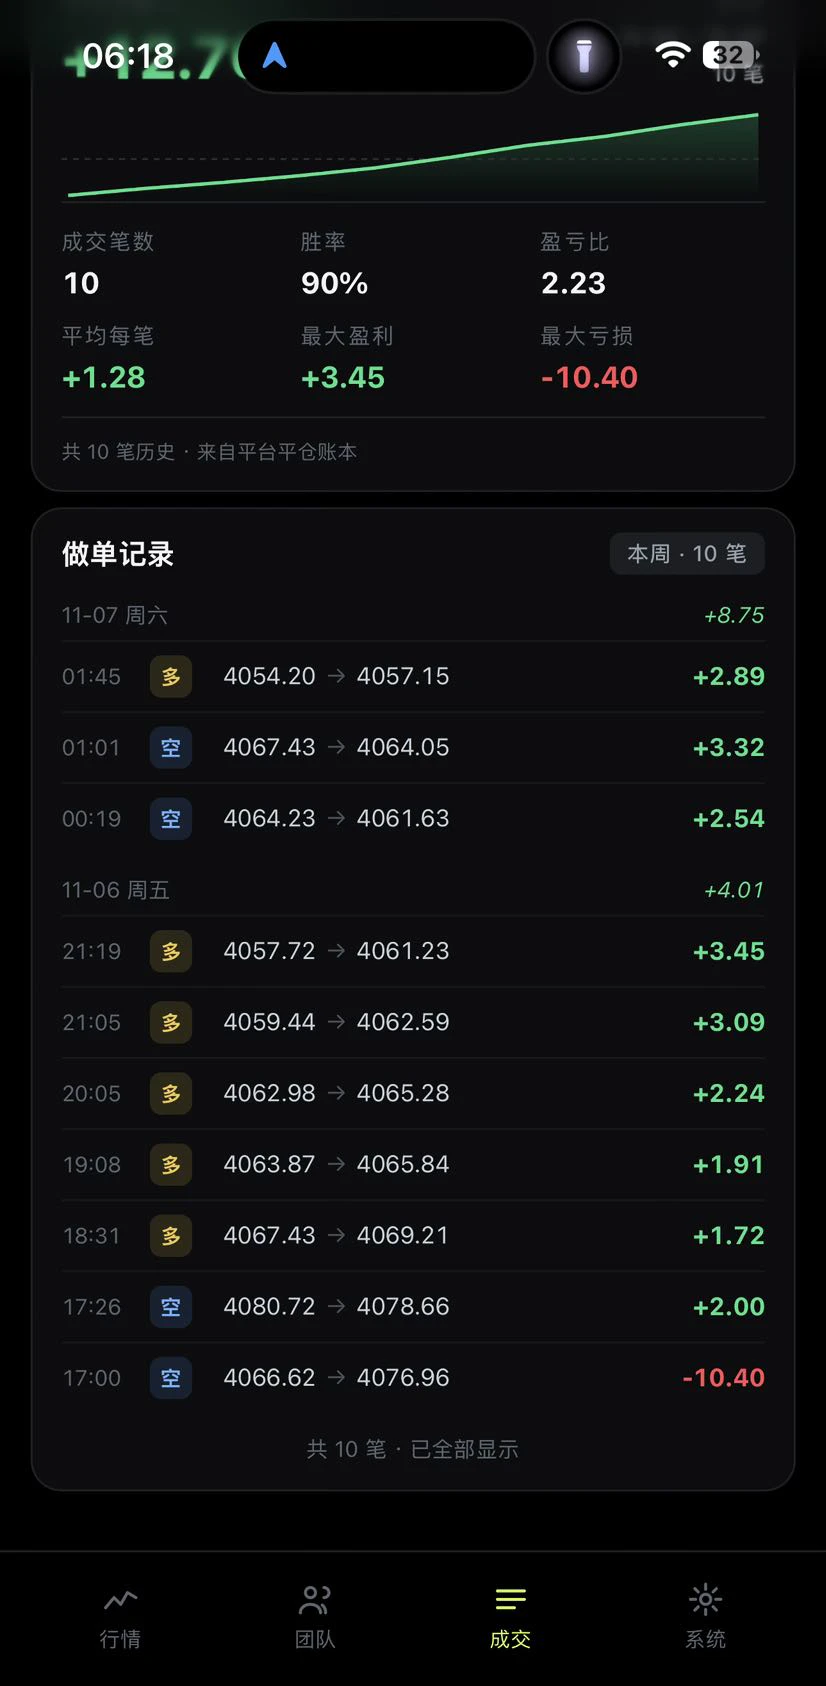
It’s November 7, 2026. I started with 60U and have now grown it to 127U, trading fixed 0.01 lots with 1,000x leverage. Why have I only made this much? Because this strategy took nearly a month of all-night research to develop.

Although I’ve only been trading officially for two short days, this system is pretty sharp at capturing market movements. Its win rate is actually 85%, with a maximum drawdown of 24%. You can see for yourselves from the timestamps and entry and exit prices in my trade history. No holding losing positions, no oversized trades—just steady gains from a high win rate.

My g
post-image
XAUUSD-0.45%
$FLYBRAIN This is garbage, what a damn rip-off
FLYBRAIN+2.84%
Load More

Join 40 M users in our growing community

⚡️ Join 40 M users in the crypto craze discussion

💬 Engage with your favorite top creators

👍 See what interests you

Trending Topics

USAIStocksHitHard

16.49k Views3.65k Discussing

U.S. stocks sold off sharply on Thursday, November 5 (UTC). The Nasdaq closed down around 5.5%, entering correction territory, while the Philadelphia Semiconductor Index plunged roughly 12%, with chip stocks including $NVDA and $AMD posting steep losses. Beyond profit-taking, investors are growing concerned about the pace of AI data center construction, capital spending, and future returns on investment. The key question now is whether the AI sector’s lofty growth expectations need to be repriced. Where do you think the next opportunities will emerge: chip stocks, tech giants, or other sectors?

USNonfarmPayrolls

24.51k Views4.26k Discussing

StakeOnLaunchpoolToShare450KVLX

3.17k Views779 Discussing

View More