Square
Following
Hot
News
Notifications
Profile
Share your thoughts
placeholder
Article
During a BTC Pullback, How Can You Tell a Normal Correction from a Trend Reversal?

In BTC trading, one of the most common mistakes is treating every drop as a trend reversal. As soon as the price pulls back, people rush to close their positions or even open short positions. But sometimes the market is simply undergoing a normal correction in an uptrend, after which the price strengthens again.

So, how can you distinguish a normal pullback from a genuine trend reversal?

First, watch the structure of highs and lows. In a healthy uptrend, the price typically forms progressively higher highs an
post-image
BTC-0.67%
$MVLL It crashed 13.79% in one day, dropping from 12.03 to 9.45, and now it’s at 9.94—this isn’t a pullback; it’s a panic-driven rush for the exits.
Let me start with an everyday example. Have you ever seen a market stall selling off its goods just before closing? Shrimp that sold for 12 yuan per jin in the morning gets dumped for 9.5 yuan in the afternoon because the vendor is in a hurry to get home. But there are two kinds of fire sale: either the shrimp has gone bad, or the vendor simply bought too much stock that day. What does $MVLL’s trading value of over 48 million tell us? Someone boug
MVLL-1.56%
  • 2
  • 2
Trenches
mihao
m
bade
b
mihao
4Cxj...pump
Market Cap
$.
Change
.
24h Vol
$.
Holders
.
FOOD
F
bade
b
FOOD
FTu5...pump
Market Cap
$.
Change
.
24h Vol
$.
Holders
.
IDOL
I
bade
b
IDOL
0x3b...ab07
Market Cap
$.
Change
.
24h Vol
$.
Holders
.
Sakura
S
bade
b
Sakura
9sFG...pump
Market Cap
$.
Change
.
24h Vol
$.
Holders
.
AGT
A
bade
b
AGT
0x5d...e274
Market Cap
$.
Change
.
24h Vol
$.
Holders
.
🪨 BLACKROCK DUMPS $143.53M IN BITCOIN!
BLK+0.48%
BTC-0.67%
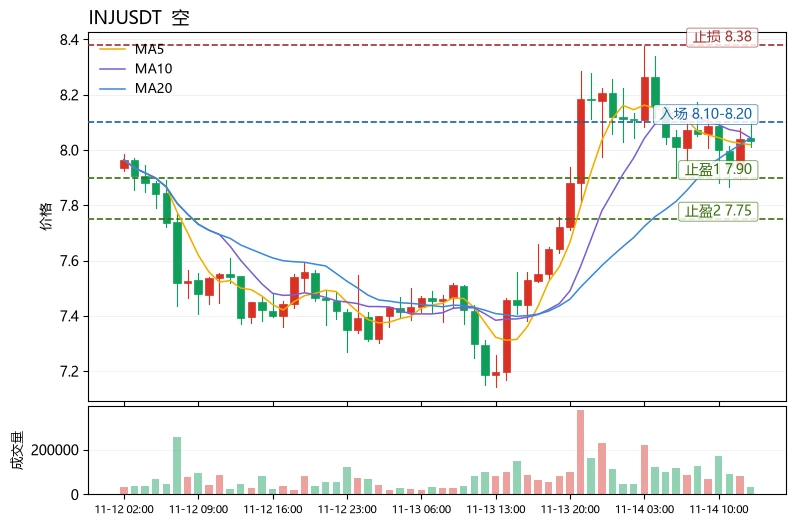
$INJ Current price 8.031, 24h +11.06%, trading volume 22.9M USDT, funding rate +0.0100%, Fear & Greed Index 13 (Extreme Fear). On the moving-average front, MA5=8.019 remains below MA20=8.043; the short-term average has just crossed above but not held, indicating a rebound recovery rather than a trend reversal. The MACD histogram at -0.02654 remains bearish, with momentum yet to turn positive. RSI 56.5 is neutral to bullish, leaving room to rise but not yet overbought. Bollinger Bands [7.74377, 8.34233]: price is trading just above the middle band, with the upper band at 8.34 as the first resi
post-image
INJ-1.67%
UNI+3.05%
HYPE+0.24%
During a BTC Pullback, How Can You Tell a Normal Correction from a Trend Reversal?

In BTC trading, one of the most common mistakes is treating every decline as a trend reversal. As soon as the price pulls back, people rush to close positions or even open short positions. But sometimes the market is simply undergoing a normal correction during an uptrend, after which the price strengthens again.

So, how can you distinguish a normal pullback from a genuine trend reversal?

First, observe the structure of highs and lows. In a healthy uptrend, the price usually forms progressively higher highs a
post-image
BTC-0.67%
You can always count on the ETH Foundation; they may not get things done, but they’ll definitely dump.
post-image
ETH-1.26%
🐋 WHALE WATCH : Strategy holds 850,364 BTC at an average buy of $75456.
Unrealized loss: $6.85B.
Saylors entire position is built on one conviction: dont sell. At this scale thats either the trade of the decade or the most expensive patience test in corporate history.
Still holding ?
post-image
BTC-0.67%
Today's AI U.S. stock info gap:
1. $NVDA fell another 4% and kept falling after hours, down for the 6th consecutive week and marking its longest losing streak in 14 years, dragging down the broader market
2. $DELL plunged 7% after Dell servers equipped with Nvidia chips were found at a data center in Shanghai; Dell quickly distanced itself and cooperated with an investigation into how they ended up in China
3. $OPENAI launched a lot of new products! It also launched Daybreak, where AI helps you conduct penetration tests, find vulnerabilities, and write patches; ChatGPT Wallet → can place or
NVDA-1.92%
DELL-7.26%
MSFT+0.22%
$UAI Longs, keep holding! Another clear surge in volume has appeared in the bottom area, and the stop-loss has still not been triggered, indicating that the bullish thesis remains intact. Those without a position near the current price can enter a long directly. The first target is 0.06; just patiently wait for the big players to push it higher. $UAI
Risk warning: The above is solely my personal market opinion and does not constitute investment advice. Contract trading carries extremely high risk, so be sure to manage your position carefully.
post-image
UAI-7.58%
  • 1
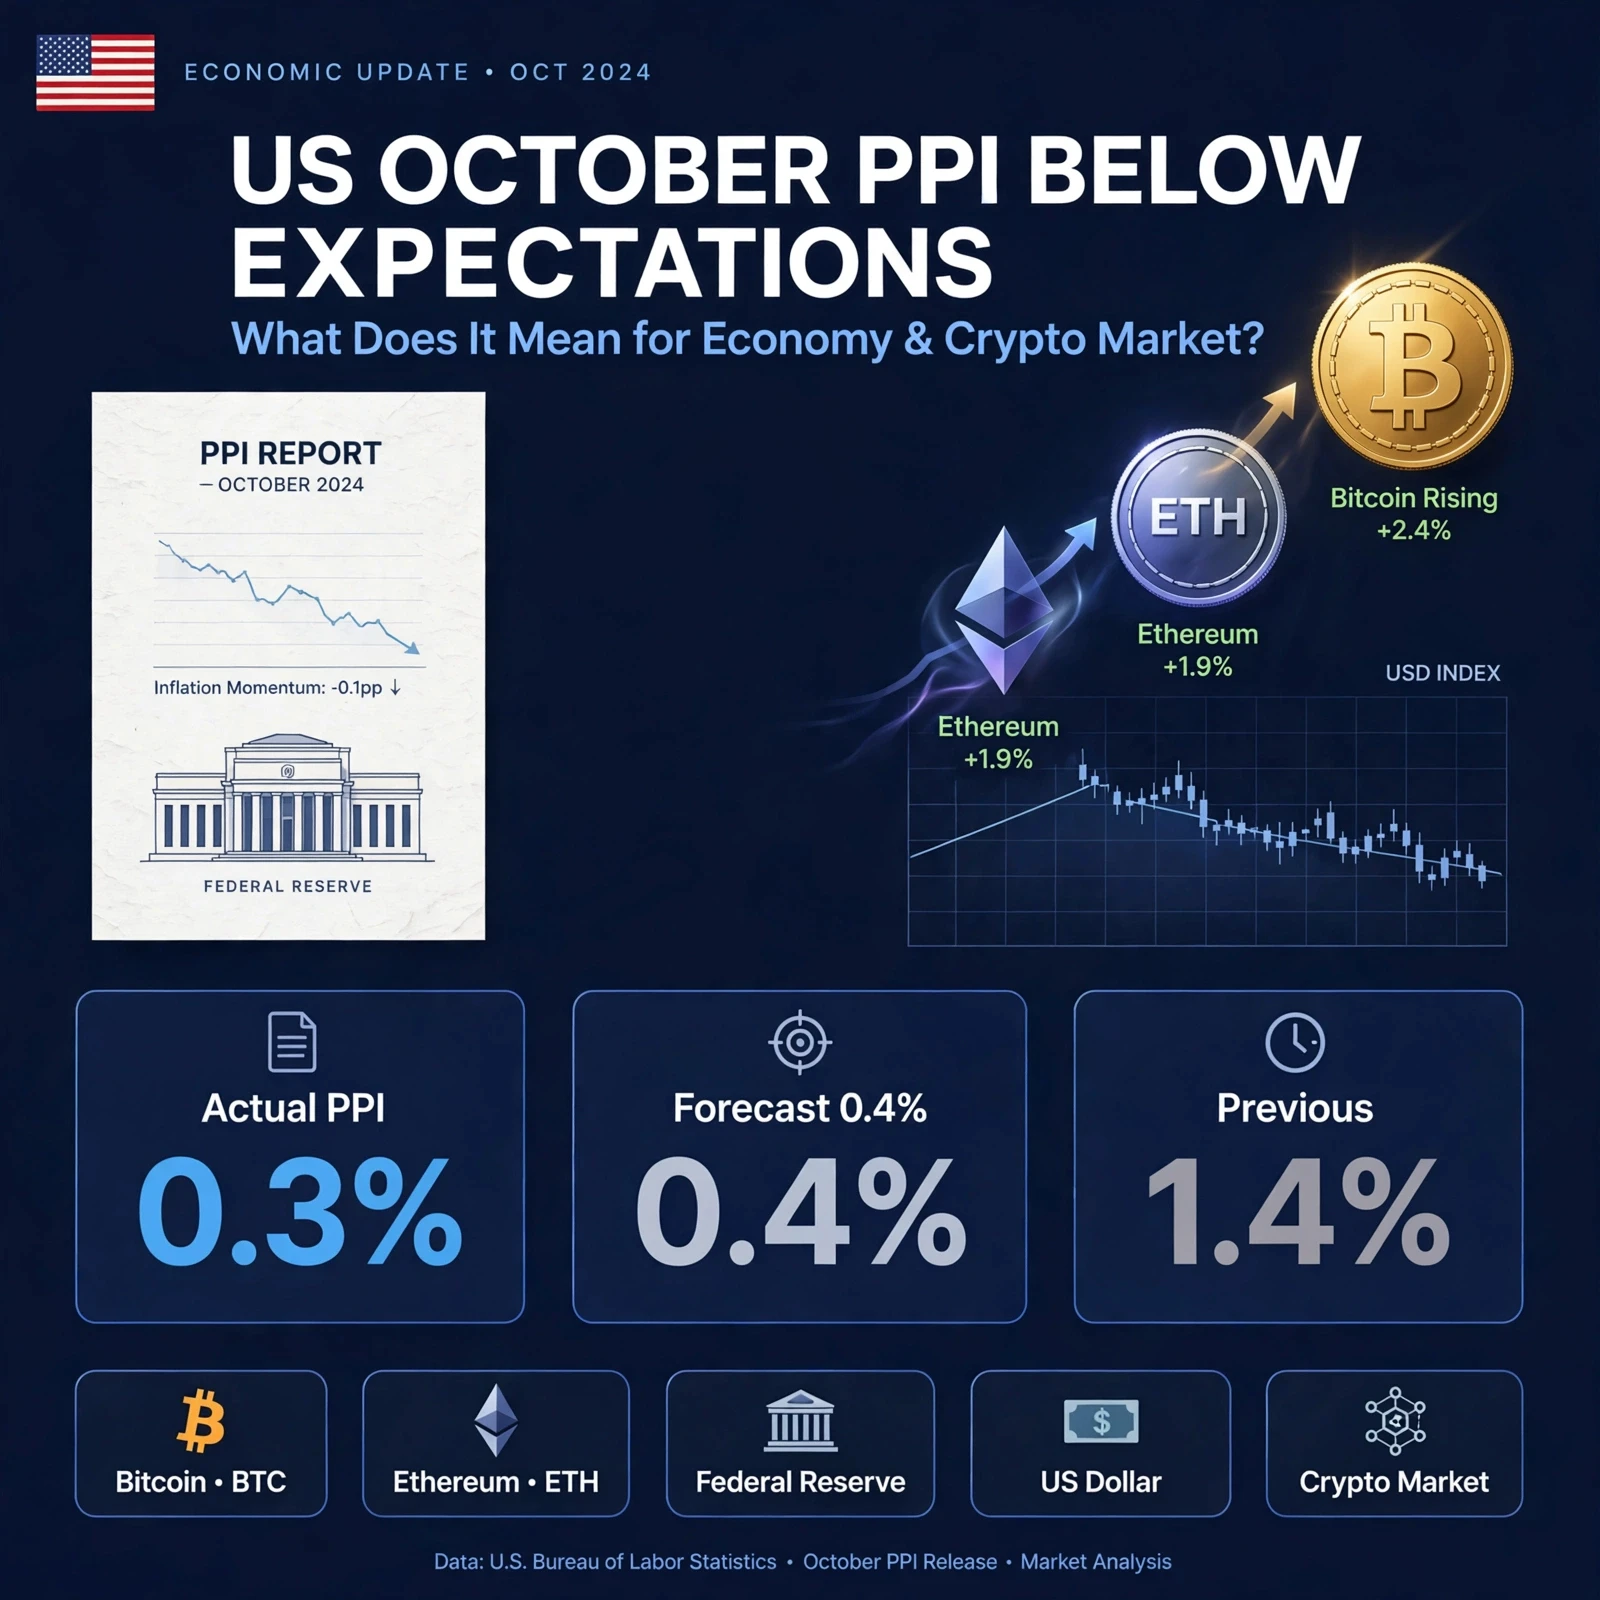
#USOctoberPPIBelowExpectations 🇺🇸 US October PPI Comes in Below Expectations: What Does It Mean for the Economy and Crypto Market?

The latest US Producer Price Index (PPI) report has delivered a slightly better-than-expected result, bringing fresh attention to inflation, Federal Reserve policy, financial markets, and cryptocurrency investors.

According to the October 2026 report, US PPI increased by 0.3% month-over-month, below economists' expectations of 0.4%. This is also a significant slowdown compared with September's revised 1.4% increase.

📊 Key Economic Highlights:

🔹 Actual PPI:
post-image
BTC-0.67%
ETH-1.26%
$DODOX I watched the charts the whole time and rode this 20% rally over the past 24 hours. The market maker’s playbook is so familiar—first pushing it down to 0.0262 to wear out retail traders’ patience, then at 2 a.m. using wash trades worth at least 30% of the 44M in trading volume to push the price above 0.029, waiting for FOMO buyers to jump in before pulling the orders and dumping into them. I entered at 0.0281 with a 20% position, and set my stop-loss at 0.0258. The logic: a high-volume breakout above the previous high of 0.028, followed by a pullback that holds. My mindset while holding
  • 2
  • 2
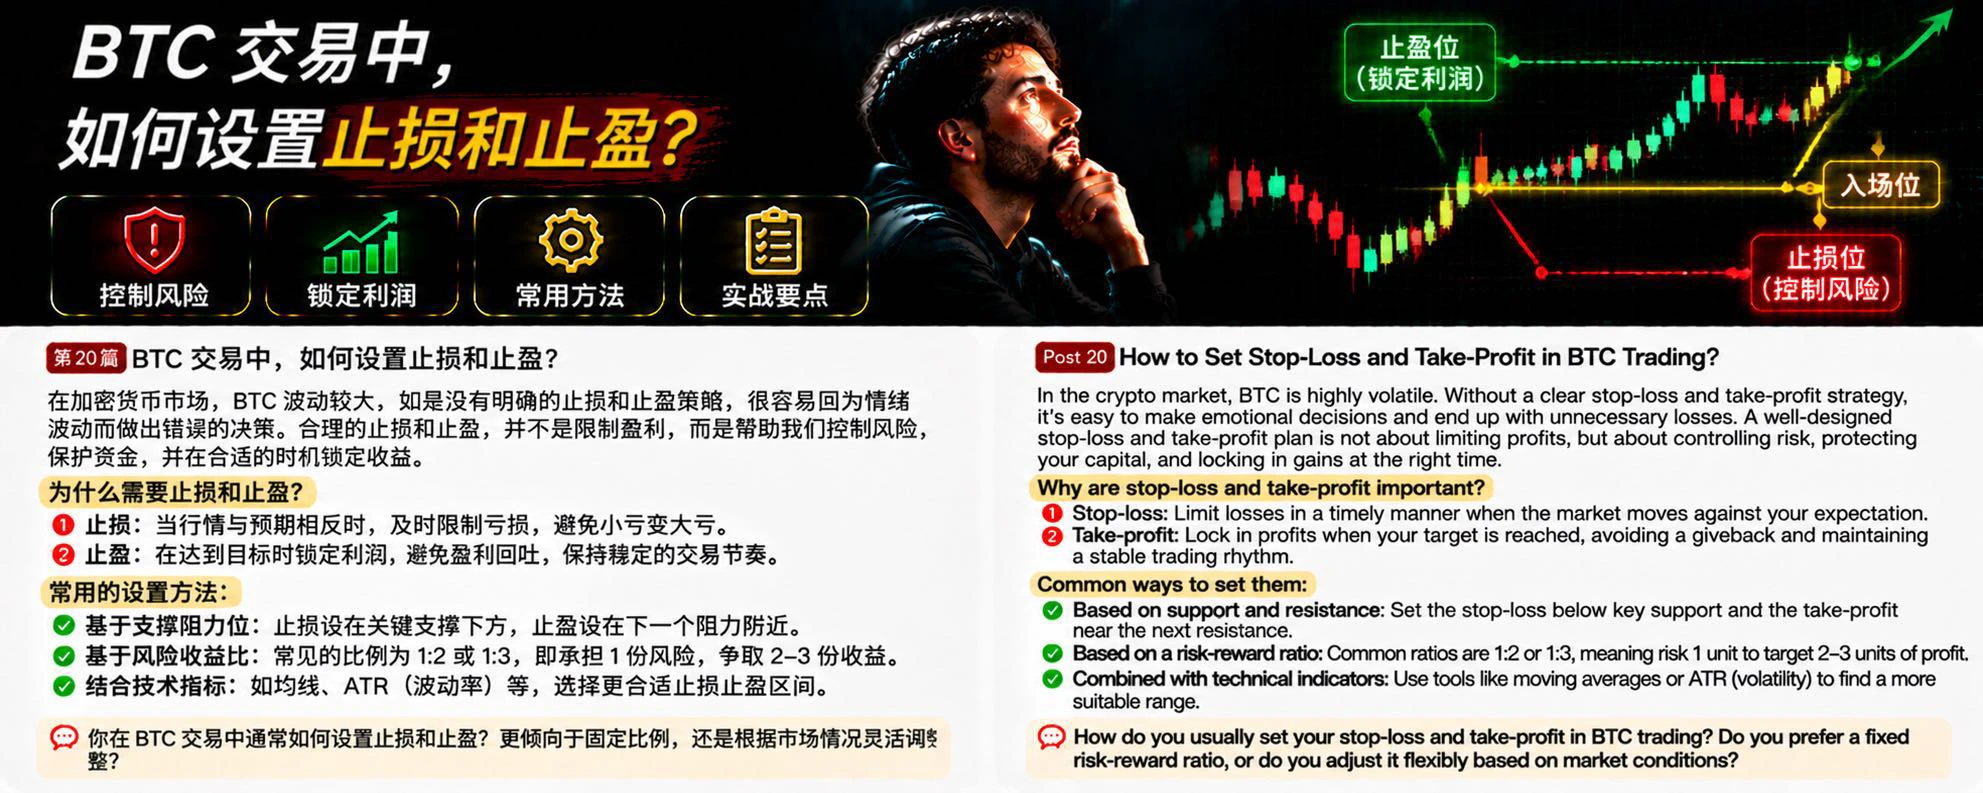
In cryptocurrency trading, many people spend a lot of time studying whether BTC will rise or fall, but overlook a more important question: even if your prediction is correct, you may still fail to make money without a reasonable stop-loss and take-profit plan.

Why are stop-losses and take-profits so important?

First, stop-losses are for controlling risk. When the market moves against your expectations, exiting in time can prevent small losses from continuing to grow. This is especially important in futures trading, where leverage amplifies the impact of price fluctuations on your account, so
post-image
BTC-0.65%
When BTC shows bearish divergence, does it mean a drop is imminent?

In BTC technical analysis, bearish divergence is often seen as an early warning that an uptrend may be weakening. But many traders rush to open short positions as soon as they spot bearish divergence, only to see the price keep rising instead of falling and ultimately get caught on the wrong side of the market.

So, how should you interpret bearish divergence?

First, understand the basic principle behind bearish divergence. When the BTC price keeps making new highs, but the highs on the RSI or MACD indicator gradually declin
post-image
BTC-0.67%
Bitcoin’s $69k defense battle has begun! Three price levels will determine whether bulls can turn things around

Bitcoin now looks like soldiers defending a city, facing three key lines, each of which could shape the market’s next move.
The first is around $67,900, where the 200-week moving average sits. If the price holds, a short-term rebound remains possible.
The second is $63,000–$66,000. If the first line of defense breaks, this range could become a key area for the next bull-bear battle.
The third is around $57,000–$59,000. This is a level to watch in a deeper correction scenario, not a
BTC-0.67%
USIDX+0.00%
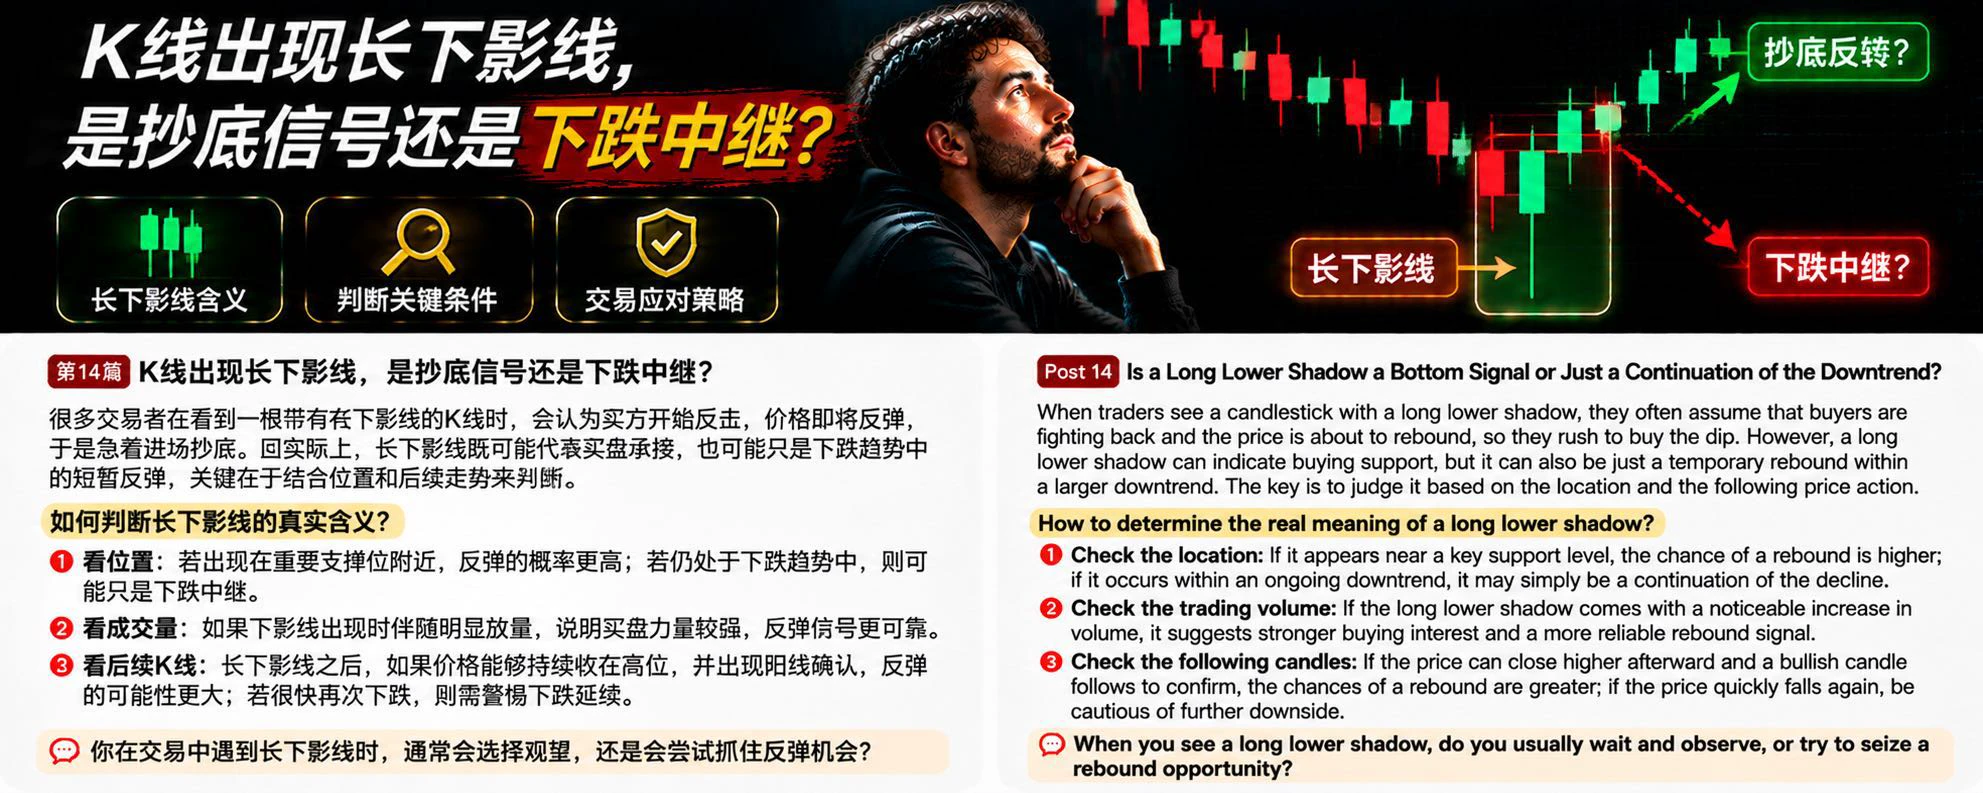
In BTC trading, many people see a candlestick with a long lower wick and assume buyers are starting to fight back and the price is about to rebound, so they rush in to buy the dip. But in reality, a long lower wick does not necessarily mean a trend reversal; it may just be a brief bounce during a decline.

So, how should you judge?

First, look at where it appears. If a long lower wick forms near an important support level from earlier, it may indicate strong buying interest in that area after the price fell there, making the rebound signal relatively more meaningful. But if it appears during
post-image
BTC-0.67%
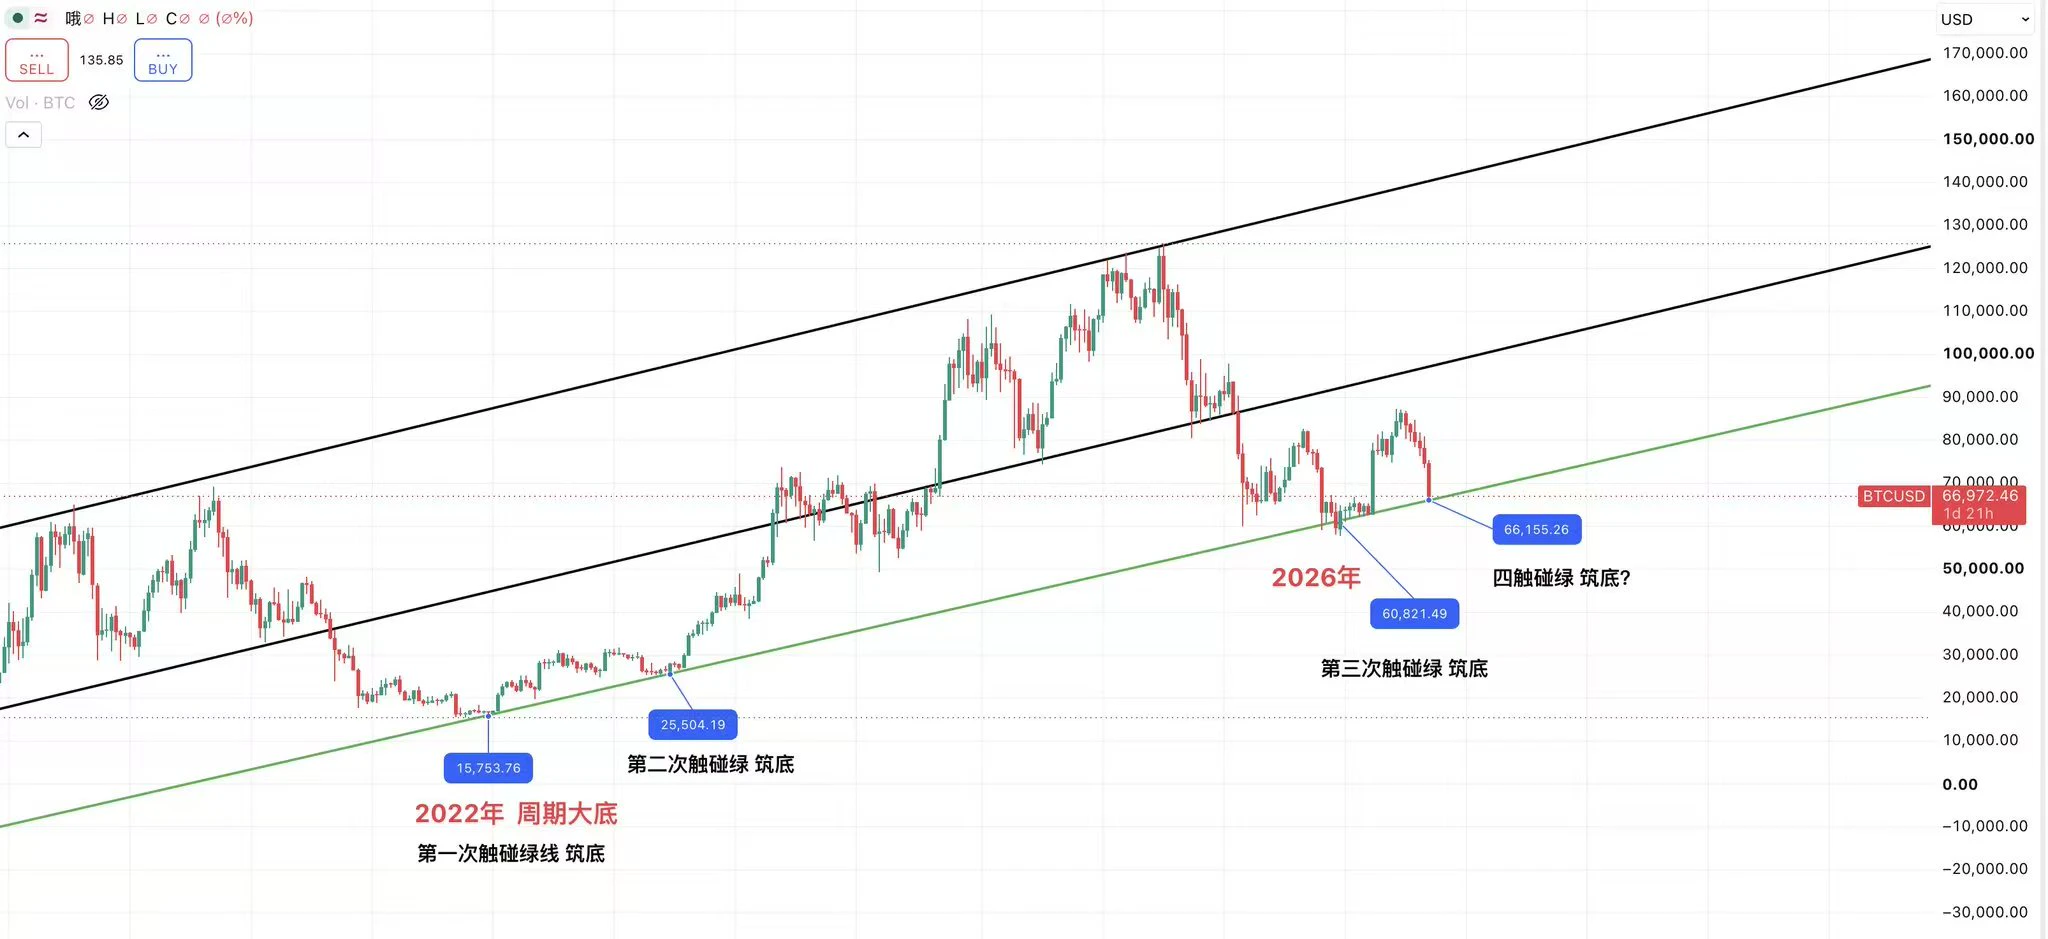
Bitcoin enters the bottoming zone

The 4th touch of the green line in 4 years

So fast—I didn’t expect it to reach around 66,000 today $BTC
post-image
BTC-0.65%
  • 1
  • 2
#GateOctoberTransparencyReport
Gate October 2026 Transparency Report: $8.68B in Reserves, $394B Derivatives Volume & Gate Money Expansion

Gate's October 2026 Transparency Report highlights a significant milestone in the platform's evolution. Beyond crypto trading, Gate is expanding into multi-asset investment, wealth management, payments, and integrated financial services under its vision of "One Gate, Everything Money."

The latest figures demonstrate growth across reserves, trading activity, and financial products.

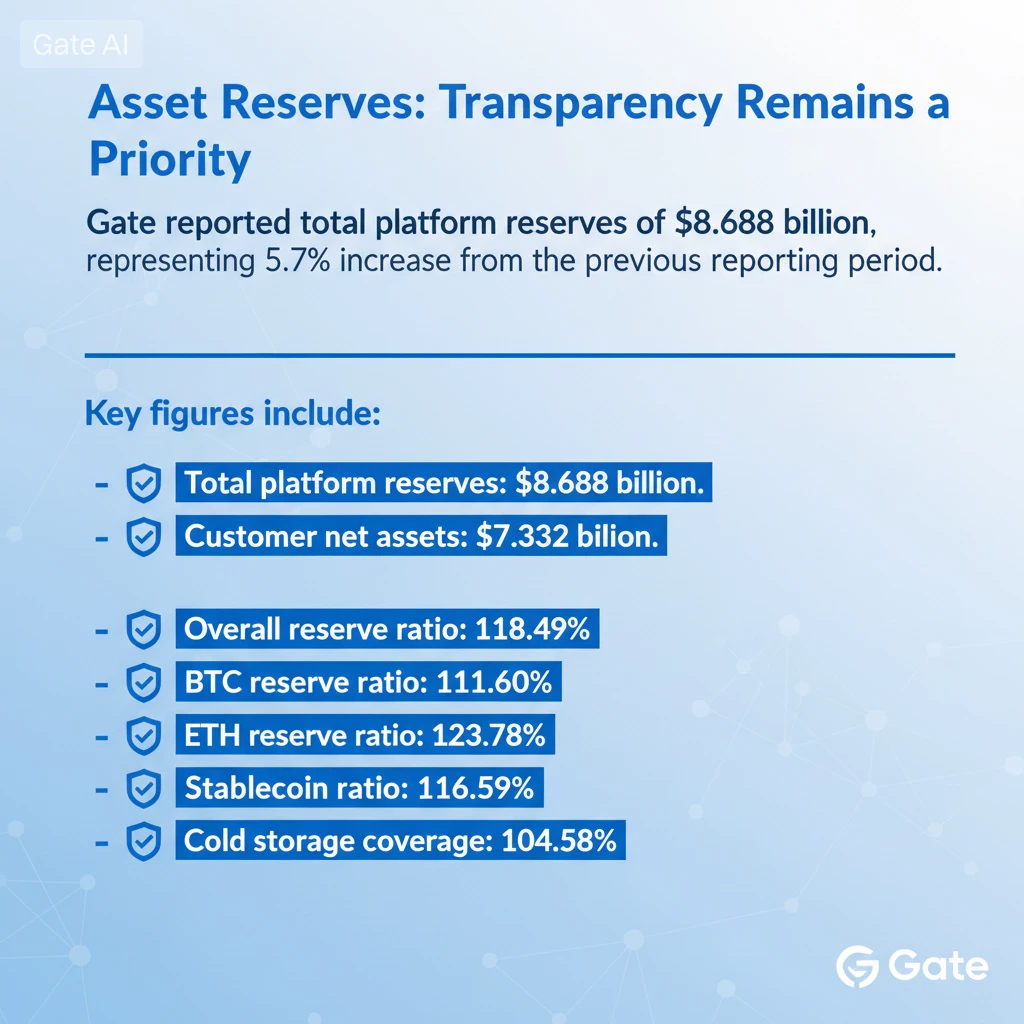
1. Asset Reserves: Transparency Remains a Priority

Gate reported total p
post-image
BTC-0.67%
ETH-1.26%
XAU+0.38%
  • 3
Market update
live-cover
LIVE5,143
A former FBI agent admitted stealing $2.47 million in cryptocurrency. He could face up to 20 years i
live-cover
LIVE1,327
Load More

Join 40 M users in our growing community

⚡️ Join 40 M users in the crypto craze discussion

💬 Engage with your favorite top creators

👍 See what interests you

Trending Topics

GateIPOAccessAnthropic

303.4K Views2.8K Discussing

Gate IPO Access Phase 3 features Anthropic (ANT), with USDT subscription interest starting from 100 USDT. Successful allocations will be delivered as real shares to Gate Stock Accounts. Indicative price: $70–$78/share Subscription: Nov 12–17 (UTC+8) Allocation is not guaranteed. Please manage risk accordingly.

Dr.HanOxfordUnionSpeech

147K Views580 Discussing

USOctoberPPIBelowExpectations

460.5K Views1.4K Discussing

View More