Square
Following
Hot
News
Profile
Share your thoughts
placeholder
Article
$NEAR The most interesting thing right now is not guessing whether prices will rise or fall, but seeing who is forced to change their tune first.
The bulls’ test is at 5.44, while the bears’ test is at 4.527. $NEAR is currently at 5.392, up 11.96% in 24 hours. One-hour support is 4.527, resistance is 5.44, and current volume is 0.31 times the average volume of nearly 20 bars.
For now, I’ll note that $NEAR remains strong, while the crowded positioning is already out in the open. I acknowledge that the trend is strong, but what matters next is not how much higher it can surge, but whether anyone
post-image
We could have been a beautiful combo, you and I...
post-image
$ICNT Up 21% in half a day, it surged straight from 0.1015 to 0.1371, with 13.7M in trading volume pouring in. That’s not the kind of volume retail investors can generate. I took a quick look on-chain just now: the top 10 addresses’ holding concentration hasn’t declined, indicating this move is not distribution but someone accumulating. On the macro side, here’s an anchor: during the week when the Fed minutes leaned hawkish, the 30-day correlation between altcoins and the Nasdaq surged to 0.78. Small-cap assets like ICNT have higher beta, so as long as rate-hike expectations don’t rebound, it
ICNT+23.50%
Bitcoin Support and Resistance Levels
live-cover
LIVE103
Intraday, Bitcoin’s rebound faced resistance and the bearish outlook remained clear. After rebounding to around 81700, it fell all the way, with the low reaching around 79800—the move was once again nailed perfectly!
From the current chart, the rebound after the previous sharp daily decline was merely a technical recovery. Selling pressure above remains heavy, MACD continues to maintain a bearish structure, rebound momentum is gradually fading, and the major trend remains unchanged. A rebound is an opportunity to short.
On the 4-hour chart, this rebound is a recovery bounce following the decli
post-image
BTC+0.47%
$FET took me through a trade like this: the hardest part is knowing when to exit.
This feels like a good spot. Close the position right here. Watching these two today: $SO and $BAT .
post-image
FET+4.90%
BAT+28.31%
Bullish on $SOCKS
post-image
$SKHY
The memory market is straight out of the hog cycle: prices rise, capacity expands; capacity expands, the market crashes; the market crashes, production is cut; production is cut, prices surge again. The entire industry is now pushing hard to ramp up production. If AI demand can’t outrun capacity, beware of the accelerated version of “storage means death” turning into “storage means king.” Those holding positions should wait for the November earnings reports, sell into the rebound, and keep something in reserve. Spend less time scrolling short videos—the sentiment is even more volatile th
post-image
SKHY-0.94%
BREAKING: TSMC posts a record quarter as Nvidia, Apple, Broadcom and AMD compete fiercely for its wafer capacity.
TSM-1.82%
NVDA-1.92%
AAPL-0.31%
AVGO-0.64%
AMD-1.47%
we crushed the PPI news 📊
$AAOI
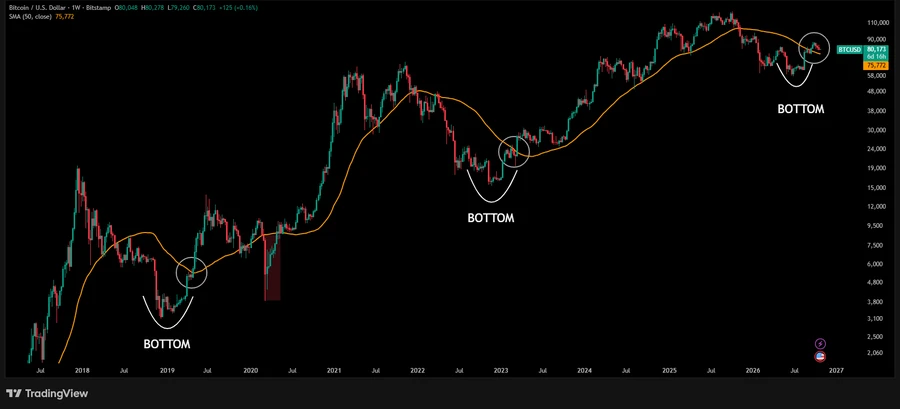
The correction continues. If the index hadn’t made a liquidity sweep, the other path would have remained valid. Today, it pulled back to the monthly EMA21-$74. On the other hand, it has also dipped as far as the support band during previous corrections. I normally use the support band as my reference for trends anyway.
I still think it’s forming a handle here. There’s no topping structure like the one at the 2017 peak
post-image
AAOI-2.87%
INDEX-2.45%
I need a memecoin
Low market cap
Shill me tickers $________? 🔥🚀💸
#100x #1000x #memecoin #Gems
post-image
MEME+0.40%
GEMS+1.25%
  • 1
elysium will be a lot of fun
you can already invest in elysium by accumulating kinetiq:native and nest-2:native
post-image
CPI Comes in Hotter Than Expected
live-cover
LIVE79
With the same 1000U, some people are holding the bag at $WAL 0.0677, while others who bottom-fished at 0.0502 are already laughing. It is now 0.0512, down 15.7% in 24 hours, with a 565M trading volume—what does that indicate? Panic sellers are fleeing, but with selling this fierce, who is taking the other side?
Round one: the volume showdown. A 565M trading volume at this market-cap level means the turnover rate has been pushed to the limit. Rising volume during a decline either means the main players are unloading or that the market is shaking out and rotating holders. What is the difference
WAL-21.09%
first day calling on @Pumpfun
bullish tek!
post-image
This is not a game... ✅️
Everything is fine!
🔥🐶🔥
$MU
Refined my Micron zones.
Fundamentally, we know this stock is cheap.
Currently trading at 8.85x EV/EBITDA, and its NTM EV/EVITDA at a shocking 3.91x; then, looking at the EV/REVENUE, it is currently trading at 7.24x, and its NTM EV/REVENUE is 3.52x.
But looking at the chart, we love a good entry despite the FA shouting buy. I am looking at two key levels
1. The demand zone of $782.03-$817.22
and
2. The July 2026 monthly low of $739.5
#NFA
post-image
MU+1.93%
Sky has burned 7.37M SKY in its second monthly burn, roughly 2.6x the 2.86M SKY removed in the first. Each burn is funded by 5% of Sky's monthly net protocol surplus.
@SkyEcosystem
SKY+0.96%
While XRP has seen significant developments on the institutional front, its price has followed a more cautious trend. Despite approximately $1.8 billion in net inflows into XRP exchange-traded products (ETPs) over the past 13 weeks, the token’s price currently sits at $1.39—a decline of over 8% in the last week alone. This divergence raises a fundamental question that is now at the forefront of investors' minds.
The developments on the institutional side are noteworthy. Evernode—a company holding 473 million XRP and $300 million in cash—has begun trading on the Nasdaq under the ticker symbol X
post-image
XRP+0.59%
  • 8
  • 1
Load More

Join 40 M users in our growing community

⚡️ Join 40 M users in the crypto craze discussion

💬 Engage with your favorite top creators

👍 See what interests you

Trending Topics

USSeptemberPPIBeatsExpectations

91.35k Views1.88k Discussing

US September PPI came in at 6.3% YoY, well above the 5.3% market expectation, pointing to renewed producer-side inflation pressure. Weekly jobless claims were 199K, broadly in line with forecasts. Could hotter inflation further reduce room for rate cuts, and what does it mean for $BTC, US stocks, and gold?

DrLinHanSpeaksAtOxfordUnion

135.63k Views1.86k Discussing

JapanAndKoreaStocksPlunge

47.27k Views1.76k Discussing

View More