Share your thoughts
placeholder
Article
Everyone’s staring at LTC’s 50.3—but the real trap is hiding below 50.2.

$LTC /USDT - SHORT

Trade Plan:
Entry: 50.2 – 50.4
SL: 51.3
TP1: 49.6
TP2: 49.1
TP3: 48.3

Why this setup?
- RSI (15m) at 41.97 says sellers aren’t exhausted yet—momentum still points down.
- 4h frame is armed SHORT at 50.3, with TP1 at 49.6 and TP2 at 49.1, while 1D stays range-bound—no bullish rescue coming.
- ATR (1h) of 0.409 means a clean 1% slide is normal volatility, not a fakeout.
- Why now? Price is hugging the entry ceiling; the invalidation at 50.2 is the only thing keeping bulls alive.

Debate:
If 5
LTC-1.82%
🚨 GPT-6-Astra has quietly become available on the Pro plan!
First, update Codex CLI and the app to the latest version. Although the model switcher is not yet visible on the web, Codex can already be used ahead of the official rollout.
If it is not displayed in the interface, directly modify:
~/.codex/config.toml
model = "gpt-6-astra"
review_model = "gpt-6-astra"
Save the changes and restart Codex to try it.
The web version has not caught up yet, but CLI users can already start using it.
#Codex #GPT6Astra #OpenAI
post-image
$1000 to $100,000 Crypto Trade Challenge Today
live-cover
LIVE494
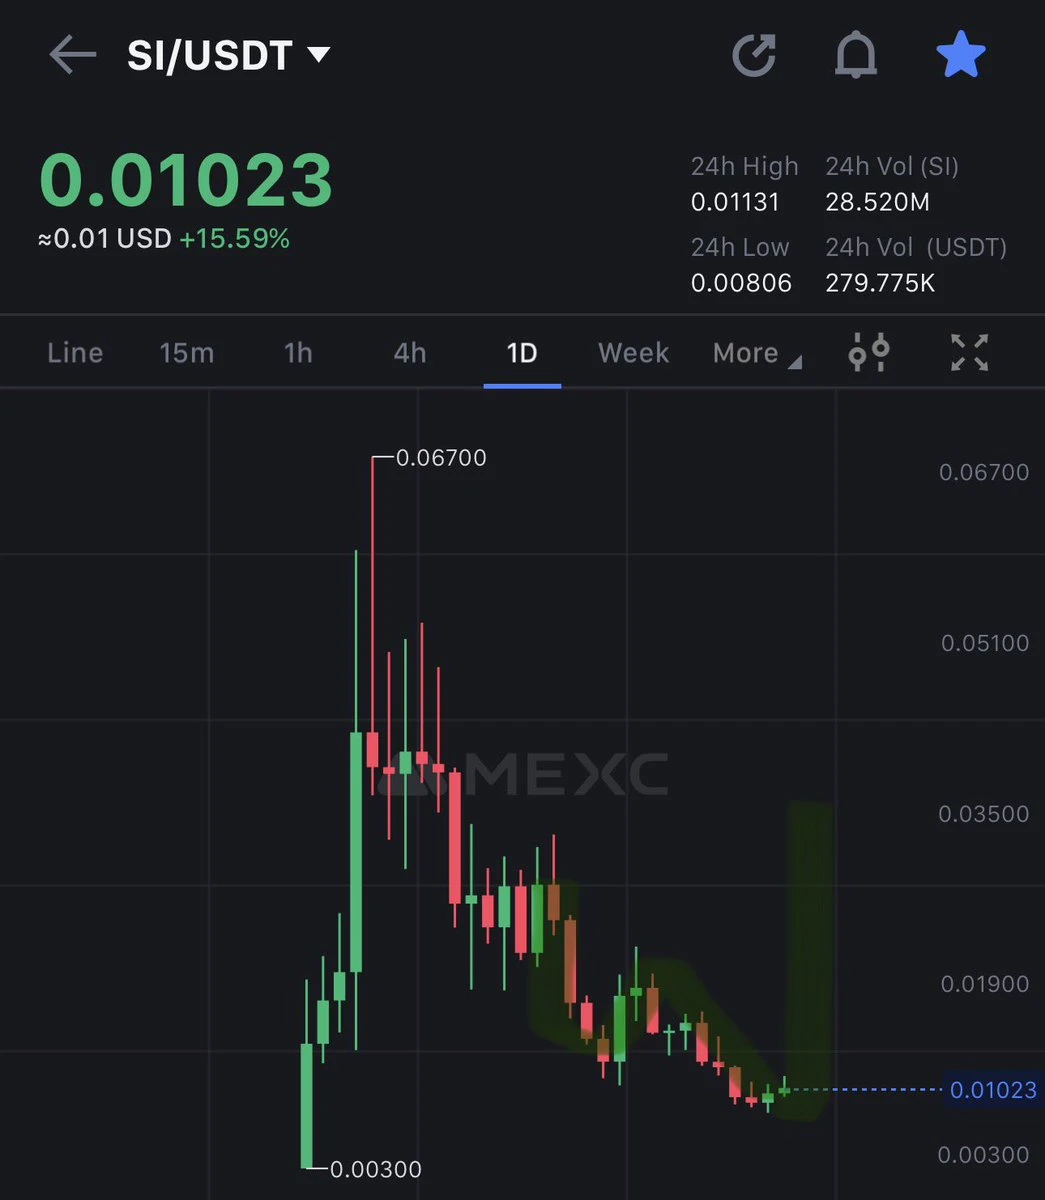
I was just about to go to the forum and rant, but then I saw my balance and thought, forget it—the market is always right. A few days ago, I was still lying in bed before sleep, struggling over whether to cut losses on $SIREN . When I woke up this morning, I found that the candlestick chart had figured out the direction on its own.

When the market was dumped early in the session, I watched for a while. The resistance above was obvious, and the rebound was weak—every upward push fell just short. Isn't this a textbook bull trap? While everyone else was sitting on the sidelines, I directly place
post-image
SIREN-1.40%
SNDK+11.61%
ETH-2.14%
$ZEC and $XRP are showing strength. But is altseason really starting?
I’d be careful with that conclusion.
The important signal isn’t two coins outperforming. It’s whether capital starts rotating across a wider part of the altcoin market.
#BTC ’s pullback after stronger U.S. jobs data adds another layer to the move, with higher Treasury yields putting pressure on risk assets.
So the real test from here is simple:
Does the strength broaden?
More altcoins outperforming BTC + stronger volume + deeper liquidity would make the rotation much more convincing.
Until then, I see this as selective str
post-image
ZEC+7.30%
XRP-4.98%
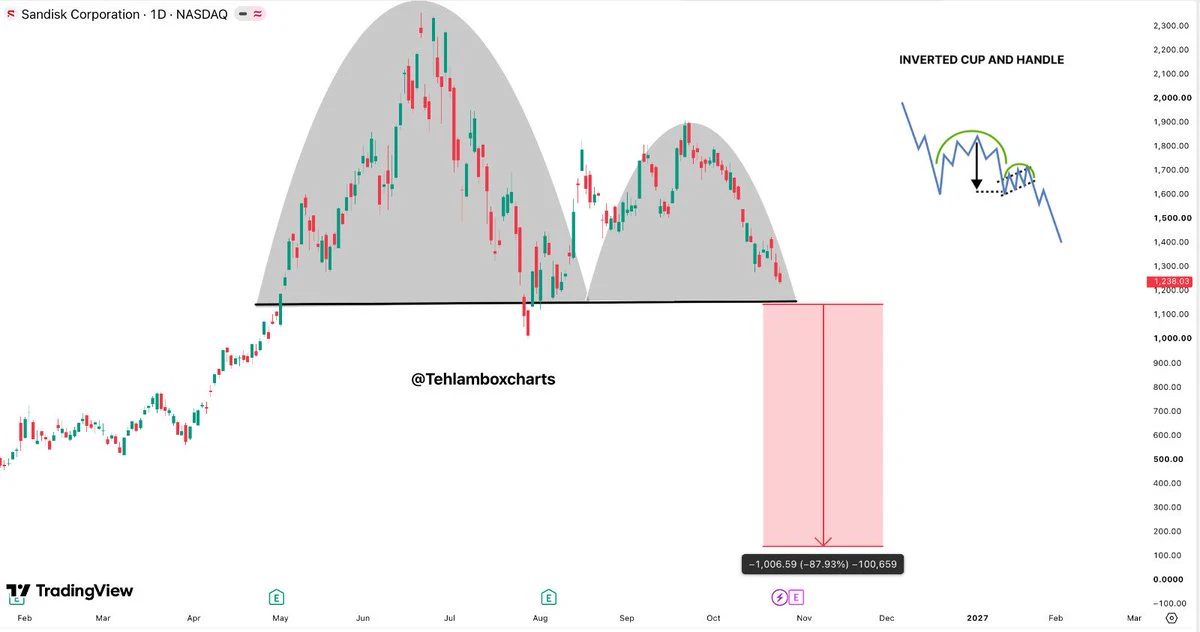
On September 2, I took a heavy position in 30 shares of SanDisk. I made 900 but didn’t sell, and ended up selling for a profit of only a few dozen. There was nothing I could do since it didn’t surge. Yesterday I placed orders for three or four shares, but it didn’t wick down even once to let me buy in. Well, today it rose to over 1,700, and I missed it.
I’ve found that once you figure out U.S. stocks, they’re more fun to trade than BTC and ETH: the volatility is higher, making them suitable for swing trading; you can also easily get trapped, and they’re suitable for studying cycles and sectors
post-image
SNDK+11.88%
I'm trading on Gate, a top-tier exchange with a 13-year track record. Come join me and dive into the hottest events right now!
https://www.gate.com/campaigns/6126?ch=6977&ref_type=132
$NVDA$MU$SNDK
post-image
NVDA+0.87%
MU+5.89%
SNDK+11.88%
$TRX Faces Resistance Perfectly On The Trendline To The Pink Ascending Triangle ✅️
post-image
TRX-0.09%
Ripping a long on Bloom Energy $BE, a stock that Nancy Pelosi recently bought, on this daily breaker candle.
This has got to be one of the best charts in all of finance right now.
post-image
BE+7.42%
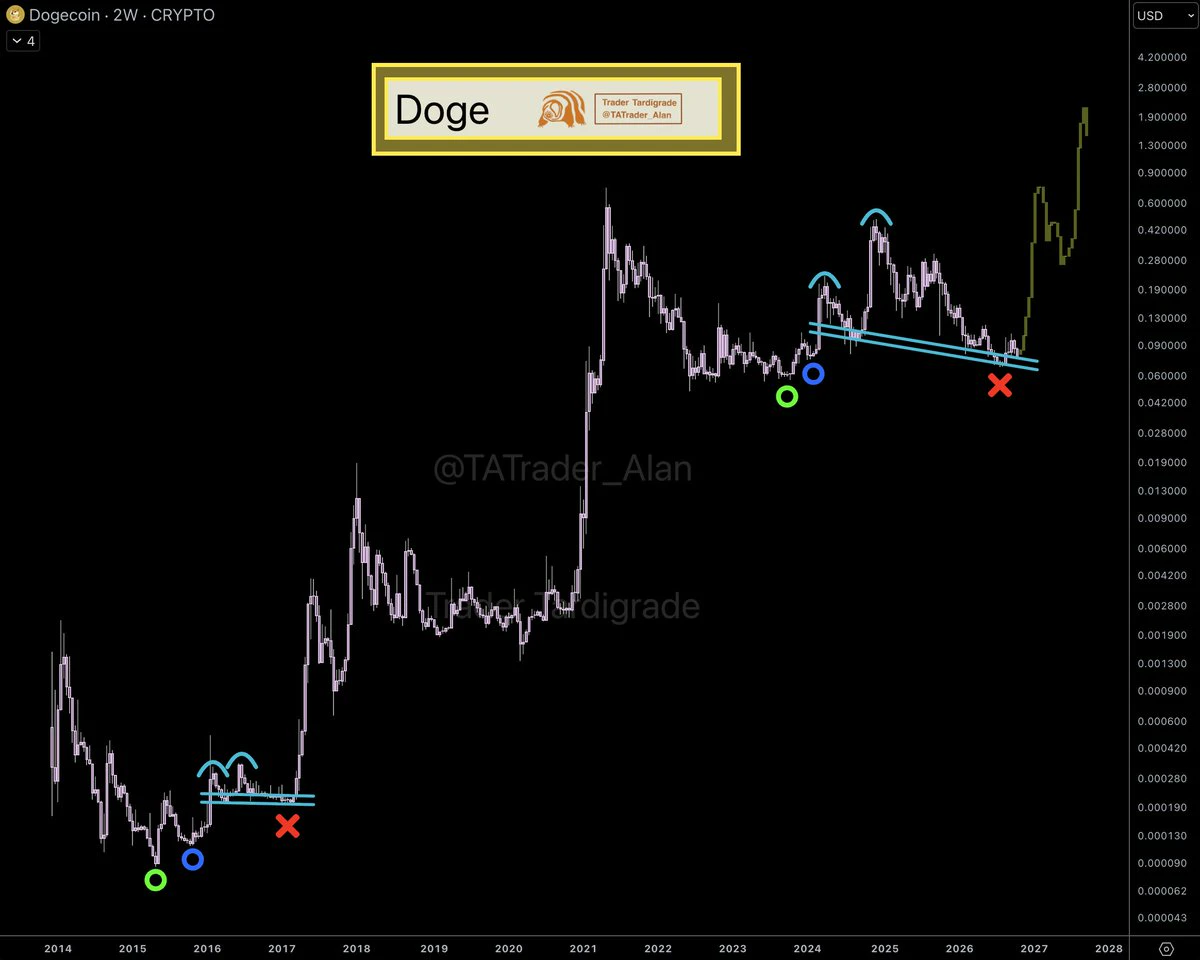
$DOGE I’m bearish on this move. As the price fell 4.5%, the retail long-short ratio rose from 2.3025 to 2.5907, while the large traders’ ratio only moved from 3.4061 to 3.5101—the retail crowd is catching the falling knife, while smart money has not followed. The three-period funding rate fell from 0.0100% to 0.0054%; longs are unwilling to pay a premium. These long positions are newly opened weak hands, not vacancies left after shorts were squeezed out, with 230 million in open interest sitting on a layer of cost bases that could be abandoned at any moment. There is only one condition for tur
post-image
DOGE-4.50%
【$Lobster Signal】Long | 1H Band Hugging + MACD Expansion Across Both Timeframes
$Lobster RSI 1H 86.14, current price 0.093252 hugging the 1H Bollinger upper band. The 16:00 candle touched 0.1027 before closing back at 0.0899, with overhead supply not yet cleared. The 17:00 and 18:00 candles both closed above 0.0930, with buyers retaking control. The MACD 1H histogram is 0.0017 and the 4H histogram is 0.0015, expanding in sync across both timeframes. The funding rate is 0.0777%, raising the cost of long positions. Sell orders slightly outweigh buy orders in the order book, but the price is hold
post-image
龙虾+20.35%
BTC-1.95%
ETH-2.13%
SOL-3.29%
【$Lobster Signal】Long | 1H Overbought + MACD Expansion
$Lobster RSI 1H 86.14, MACD histogram expanding at 0.0017, price 0.0932 hugging the upper Bollinger Band. The 4H upper wick touched 0.1027 before retreating to 0.0930, with a buy/sell ratio of 0.52.
🎯Direction: Long
⚡Entry/Limit Order: 0.09297224 - 0.09325200
🛑Stop Loss: 0.09231948
🚀Target 1: 0.09465078
🚀Target 2: 0.09535017
🛡️Trade Management:
- Reduce the position by 50% upon reaching Target 1 and move the stop loss to breakeven. Exit automatically if the price falls back to the entry level.
The order book depth ratio is 0.96, the f
post-image
龙虾+20.35%
BTC-1.95%
ETH-2.13%
SOL-3.29%
Everyone’s watching Bitcoin—but ONDO just flashed a 95% confidence signal that nobody sees coming.

$ONDO /USDT - LONG

Trade Plan:
Entry: 0.3554 – 0.3578
SL: 0.3451
TP1: 0.3653
TP2: 0.3710
TP3: 0.3797

Why this setup?
Why now? The 4H setup is textbook:
- Price parked at 0.3566, right on the 1H pivot—not chasing, waiting for the trigger.
- RSI (15m) at 48.16 means we’re not overheated; there’s room to run before hitting overbought.
- ATR (1h) of 0.0048 shows volatility is coiling—tight springs break hard.
- Daily trend is bullish, so this pullback is a gift, not a reversal.
The in
ONDO-2.37%
I originally only planned to test the waters with a small position, but it turned out to be underwhelming? No, it delivered a huge move! As prices repeatedly fluctuated intraday, I watched the order book for a long time. Every dip held above support, while the price-volume action actually grew healthier and healthier. My intuition told me this move had potential. I went with the pullback during the day and entered at 4.828. When I opened the app again after lunch, it had already reached 6.208, pushing the return to +2022.22%. My account was dancing on its own—I was worried it might fall over.
post-image
XRP-5.09%
ADA-4.54%
Bitcoin’s Long-Term Scenario Is Getting Interesting
River estimates that Bitcoin could potentially reach $250K–$840K within 3–5 years if 20%–40% of global portfolios allocate just 2%–4% to BTC.
Under that scenario, Bitcoin could see as much as $5.3 trillion in potential inflows.
The key isn’t just Bitcoin adoption by individuals anymore — it’s what happens if institutional and global portfolio allocation keeps increasing.
Even a small allocation from a huge global capital base could have a massive impact on $BTC . ₿
#Bitcoin #BTC #Crypto
post-image
BTC-1.95%
  • 6
  • 2
$BTC Signal】Long + order-book support and 1H short contraction
$BTC The order-book bid depth ratio is 3.85, with very thick buy orders below; 1H short momentum is weakening, and the price has rebounded from 78618 to 79548. The 1H MACD bearish bars are contracting, while the 4H MACD bullish structure remains intact, with the bars narrowing. Trading volume shrank from 94628 to 12502, indicating selling pressure has been exhausted. RSI 1H is 44.69, neutral to weak but not out of control.
🎯Direction: Long
⚡Entry/limit orders: 79309.855 - 79548.500 (directly target an entry near the current price
post-image
BTC-1.97%
$TAC Signal】Long | 4H MACD expansion + pullback confirmation
$TAC 1H pullback touched the area around EMA20/50 and stabilized, currently quoted at 0.002735. The 4H MACD histogram at 0.0001 continues expanding, while the 1H RSI is flattening at a high level at 65.98. The latest 1H candlestick surged to 0.002958 before retreating, with the buy-side ratio at 0.41 and concentrated selling pressure above. The order book buy/sell depth is 0.58, with sellers slightly stronger, but the low of 0.002676 has formed support. The funding rate is 0.0050%, OI is stable, and long leverage remains under contr
post-image
TAC+17.46%
BTC-1.95%
ETH-2.13%
SOL-3.29%
Layout for Bitcoin, Ethereum, and Dogecoin
live-cover
LIVE1,697
this is what you need to do @frankdegods
what is dead may never die
post-image
Many people who fish always like to crowd into the busiest fishing spots, unaware that the big fish often hide in corners no one visits. Not long ago, $SPCX was like a fish lurking in deep water, circling back and forth within a range every day, wearing down so many anglers that they packed up and left to chase the market’s hot coins instead.
During this period of sideways trading, changes were quietly taking place beneath the surface. Selling pressure gradually subsided, while many smart-money players had already quietly cast their lines and laid in wait, and interest in the sector also bega
post-image
SPCX-1.01%
BTC-1.97%
ETH-2.14%
Load More

Join 40 M users in our growing community

⚡️ Join 40 M users in the crypto craze discussion

💬 Engage with your favorite top creators

👍 See what interests you

View More