Share your thoughts
placeholder
Article
$PONS is now up 375x from its lows just 1.5 months ago.
it ran from a 250k mcap to nearly hitting unicorn status today.
it was fairly distributed and available onchain from the start. everyone had the exact same chance, and more than enough time to add it to their portfolios.
thanks to bear market ptsd, most people stayed completely sidelined (myself included). and even most of those who caught it early sold way too soon, locking in solid profit but still missing a generational run.
it took a runner like this for people to wake up and start believing in something again. the bear market is over
post-image
PONS+20.19%
As a 185 cm-tall northerner
Serving me this noodle dish is a bit insulting to me
post-image
  • 1
  • 1
#Web3SecurityGuide
Depositing and withdrawing funds is the point where most users meet real-world risk controls. The questions that keep coming up are practical: what can go wrong, how people accidentally trigger reviews, and what is the safer way to move capital when the system flags something.
The first layer of risk sits on the banking side. Cards and bank accounts can be frozen when the flow of funds looks unusual to the bank’s monitoring systems. Large or frequent transfers, sudden changes in pattern, or transactions linked to higher-risk categories can all prompt a temporary hold. When
  • 2
#USAugustNFPBeatsExpectations
The U.S. August Non-Farm Payrolls report is out, and it delivered a clear beat.
Key Numbers:
- Nonfarm payrolls: **+162,000**
- Consensus expectation: ~55,000–65,000
- Unemployment rate: Held steady at **4.1%**
- Private sector jobs: **+127,000**
- Average hourly earnings: **+0.3%** month-over-month to $37.75 (YoY +3.1%)
This marks the strongest monthly job gain since March and comes in roughly three times higher than economists had forecast. Prior months were also revised higher July was lifted from an initial -23,000 to +21,000, and June was revised upward as w
post-image
#SKHynix
SK hynix remains one of the strongest names in the global AI-memory and semiconductor story, and at the current price of 1,285, the stock still has an interesting risk-to-reward setup if the broader technology and semiconductor trend remains supportive. The company is not simply benefiting from a temporary increase in chip demand; it is positioned directly inside the structural expansion of AI data centers, high-bandwidth memory, advanced DRAM and next-generation HBM4.
The fundamental picture is particularly impressive. SK hynix reported record Q2 2026 revenue of 79.3187 trillion won
SK Hynix+3.19%
MU+5.89%
  • 1
  • 1
I originally just wanted to freeload on breakfast, but the market ended up feeding me for half a year.
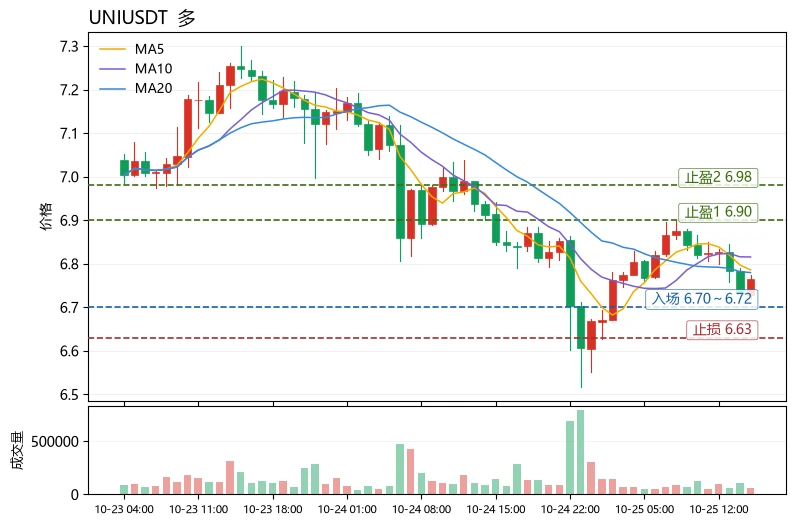
During the intraday bottoming process, $UNI moved sideways around 4.828 for so long I nearly dozed off, but it was clear that someone was supporting it below, and the price couldn’t be pushed down on declining volume. I judged that the bottom was solid, so I went long directly without hesitation.
I just checked the market, and the price has already climbed to 7.056, +3276.74%. This profit feels great; those already aboard should have all woken up laughing.
Take 80% off the table first, and m
post-image
UNI+11.63%
XRP+0.99%
BNB+2.40%
$$EPIC 15 minutes ago it was still sitting at 0.3657, and now it has shot straight up to 0.4440, with $21 million in 24-hour trading volume—this is no longer a rise; someone is grabbing tokens by the sack. If you didn't get in earlier, the risk of chasing higher and the anxiety of missing out are now fifty-fifty. Weigh it yourself.
Let's start with the projection: 0.4783 is today's high and also the resistance level. If this is a launch after a shakeout, a pullback that holds above 0.42 would be the best entry for the next leg; but if volume contracts and it breaks below 0.40, the trapped hold
EPIC+21.30%
Wide awake!
Where are my morning GMs at? ☀️
post-image
#USELESSSurgesAnother67%
USELESS is currently trading near 0.25 after another sharp upward move that registered approximately 67 percent gains in a recent 24-hour window.
The token, a Solana-based meme coin, has shown repeated strength over the past week. Market data places the current price in the 0.248 to 0.252 range, with a market capitalization around 249 to 252 million dollars. Twenty-four-hour trading volume has remained elevated, frequently exceeding 140 to 150 million dollars on spot markets and significantly higher when futures volume is included. This level of activity indicates gen
post-image
Falcon_Official
#USELESSSurgesAnother67%
$USELESS
MOMENTUM IS STILL RUNNING
USELESS has once again become one of the most aggressive momentum stories in the market. After its explosive multi-day rally, the token is now trading around $0.22, following a powerful move that previously pushed price toward the $0.25–$0.28 region. The latest market data shows just how extreme the move has become: USELESS has gained roughly 250%+ over seven days, while 24-hour trading volume has expanded above $200M.
THE BIGGER PICTURE
What makes this setup interesting is that USELESS is not simply experiencing a one-candle pump. The rally has developed across several sessions, with price moving from roughly $0.06–$0.07 at the beginning of the recent acceleration toward the $0.20+ area. Recent daily data shows gains of approximately 31.8% on Aug. 31, 24.8% on Sept. 1, 9.7% on Sept. 2, and 68.1% on Sept. 3, followed by another strong session on Sept. 4.
$0.22 IS THE NEW BATTLEFIELD
At the current $0.22 area, the chart is entering a completely different phase. Buyers have already demonstrated extraordinary strength, but the question now is whether they can maintain that momentum after such a rapid expansion.
The first level I would watch is $0.25. This remains the major psychological barrier because it represents a clean round number and sits close to the recent high zone. A strong daily close above $0.25, supported by sustained volume, would strengthen the continuation setup.
UPSIDE LEVELS
If USELESS successfully reclaims and holds $0.25, the next area to watch would be approximately $0.258–$0.26. A clean break there could put $0.30 back into focus.
Above $0.30, the $0.31–$0.312 region becomes an important technical target. From $0.22, a move to $0.25 would represent roughly 13.6%, while $0.30 would require about 36.4% upside. Reaching $0.312 would mean approximately 41.8% from the current level.
BUT THE CHART IS EXTREMELY HOT
This is where traders need to separate trend strength from risk. USELESS has already moved several hundred percent in a very short period, and current market activity confirms that speculation is intense.
The latest 24-hour range has been extremely wide, with market data showing price moving between roughly $0.18 and $0.28. That means double-digit percentage swings can happen quickly, even without a major fundamental change.
After such a vertical rally, chasing every green candle becomes increasingly dangerous. A strong asset can continue higher, but the probability of sharp profit-taking also increases as early buyers lock in gains.
THE SUPPORT MAP HAS CHANGED
For me, the most important question is whether previous breakout areas can become support.
The first zone is $0.21–$0.20. Holding this region after the recent acceleration would be constructive because it would show that buyers are defending the new higher price structure.
Below that, I would watch $0.18–$0.176. This area becomes much more important if the current momentum starts cooling. A controlled retracement into this region would not automatically destroy the larger rally.
The next deeper zone is around $0.15. Losing that level with heavy volume would suggest that the market is moving from healthy consolidation into a much deeper correction.
VOLUME TELLS THE STORY
The volume expansion is one of the strongest parts of the current setup. Current market data places USELESS around $220M+ in 24-hour trading volume, showing that this rally is happening alongside substantial market participation rather than disappearing liquidity.
But volume needs to be interpreted together with price. If buyers continue producing higher highs while volume remains elevated, momentum can continue. If price repeatedly fails near $0.25–$0.26 while selling volume increases, that would be a very different signal.
THE OVERBOUGHT PROBLEM
Momentum indicators are another reason I would avoid blindly chasing the current move. Previous technical readings already showed RSI entering an extremely overbought area, while MACD and moving averages remained strongly bullish.
That combination tells an important story: the trend is strong, but the entry risk is also rising.
An overbought RSI does not automatically mean price must crash. In powerful momentum markets, RSI can remain elevated for longer than expected. The better signal is whether price starts losing support while momentum indicators roll over.
BULLISH SCENARIO
My bullish scenario is simple: USELESS holds $0.20–$0.21, buyers return with strong volume, and price reclaims $0.25 decisively.
If that happens, $0.26 becomes the first confirmation zone, followed by $0.30 and potentially $0.31–$0.312.
The key is not simply touching $0.25. I want to see acceptance above it rather than another temporary wick followed by immediate rejection.
BEARISH SCENARIO
The risk scenario starts if USELESS repeatedly fails around $0.25 and then loses $0.20 with strong selling pressure.
That could trigger a cooling phase toward $0.18, followed by the $0.15 area if sellers remain aggressive. Such a pullback would not necessarily erase the entire multi-week rally, but it would indicate that the parabolic phase is losing momentum.
MY CURRENT VIEW
At approximately $0.22, USELESS remains one of the strongest momentum charts to watch, but the setup has changed significantly from the beginning of the rally.
The data shows extraordinary seven-day performance, huge trading activity and a market that has already demonstrated its ability to move tens of percent in a single session.
For me, the three levels are clear:
$0.25 — breakout confirmation
$0.20–$0.21 — immediate support
$0.176–$0.18 — deeper trend support
Above $0.25 with strong volume, $0.26 → $0.30 → $0.31+ becomes the upside roadmap.
Below $0.20, I would become much more cautious and wait for the market to establish a new base.
USELESS is still bullish from a momentum perspective, but after a 250%+ seven-day rally, the biggest opportunity may no longer be predicting whether the next candle is green. The real test is whether buyers can convert the explosive move into a sustainable higher-price structure.
If $0.25 breaks and holds, $0.30 comes back into play. If $0.20 breaks, the market may need a serious cooldown first.
@Gate_Square
repost-content-media
USELESS+2.34%
  • 1
$1000 to $100,000 Crypto Trade Challenge Today
live-cover
LIVE1,412
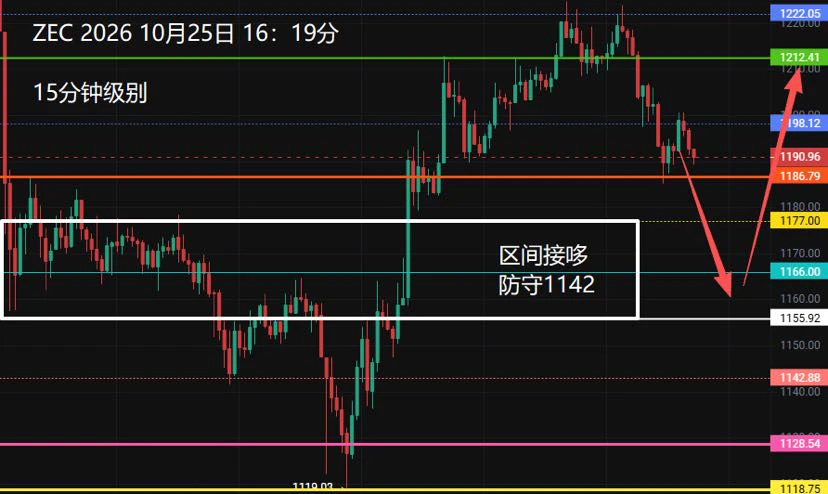
This $ZEC long has been going quite smoothly, with the price pushing higher all the way and getting closer and closer to my initial target. Instead of closing everything at once, I first took partial profits as planned, reducing the position to a size I can comfortably hold. I placed protective levels for the remaining orders and will let the market play out.
+2938.8% unrealized profit is in hand, and it would be a lie to say I feel no emotional fluctuations. But I know where the core logic of this trade lies. As long as that level is not breached on a closing basis, I do not plan to interfere
post-image
ZEC+15.55%
SNDK+1.39%
LAB-3.77%
i am now one of 12 people in the world with a s&box hard hat.
post-image
【$B Signal】Long + 1H recovery/funding rate stable
$B 1H RSI 62, price is running below the upper Bollinger Band at 0.1834, with the 1H structure intact. The 4H MACD histogram is narrowing, and bullish momentum is exhausted. Order book buy/sell volume is 0.87, with aggressive selling pressure dominant; funding rate is 0.0312%, with no excessive leverage. Risk-reward is approximately 1.5; position size should follow the short-term plan, with no increase.
🎯Direction: Long
⚡Entry/limit order: 0.180856 - 0.181400
🛑Stop loss: 0.179586
🚀Target 1: 0.184121
🚀Target 2: 0.185482
🛡️Trade management:
post-image
BTC+0.13%
ETH+1.60%
SOL+2.73%
I think BTC has more or less topped out this cycle, reaching as high as $86,000 before another deep correction.
post-image
BTC+0.11%
Most traders will ignore ONDO at 0.375—that’s exactly why they’ll miss the 5% pump.

$ONDO /USDT - LONG

Trade Plan:
Entry: 0.374 – 0.376
SL: 0.365
TP1: 0.382
TP2: 0.387
TP3: 0.394

Why this setup?
- 4h bias is LONG with 95% confidence—rare conviction level.
- Daily trend is bullish; entry zone 0.374–0.376 aligns with 1h support.
- RSI (15m) at 54.73 shows room to run before overbought—TP1 at 0.382 is the first magnet.
- Why now? The 0.375 level is a springboard, not a ceiling.

Debate:
Are you fading this 95% confidence LONG or stacking before TP2 at 0.387?

⚠️ Personal market anal
ONDO+1.44%
Everyone’s staring at 0.0913 while the 4H quietly flips—did you miss the trapdoor under DOGE?

$DOGE /USDT - SHORT

Trade Plan:
Entry: 0.0910 – 0.0916
SL: 0.0941
TP1: 0.0892
TP2: 0.0878
TP3: 0.0856

Why this setup?
- 1D trend is *range*, not breakout—so this isn’t a chase; it’s a fade.
- RSI 15m at 55.69 shows weak bounce fuel—no momentum to push through 0.0916 resistance.
- ATR 1h (0.001183) is tight, but our short targets stack: TP1 0.0892, TP2 0.0878, TP3 0.0856.
- Why now? Entry zone 0.0910–0.0916 is the exact rejection spot. If 0.0941 stops us, we’re wrong—but confidence 55 says
DOGE+6.23%
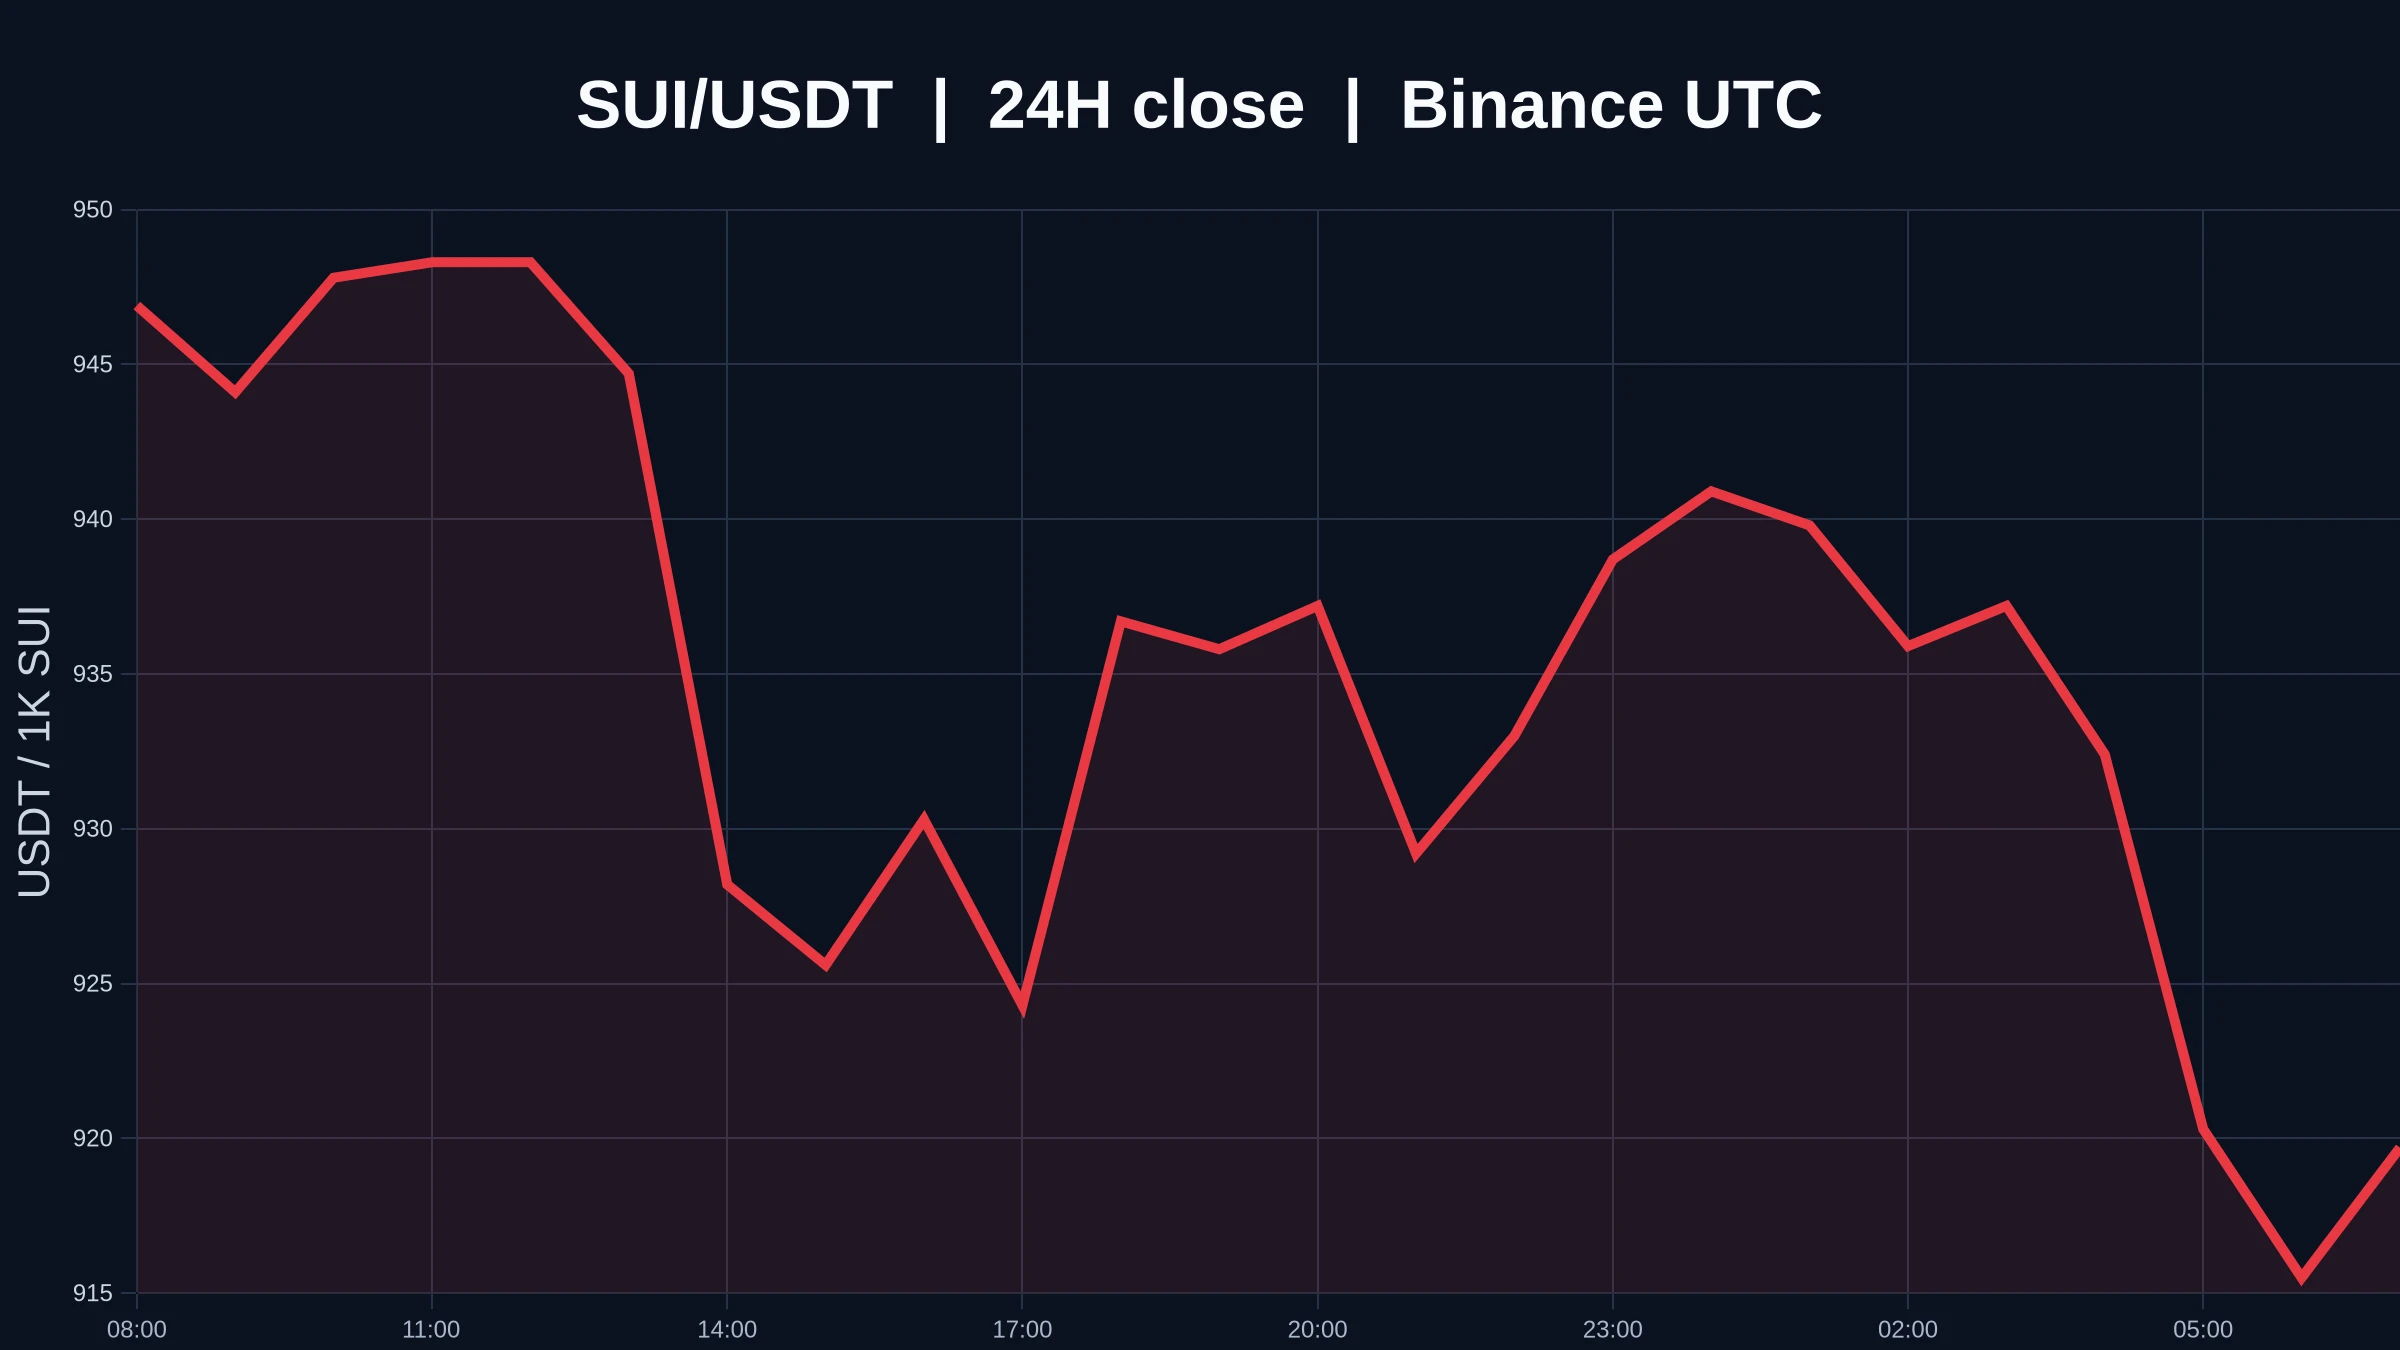
Why $SUI /USDT’s “safe” range is the most dangerous place to be right now.

$SUI /USDT - SHORT

Trade Plan:
Entry: 0.7883 – 0.7931
SL: 0.8140
TP1: 0.7733
TP2: 0.7616
TP3: 0.7442

Why this setup?
- 1D trend is *range*, but 4h bias flips SHORT—that’s a classic bull trap setup.
- RSI 15m at 38.64: momentum already cracked, but price hasn’t followed yet (lag = your edge).
- Entry ref 0.7907 with TP1 at 0.7733 = 2.2% move, but ATR 1h is only 0.0097—tight stops mean most longs get shaken before the drop.
- “Why now?” Because 0.7931 (entry_high) is the last wall before the slide; if we lose
post-image
SUI+0.49%
$ZEC 15 minutes ago, it was still hovering around $1,000, and now it’s at $1,171. A 15.56% daily gain has left the shorts battered. Don’t ask what this has to do with BTC—BTC is moving sideways in a straight line around $97,000, while ZEC is making an independent move. $2 billion in trading volume was thrown at it; this kind of volume isn’t something retail traders can generate.
Do you think this is a coincidence? The privacy coin sector has been repeatedly tested recently. As a veteran leader, ZEC spent two years trading sideways and flushed out 90% of the speculators, so the chips have long
ZEC+15.63%
BTC+0.11%
MARKET UPDATE SOL
live-cover
LIVE1,080
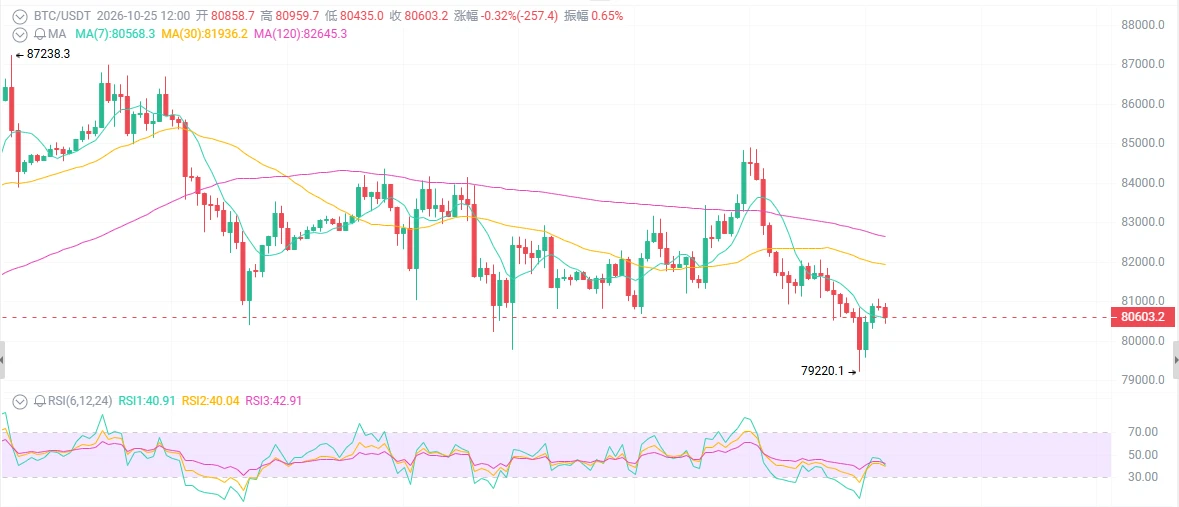
#BTCReclaims80K 🚀 Bitcoin Reclaims $80,000! 🔥
BTC is back above the $80K level, putting the spotlight back on the bulls. 📈
After recent volatility, this move could be an important signal for market sentiment. The big question now is: Can Bitcoin hold above $80K and build the next leg higher? 👀
Key levels to watch:
💰 $80K — critical psychological level
📈 Above $80K — bullish momentum could strengthen
⚠️ Below $80K — volatility may return
Are we heading toward another major BTC breakout? 🚀
👇 Bullish or bearish from here?
#BTCReclaims80K #Bitcoin #BTC #Crypto
post-image
BTC+0.11%
Load More

Join 40 M users in our growing community

⚡️ Join 40 M users in the crypto craze discussion

💬 Engage with your favorite top creators

👍 See what interests you

View More