
Square
Following
Hot
News
Profile
Share your thoughts
placeholder
Article
We’ll have to leave it at that for now. No idea when we’ll be able to break even.
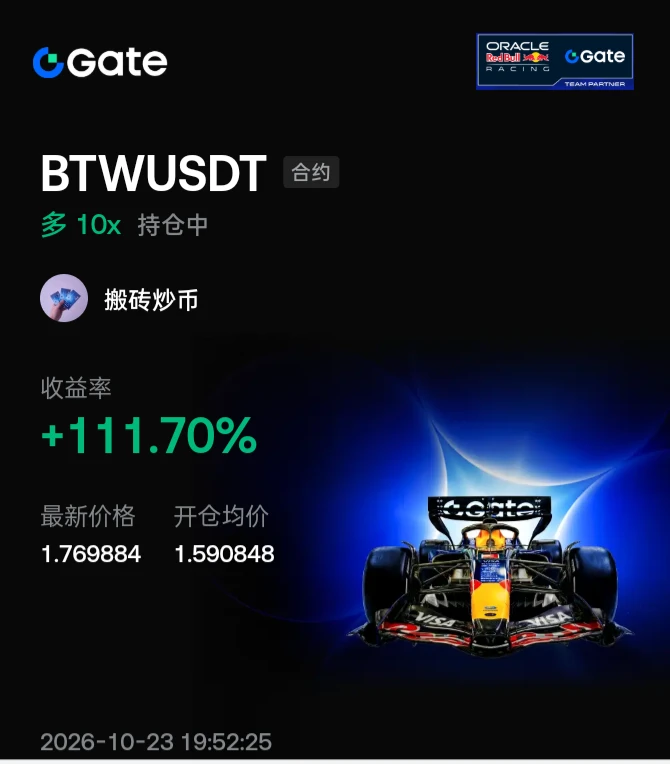
$BTW Holding long positions is such a rush
post-image
BTW+3.26%
  • 3
Trenches
Kimchi
K
bade
b
Kimchi
CSoc...pump
Market Cap
$.
Change
.
24h Vol
$.
Holders
.
CNPY
C
bade
b
CNPY
0xc6...ddd2
Market Cap
$.
Change
.
24h Vol
$.
Holders
.
kimchi
k
bade
b
kimchi
B1Y2...pump
Market Cap
$.
Change
.
24h Vol
$.
Holders
.
ZIG
Z
bade
b
ZIG
0x8c...1145
Market Cap
$.
Change
.
24h Vol
$.
Holders
.
AGT
A
bade
b
AGT
0x5d...e274
Market Cap
$.
Change
.
24h Vol
$.
Holders
.
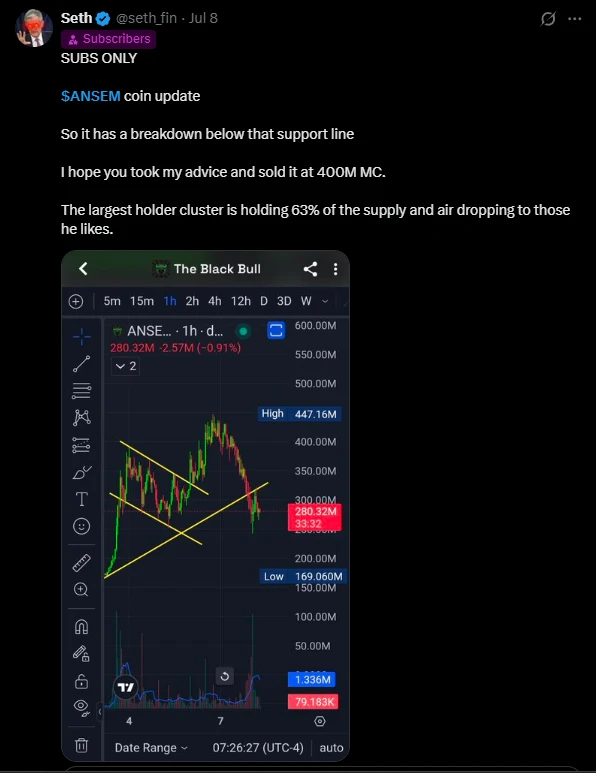
I warned you about ANSEM at the top. Its now trading at $78M MC going to zero.
If you buy their next coin, you deserve to be poor.
post-image
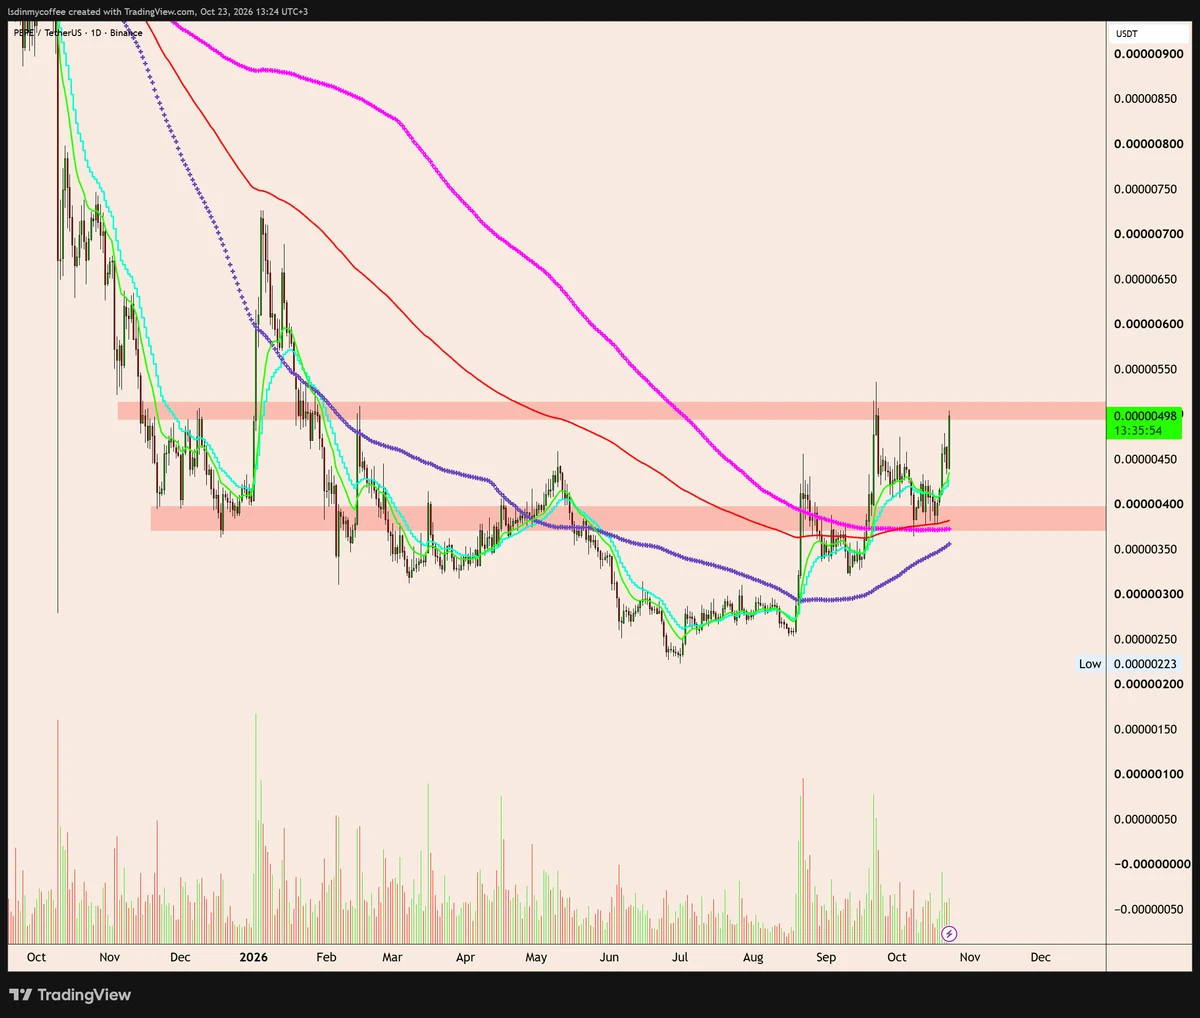
$PEPE
kinda weird to see a lone runner in memes... at resistance to me here
but adding it to the watchlist to see the next consolidation
post-image
PEPE+12.24%
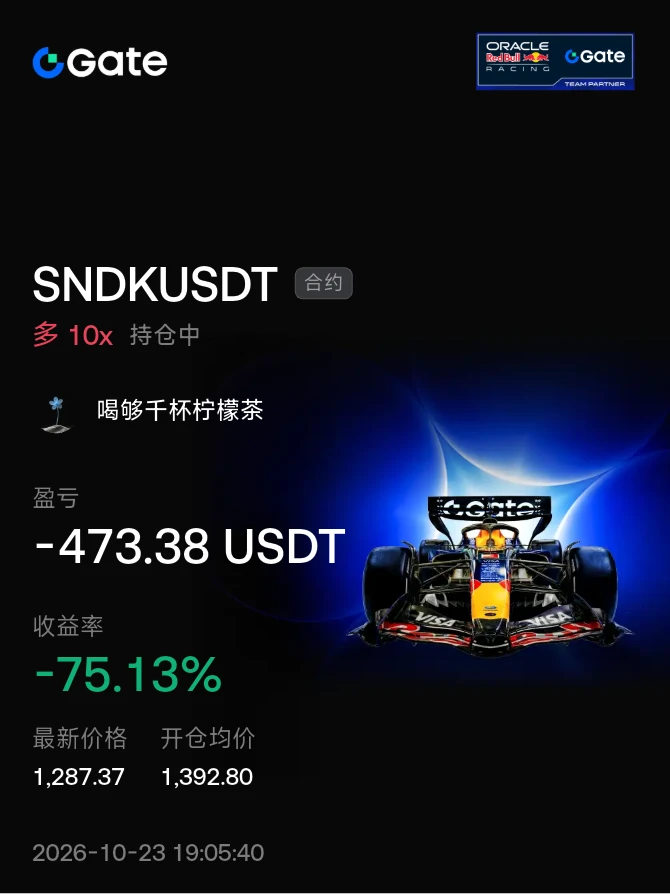
Why panic? In this market, it’s all about mindset and position management. Hold on patiently. Wait!
post-image
$BTW Sun gets the meat, I get the soup. That's just how it is.🤣
post-image
BTW+3.26%
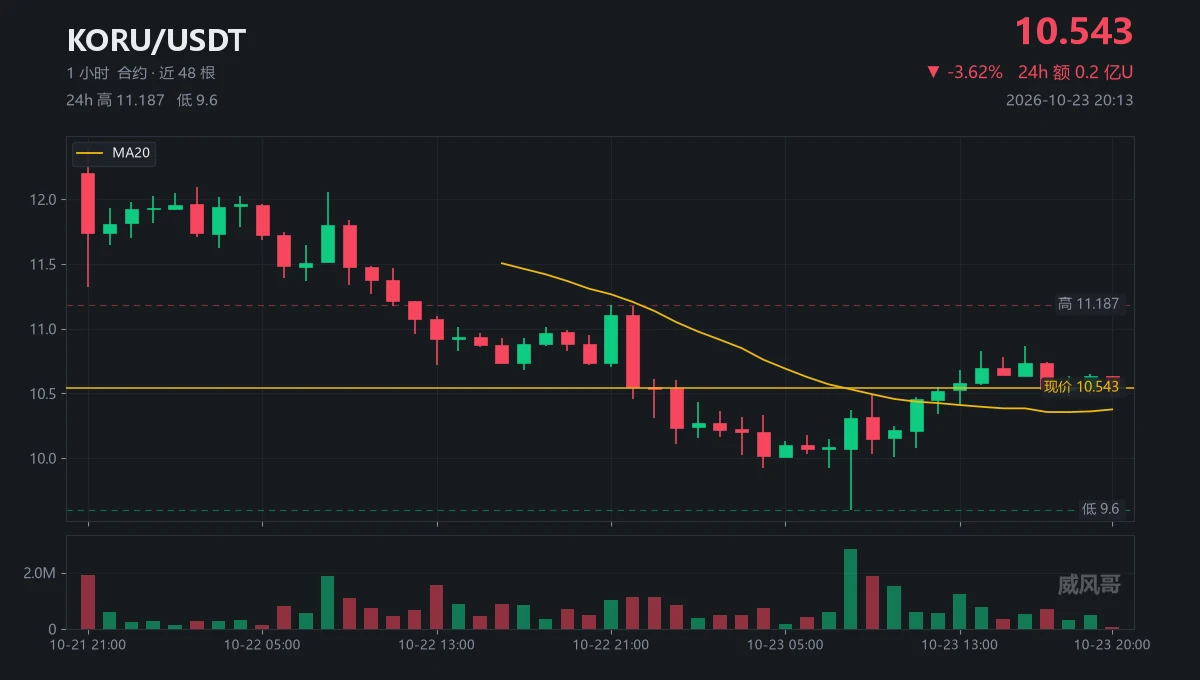
I just went through the order book for $KORU from start to finish; the three phases are very clean.
At the 10-21 21:00 open, it was slammed straight from 12.405 to 11.324, on 2.58x volume;
that candle shook out everyone who had chased the price.
The fiercest move came today at 08:00: one candle plunged to 9.6, on 3.77x volume, with a 4.89% lower wick;
the sellers were those who couldn’t hold on and hit their stops; the buyers were the ones brave enough to place orders in the bloodbath.
The current price is 10.543, up 9.8% from 9.6;
the decline was 22.6%, and the rebound recovered at most 45%
post-image
KORU-3.51%
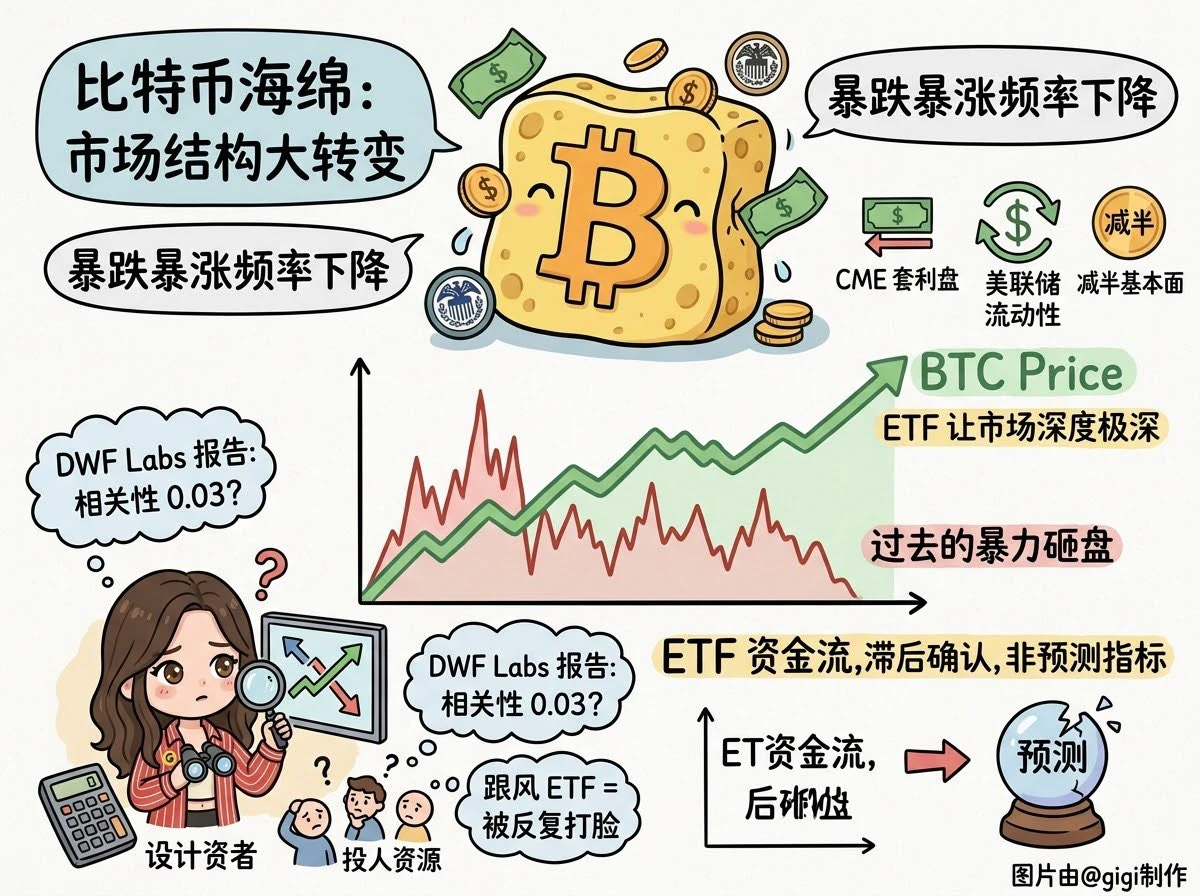
Do you also often trade by watching daily ETF inflows and outflows, only to keep buying at the top and selling at the bottom?
DWF Labs @DWFLabs’s latest report exposes the market’s biggest illusion: ETF fund flows have a correlation of just 0.03 with future price movements. They can’t predict the market at all; they’re merely lagging data driven by retail investors chasing rallies and sell-offs, and arbitrage positions closing.
A fundamental shift in market structure: although hundreds of billions of dollars flow in and out, the frequency and severity of Bitcoin’s crashes are both clearly decl
post-image
BTC-3.69%
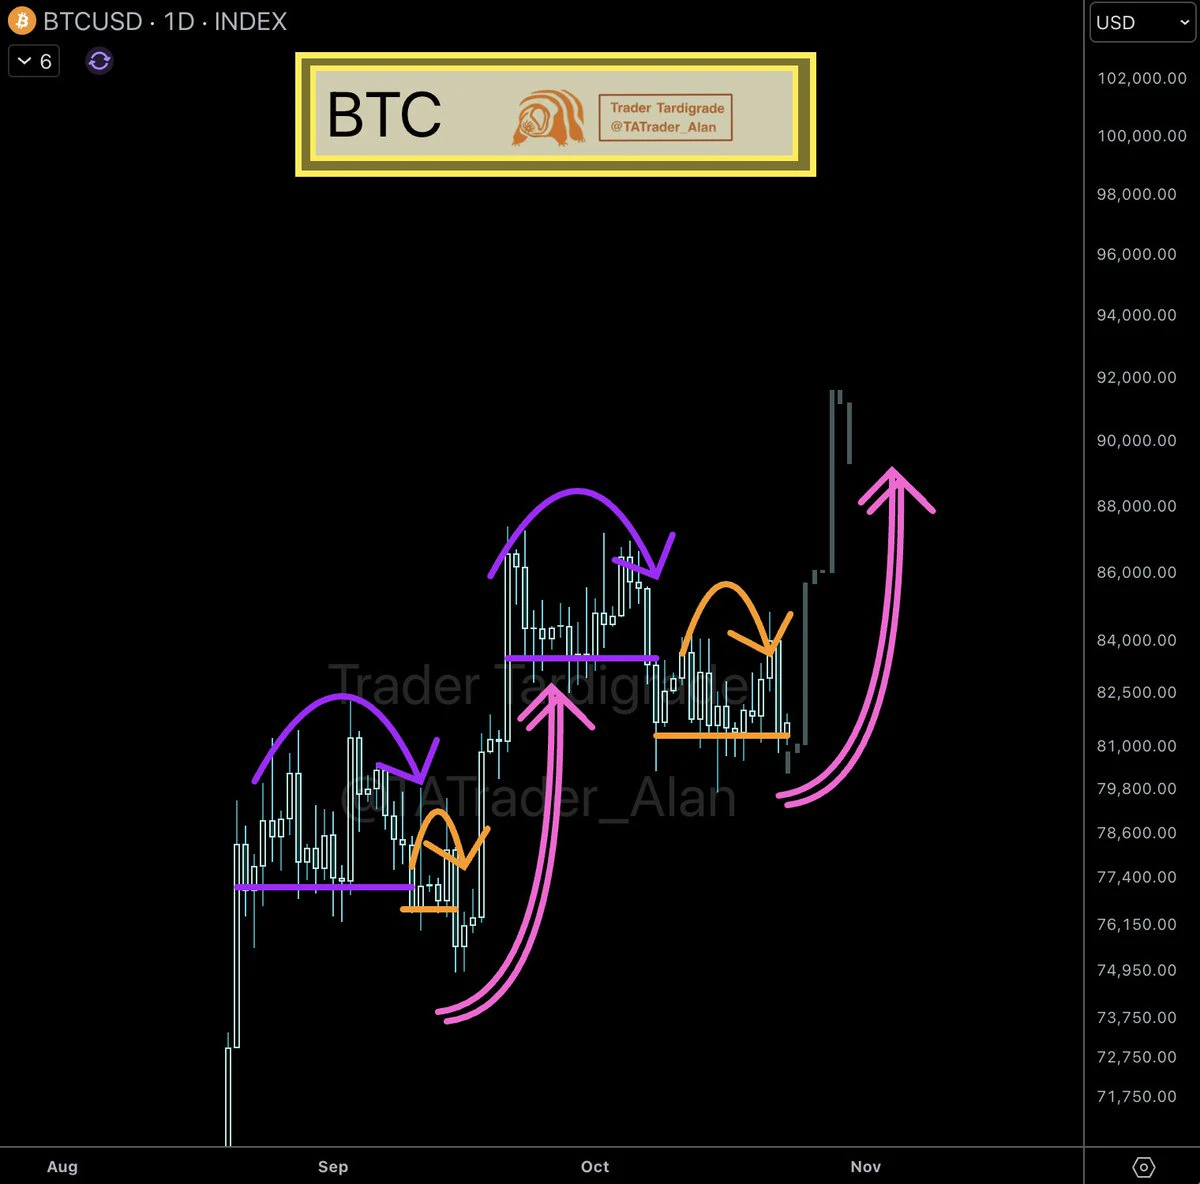
$BTC /daily 🔥
Bitcoin keeps repeating the same rhythm.
❇️ Range forms, price rolls over and sweeps the floor
❇️ A smaller range builds right below, then another dip into support
❇️ Reversal, and a sharp leg up follows
This structure has played out twice already. Price just swept the lows again.
✍️ We may need an immediate leg up before we see a recent high.
Are you watching this fractal? 👇
post-image
BTC-0.34%
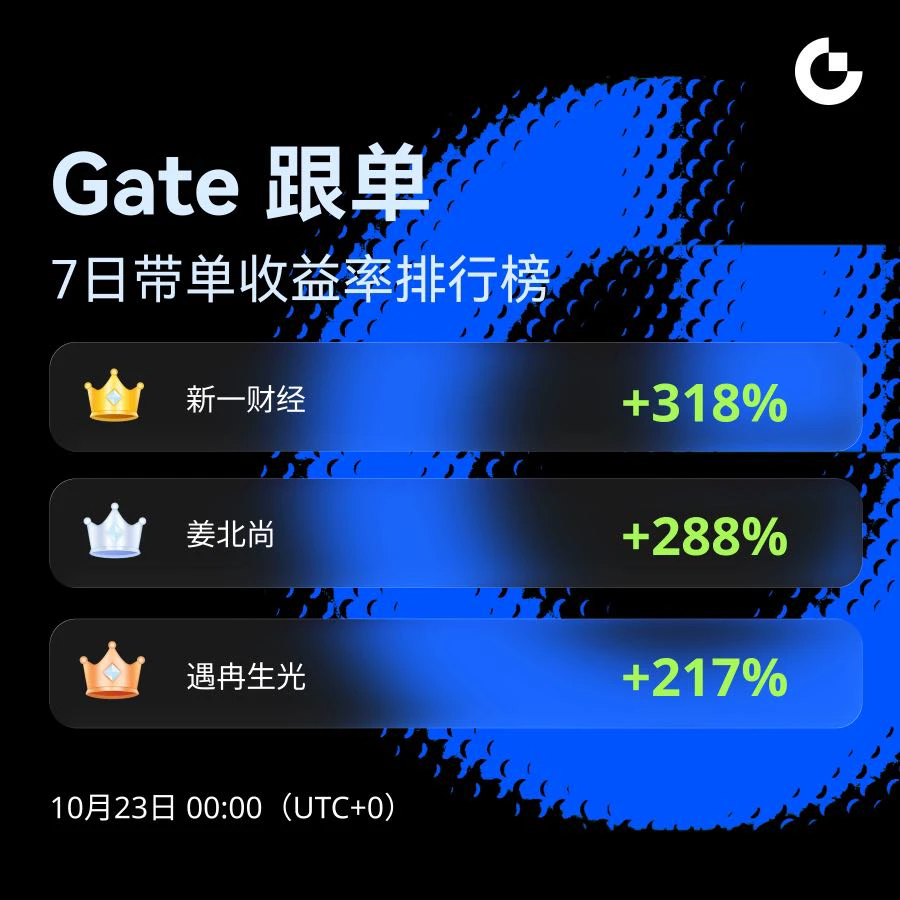
📈 See the real returns of top traders!
Top Traders' 7-Day Returns Leaderboard
🥇 Xin Yi Finance: +318%
🥈 Jiang Beishang: +288%
🥉 Yu Ran Sheng Guang: +217%
Instead of blindly feeling your way forward, copy success directly. Copy trading with one tap—let your returns run!
🔗 Follow now: https://www.gate.com/copytrading
#跟单 #交易高手 #被动收益
CopyTrading
📈 See the real returns of top traders!
Top Traders' 7-Day Returns Leaderboard
🥇 Xin Yi Finance: +318%
🥈 Jiang Beishang: +288%
🥉 Yu Ran Sheng Guang: +217%
Instead of blindly feeling your way forward, copy success directly. Copy trading with one tap—let your returns run!
🔗 Follow now: https://www.gate.com/copytrading
#跟单 #交易高手 #被动收益
repost-content-media
  • 2
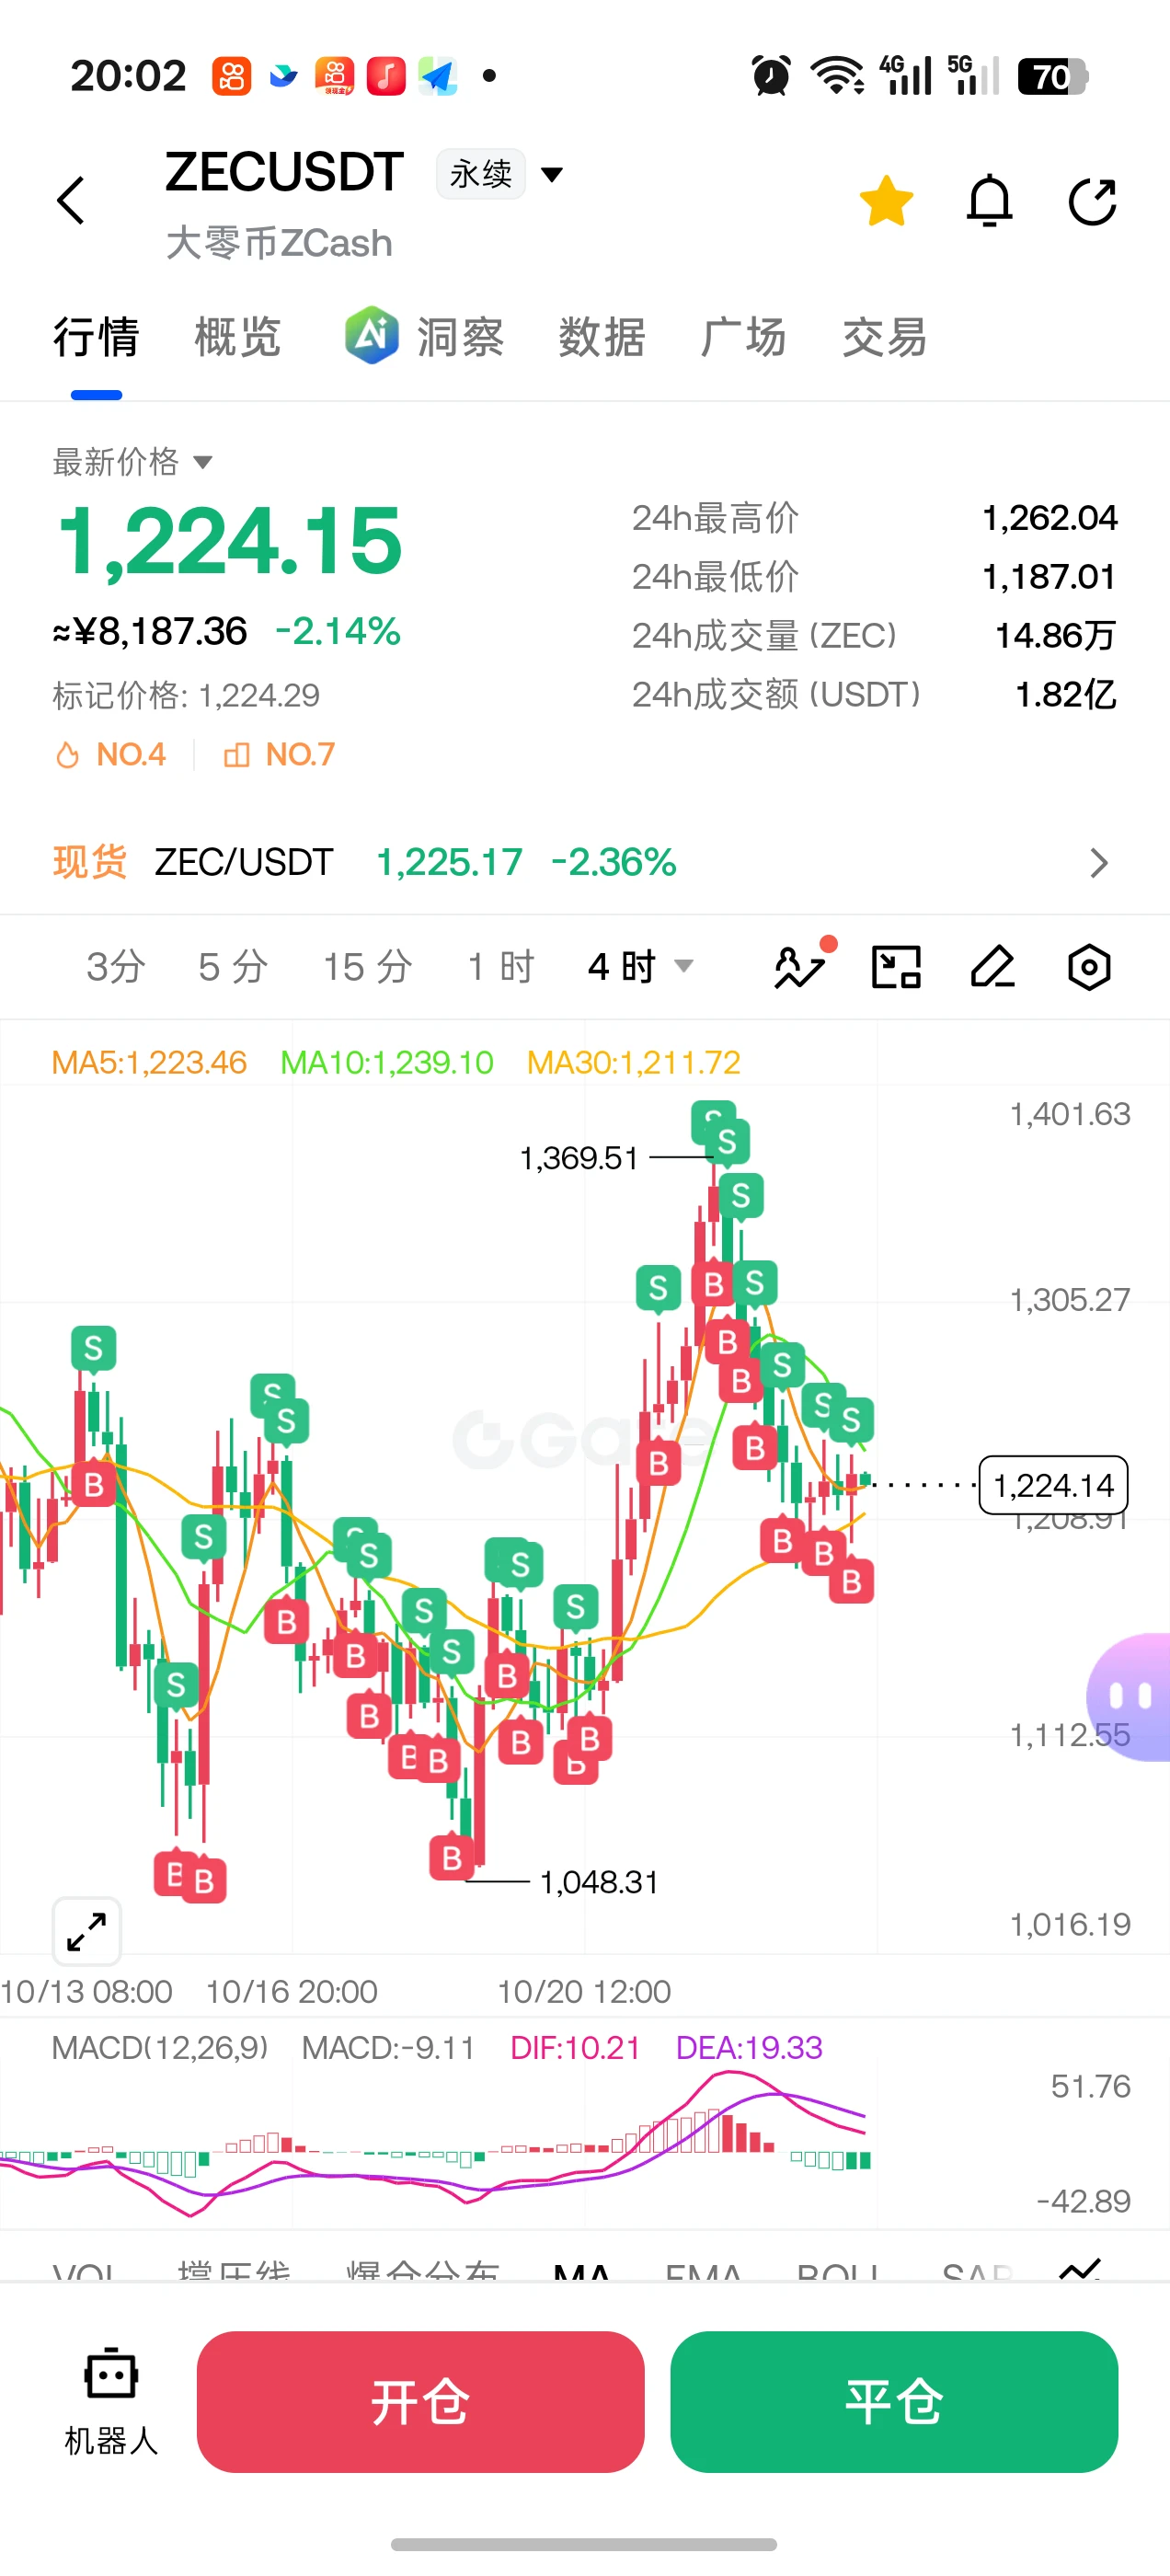
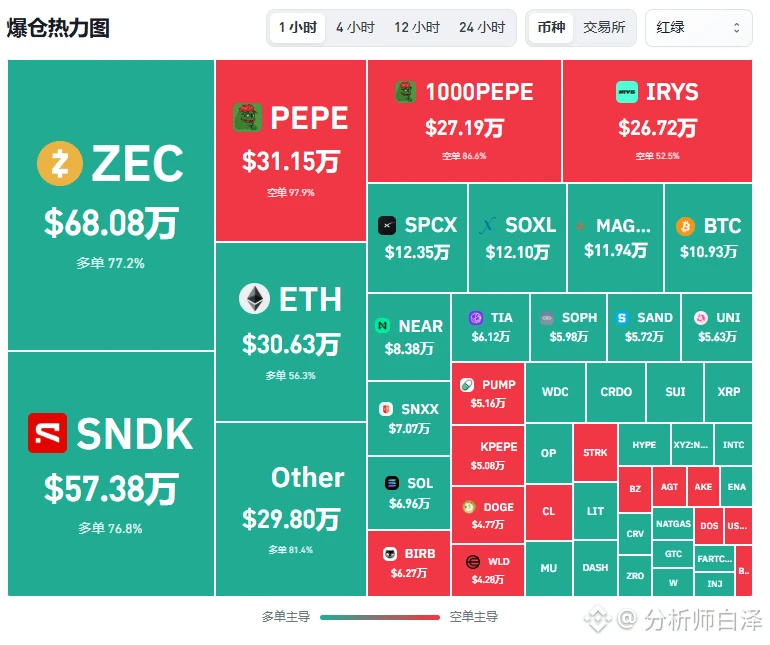
Whales have laid an inescapable trap! $ZEC If the longs don’t run now, they won’t have a bone left!
The most expensive illusion in a bull market is mistaking the bait dangled by the big players for your own ATM.
Their intent is crystal clear: to liquidate longs, not shorts. The capital flow chart shows major players’ net outflows topping 17 million U in one hour, with short-term funds scrambling to exit. Look at the liquidation map: the $1,266–$1,300 range above is packed with short liquidation zones—bait that the big players can trigger with a small amount of capital and a fake rally. Most d
post-image
ZEC-2.55%
AI Stocks Plunge in Unison, While BTC Holds Firm at $81k! Global Risk Aversion Rises—Ca
live-cover
LIVE4,284
Guys, look at the shorting opportunity in $BTC
... Once again, $BTC is about to crash... All traders are watching this sharp pullback... Soon, $BTC will hit $81,000 on its downward move...
post-image
BTC-0.39%
[New Streamer] Market Prediction
live-cover
LIVE2,052
K-line charts, Bollinger Bands (BOLL), and trendline analysis across the 4-hour, 1-hour, 15-minute, and 5-minute timeframes show that the current price (around 81,615 USDT) is at the end of a converging triangle formed by the upper resistance line and lower support line, with volatility narrowing sharply.
The following are suggested entry levels for two trading directions (long/short):
1. Long strategy (following support from the lower trendline)
Entry levels (buy/go long):
Aggressive entry: 81,100–81,300 USDT
Rationale: Near the 1-hour/15-minute BOLL lower bands (around 81,120 / 81,538) and s
$ZEC ‌$ETH Here's my track record—guess whether I made money or made money
post-image
ZEC-2.48%
ETH-0.26%
#USEarningsSeason
US Earnings Season: Corporate Profits, AI Growth, and Investor Confidence in Focus
The US earnings season is one of the most important periods for global financial markets because it provides investors with a clearer picture of corporate performance, business conditions, and the direction of the American economy. As publicly traded companies release their financial results, market participants examine revenue growth, earnings per share, profit margins, operating expenses, and management forecasts to determine whether current stock valuations are justified.
Earnings reports c
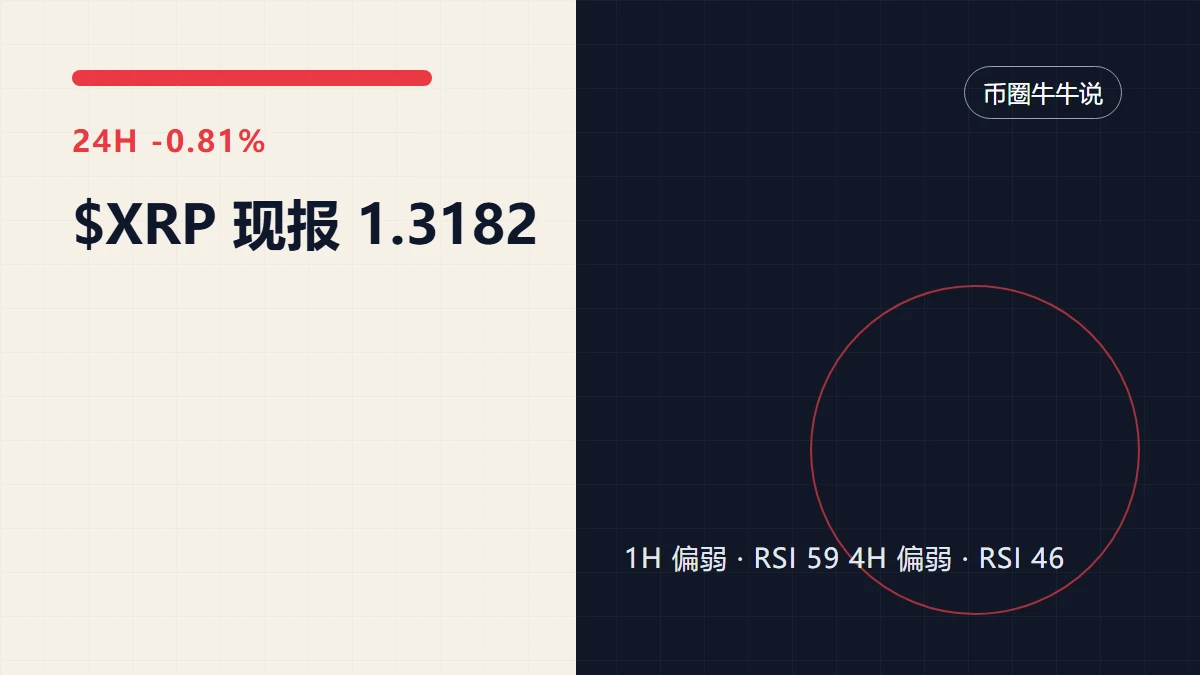
$XRP uses price-volume alignment to find opportunities; levels and exit lines are here
When I looked at $XRP this chart again, I first covered up the 24-hour -0.81%. Not because the number is unimportant, but because it is too easy to let it steal your attention. What really needs explaining right now is that $XRP has moved, but trading activity and volume have not followed. You can tentatively trust the direction, but not assume it will continue; a move with no one following through can be reversed at any time.
My view: the direction is tentatively there, but low participation discounts the
post-image
XRP-0.56%
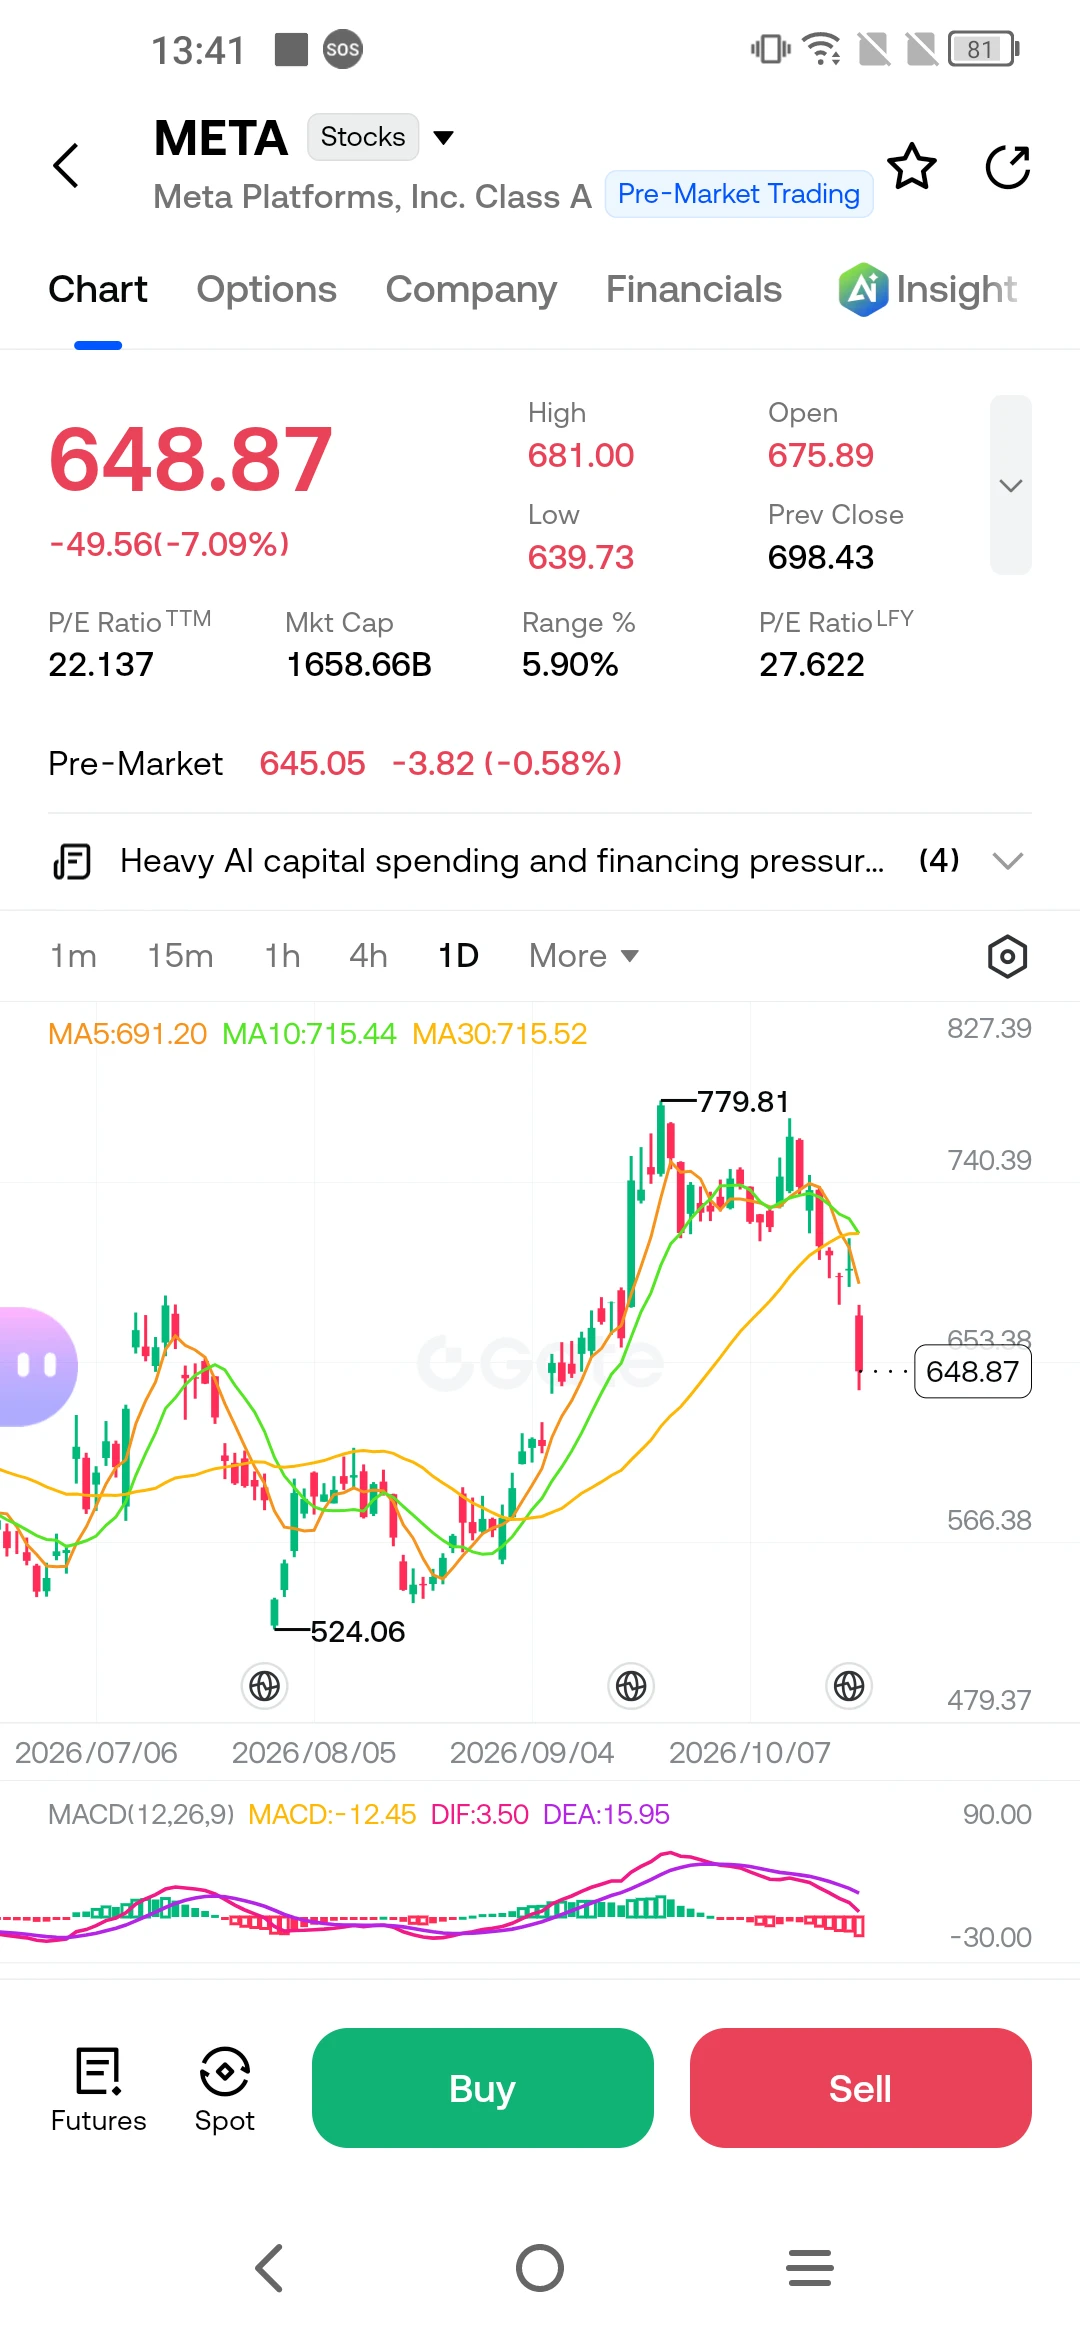
$META ‌
It is hard not to feel the whiplash of a week like this. For individual investors like us, reading a headline that says a company’s revenue grew 26% to a record $64.6 billion, only to see the stock drop 7% the very next morning, creates a genuine sense of confusion. The immediate reaction is often to question if the market is overreacting or if we are missing something fundamental about what is happening under the hood.
The reality is that this week’s move in Meta is not a story about a failing business, but a story about the immense cost of building the future. The company delivered
post-image
META-7.09%
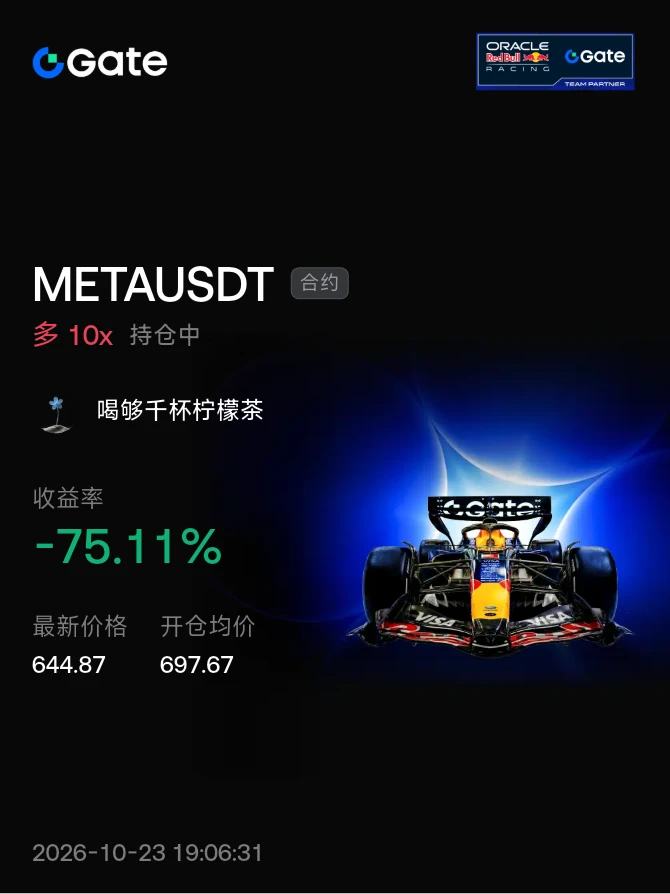
#晒出我的持仓收益
Wait, though, I opened this META position to play the earnings report. I wanted to close it when the report came out, but I fell asleep. What a shame. Still, just hold the Magnificent Seven and don't trade it.
post-image
Load More

Join 40 M users in our growing community

⚡️ Join 40 M users in the crypto craze discussion

💬 Engage with your favorite top creators

👍 See what interests you

Trending Topics

USEarningsSeason

9.49k Views2.81k Discussing

The U.S. Q3 earnings season is in full swing, with major tech companies including Tesla and Meta reporting results. Market focus is shifting beyond revenue and profit toward AI spending, capital expenditure, margins and forward guidance. Which company’s earnings are you watching most closely?

GateWCTCS9GlobalTradingCompetition

423.62k Views7.61k Discussing

BTCDropsBelow81000

72.07k Views38.04k Discussing

View More