Square
Following
Hot
News
Notifications
Profile
Share your thoughts
placeholder
Article
Short $XRP at the 4-hour resistance. 1.16 holds, next target 1.15. If it breaks above 1.17, I’ll abandon this setup. - Price 1.16, below the 4-hour EMA50 (1.24); sellers still control the trend - Stop-loss risk 0.77%, TP3 return 1.2%; if TP3 is reached, the risk/reward ratio is 1.6R Entry: 1.161–1.163 (short) Targets: 1.157 → 1.153 → 1.148 Invalidation: 1.171 Not investment advice · Do your own research
post-image
XRP-1.15%
This is probably a sad reflection of society. For a moment, I didn’t even know how to argue back😂
post-image
Trenches
ZIG
Z
bade
b
ZIG
0x8c...1145
Market Cap
$.
Change
.
24h Vol
$.
Holders
.
BTC
B
bade
b
BTC
C5xp...pump
Market Cap
$.
Change
.
24h Vol
$.
Holders
.
José
J
bade
b
José
87CQ...1UJT
Market Cap
$.
Change
.
24h Vol
$.
Holders
.
STONK
S
bade
b
STONK
6GmA...UNgx
Market Cap
$.
Change
.
24h Vol
$.
Holders
.
IDOL
I
bade
b
IDOL
0x3b...ab07
Market Cap
$.
Change
.
24h Vol
$.
Holders
.
Everybody needs to understand this.
Way too many people care about always being right.
And that is not the game you should be trying to play.
A smart investor uses the data and probabilities to formulate a thesis.
But a thesis can ALWAYS be wrong.
You can never know for sure if your ideas will be correct, but, you have to take action and therefore, take risk.
So when we do that, we want to make the decisions that the data is telling us are the most likely.
For example, right now.
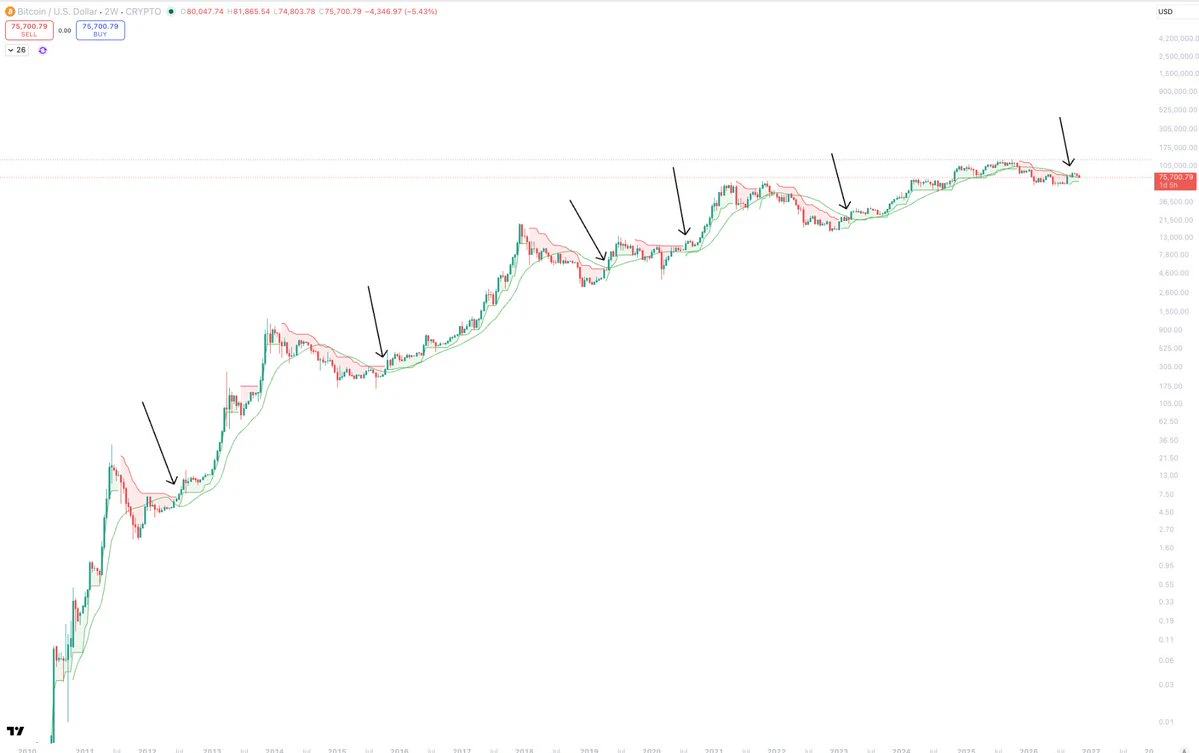
We have so many people flipping bearish or staying bearish at the end of 5 weeks of down, after bearish structure
post-image
BTC-0.67%
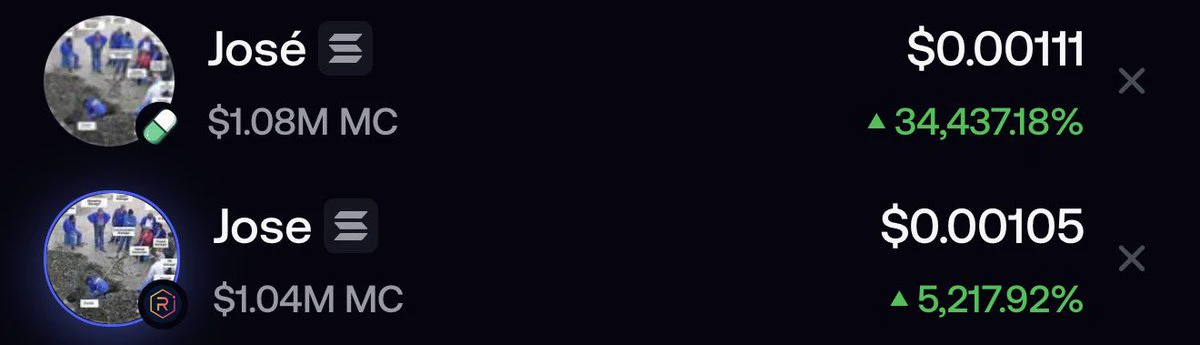
seems like there’s a new contender
post-image
$Bull Run is staging a strong bullish rebound, up more than 10% and nearing the $0.0600 resistance level! If the breakout is confirmed, the rally could extend to $0.0630. Trading plan (long): Entry: $0.0585 – $0.0593 Target levels: $0.0600 / $0.0615 / $0.0630 Stop-loss: $0.0570
post-image
牛来-1.82%
$SIGN ‌ just showed some serious volatility. Is a reversal finally brewing?

SIGN is trading near $0.00937 after briefly dipping to $0.00828 and bouncing sharply.

That long lower wick suggests buyers stepped in, but the daily trend remains bearish below the Supertrend at $0.01133.

Key levels I'm watching:

Support: $0.0090
Major support: $0.00828
Immediate resistance: $0.0106
Breakout zone: $0.0111–$0.01133

A sustained move above $0.01133 could signal a stronger recovery. Losing $0.00828 would put sellers back in control.

Interesting reaction from the lows, but bulls still have work to d
SIGN-2.90%
AMD+11.55%
NGXINDUSTR
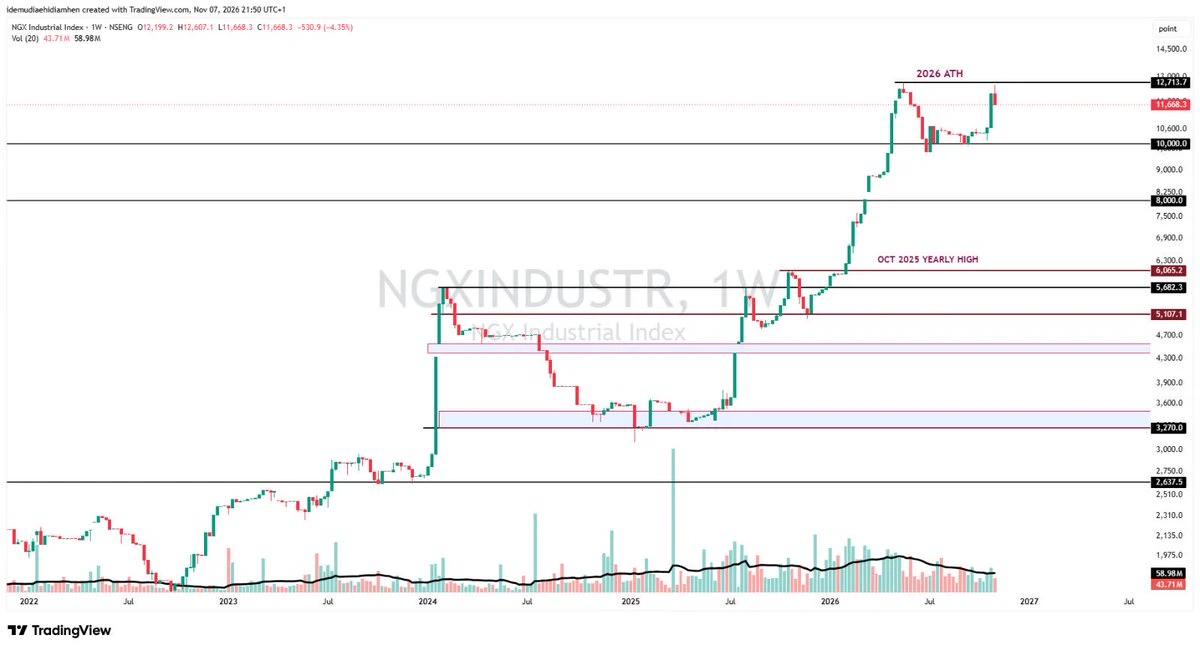
If you’ve been following Greenticker Warriors on YouTube, you’ll recall what I said three weeks ago. I expected the NGX Industrials Index to respect 10,000 points, and I said DANGCEM would be the one to drive any major run.
We nailed the call on the run. I expected the index to mint a new ATH, but we came up just 7 points shy before the market rejected that level. What we’re seeing now looks like a healthy pullback to me.
So, what do I see on the chart?
I’m still watching 10,000 points. That’s the level I want the bulls to defend, and I expect it to hold.
#NFA
post-image
INDEX+0.00%
How can this be? It hasn’t even broken below 1240.
【Kaicang Analysis】:
$ZEC On Friday evening, the price surged to 1388, then pulled back before climbing again to around 1377. The double-top pattern failed to break above the previous high. I judge this rally to have resulted from short liquidations after a surge from the bottom to 1360. Price also failed to break through the round-number resistance at 1400 overhead. Considering its correlation with the broader market, BTC failed to break even the 774 level and has already fallen below the low on the larger timeframe at 749, reaching a low of 7
ZEC+1.29%
$ARX Down 10.68% in a day, with the current price at 0.2158—just a hair above the 24-hour low of 0.2143. This isn’t a pullback; the bulls’ defenses are being tested inch by inch. Trading volume of 3.4M suggests selling pressure isn’t particularly heavy; this looks more like a slippage-driven selloff in thin liquidity. If a candle body closes below 0.2143, there’s basically a vacuum below. My approach: don’t catch a falling knife. Wait for a high-volume, 1-hour candle showing the decline has stalled near 0.2143 before considering a small long position, capped at 5%, with a stop-loss at 0.2080 (
ARX-2.47%
$IDOL I went from being down 40% to recovering my losses this time, all because I didn’t cut my losses at 0.023. Let’s get straight to the point.
Up 36.55% in 24h, currently at 0.0348. It briefly hit 0.0456 before getting dumped back down. Trading volume came in at $400 million—that’s explosive for a small-cap coin. But note that the turnover rate is already absurdly high, which means tokens are changing hands on a massive scale, not that there’s one-way accumulation.
On fundamentals, I’ve looked through IDOL’s contracts. The token’s utility is focused on ecosystem governance and node staking,
IDOL-6.71%
OpenAI CFO: Data center investments will not change due to the midterm elections.
live-cover
LIVE65
French bank resumes transfers after $133M hack, crypto loss still unconfirmed
Arkéa says attackers used its own account through a provider's platform, while a separate $108.8 million USDC trail leaves the bank-to-crypto link unproven.
Quick Take
⚠️ Personal market analysis only. NFA — manage risk and DYOR.
Educational content, not investment advice or a recommendation to buy, sell, deposit, or withdraw any asset. No paid promotion or referral/affiliate links.
post-image
USDC+0.01%
  • 1
Old Trump really does keep his word and follow through. He said he’d wipe out Iran’s whole family after the midterms, and then he actually did it.

Here we go again: a familiar weekend “limited strike” on the Strait of Hormuz.

After the strike, he said Iran was very eager to reach a deal. Iran’s Security Council replied that it wants to see concrete action from the U.S. and won’t accept promises on paper.

Now that the Democrats are in power, can they rein Old Trump in? Stop using Iran to draw candlestick charts. Leave Iran alone—and leave us alone too, okay?
More and more people are waking up. I don't know if that's a good thing or a bad thing.
What do you mean, your social security is hitting you?
I don't even know how to respond to that 🙈
post-image
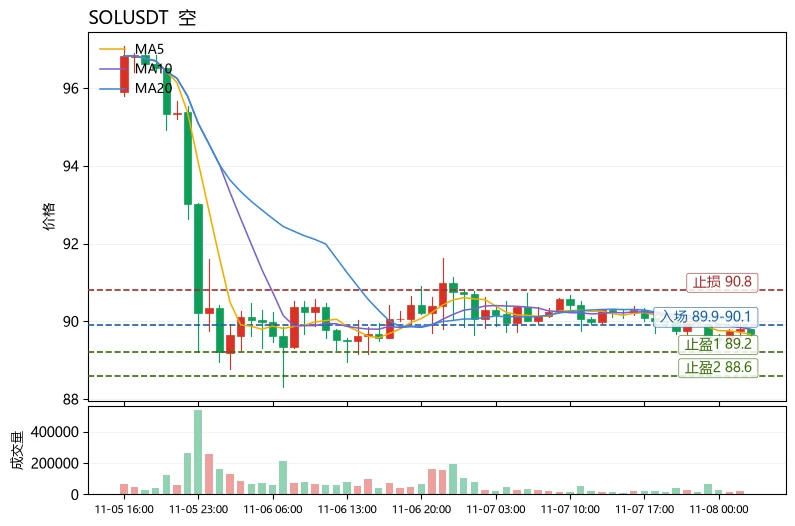
A common misconception is to see the price near the lower Bollinger Band and the RSI falling to around 40, then assume “oversold means a rebound is inevitable” and rush to buy the dip. Technically, oversold is simply one expression of weakness, not a reversal signal. Until the moving average structure recovers, the odds of catching a rebound are not high. $SOL is currently in this state.
The moving averages are bearishly aligned, with MA5=89.66 below MA20=90.019. The price is trading below the short-term moving averages, so a rebound would only be meaningful if it first holds around 89.7. The
post-image
SOL-0.77%
TRX+0.42%
XRP-1.15%
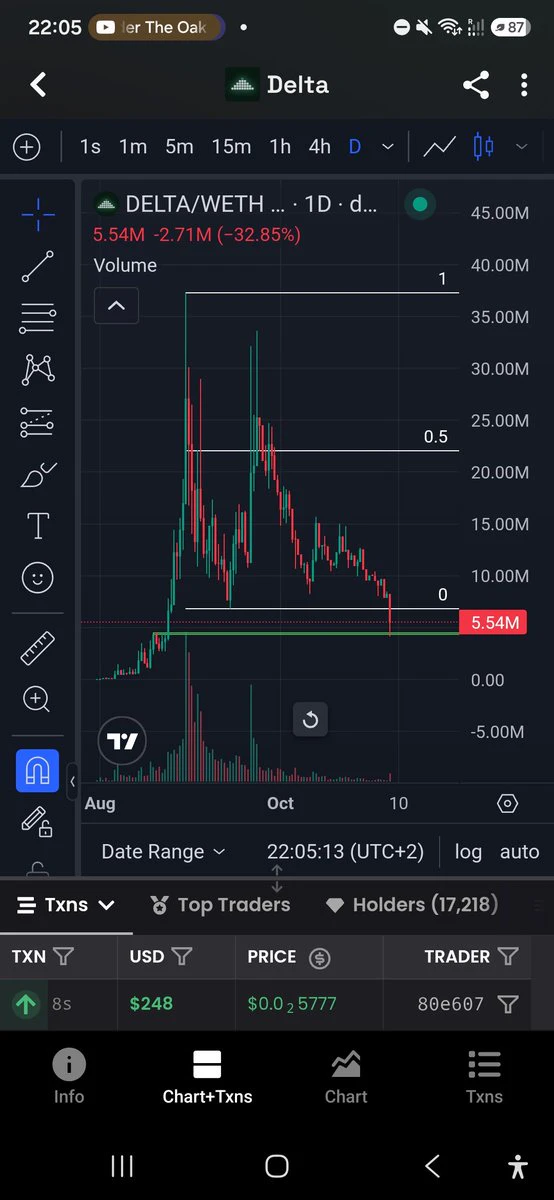
Bought $DELTA @deltaliquidity here on the capitulation/FUD
post-image
Gold 🥇
live-cover
LIVE598
Wow. 😍An upset? Man City actually lost to an obscure team? There was no action in the market over the weekend, so I tried a prediction. I actually got it right 😂 hahaha. Doubled my money. Faster than crypto 😂
Finally showing some real life, back above those moving averages. $SOXL is starting to look formidable again, making me wonder if we're really targeting recent highs or just teasing us. Take profit: 48.45 Stop loss: 44.72 Still active: $XRP : Current price 1.1621 - 24-hour change: -1.87%$IDOL : Current price 0.035111 - 24-hour change: +31.95%
post-image
SOXL-1.16%
XRP-1.15%
IDOL-6.71%
Just as I thought..
Midline mayhem
BTC/VIX
post-image
BTC-0.67%
Load More

Join 40 M users in our growing community

⚡️ Join 40 M users in the crypto craze discussion

💬 Engage with your favorite top creators

👍 See what interests you

Trending Topics

USAIStocksHitHard

21.1k Views3.67k Discussing

U.S. stocks sold off sharply on Thursday, November 5 (UTC). The Nasdaq closed down around 5.5%, entering correction territory, while the Philadelphia Semiconductor Index plunged roughly 12%, with chip stocks including $NVDA and $AMD posting steep losses. Beyond profit-taking, investors are growing concerned about the pace of AI data center construction, capital spending, and future returns on investment. The key question now is whether the AI sector’s lofty growth expectations need to be repriced. Where do you think the next opportunities will emerge: chip stocks, tech giants, or other sectors?

USNonfarmPayrolls

34.41k Views4.34k Discussing

StakeOnLaunchpoolToShare450KVLX

9.9k Views828 Discussing

View More