Square
Following
Hot
News
Notifications
Profile
Share your thoughts
placeholder
Article
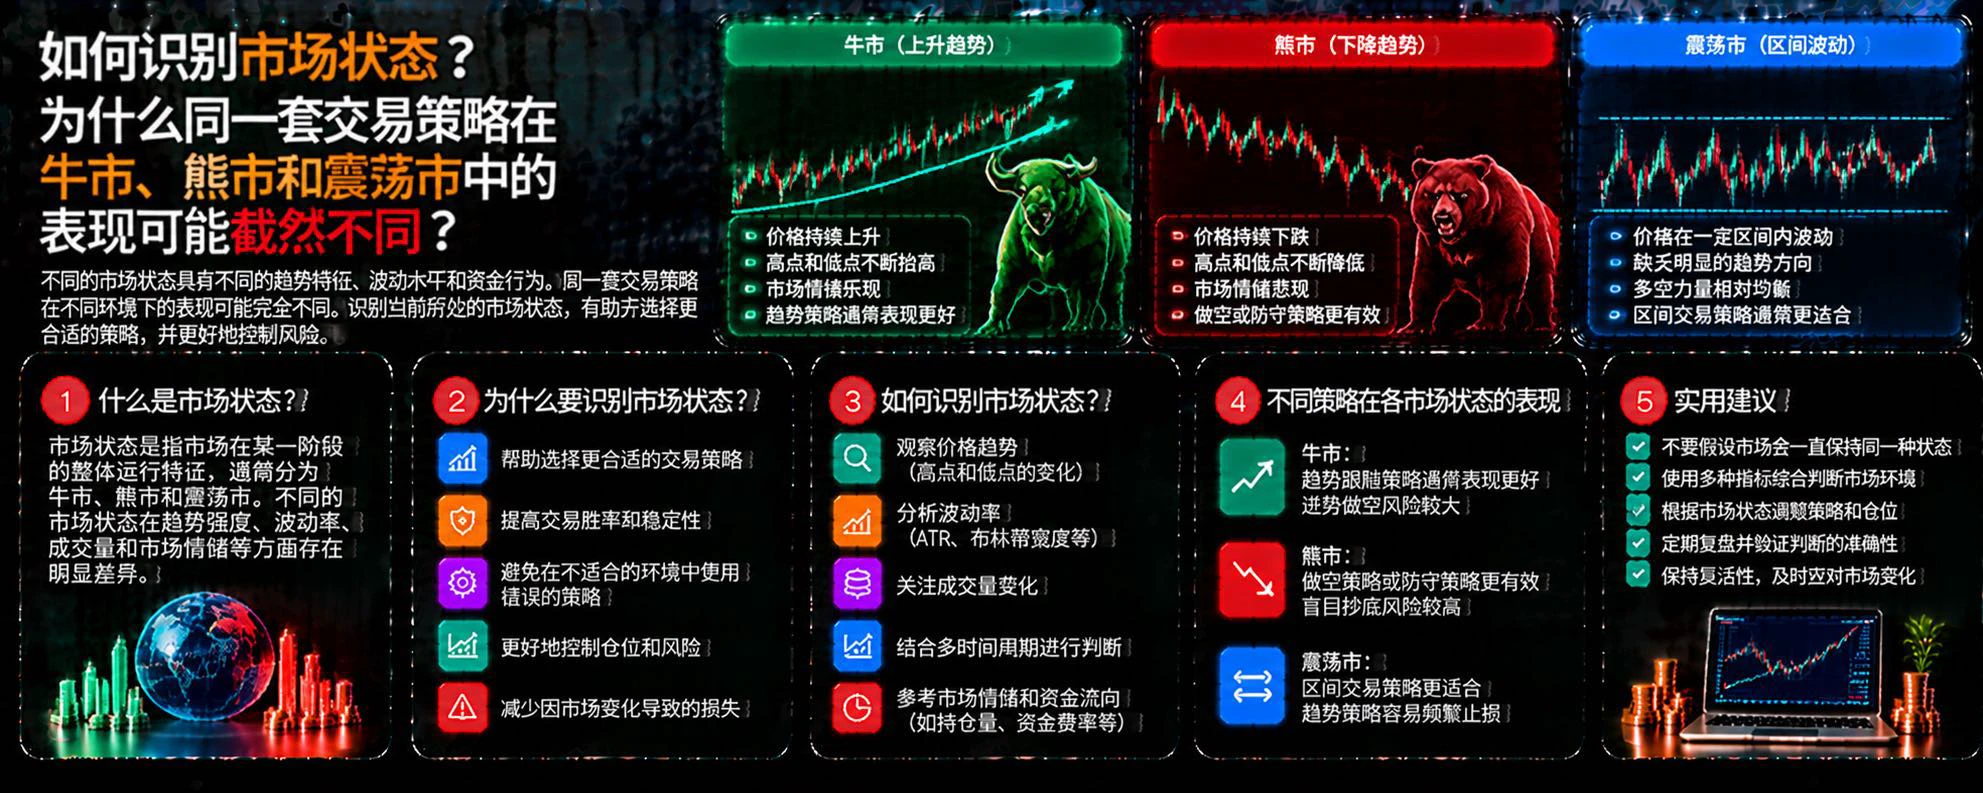
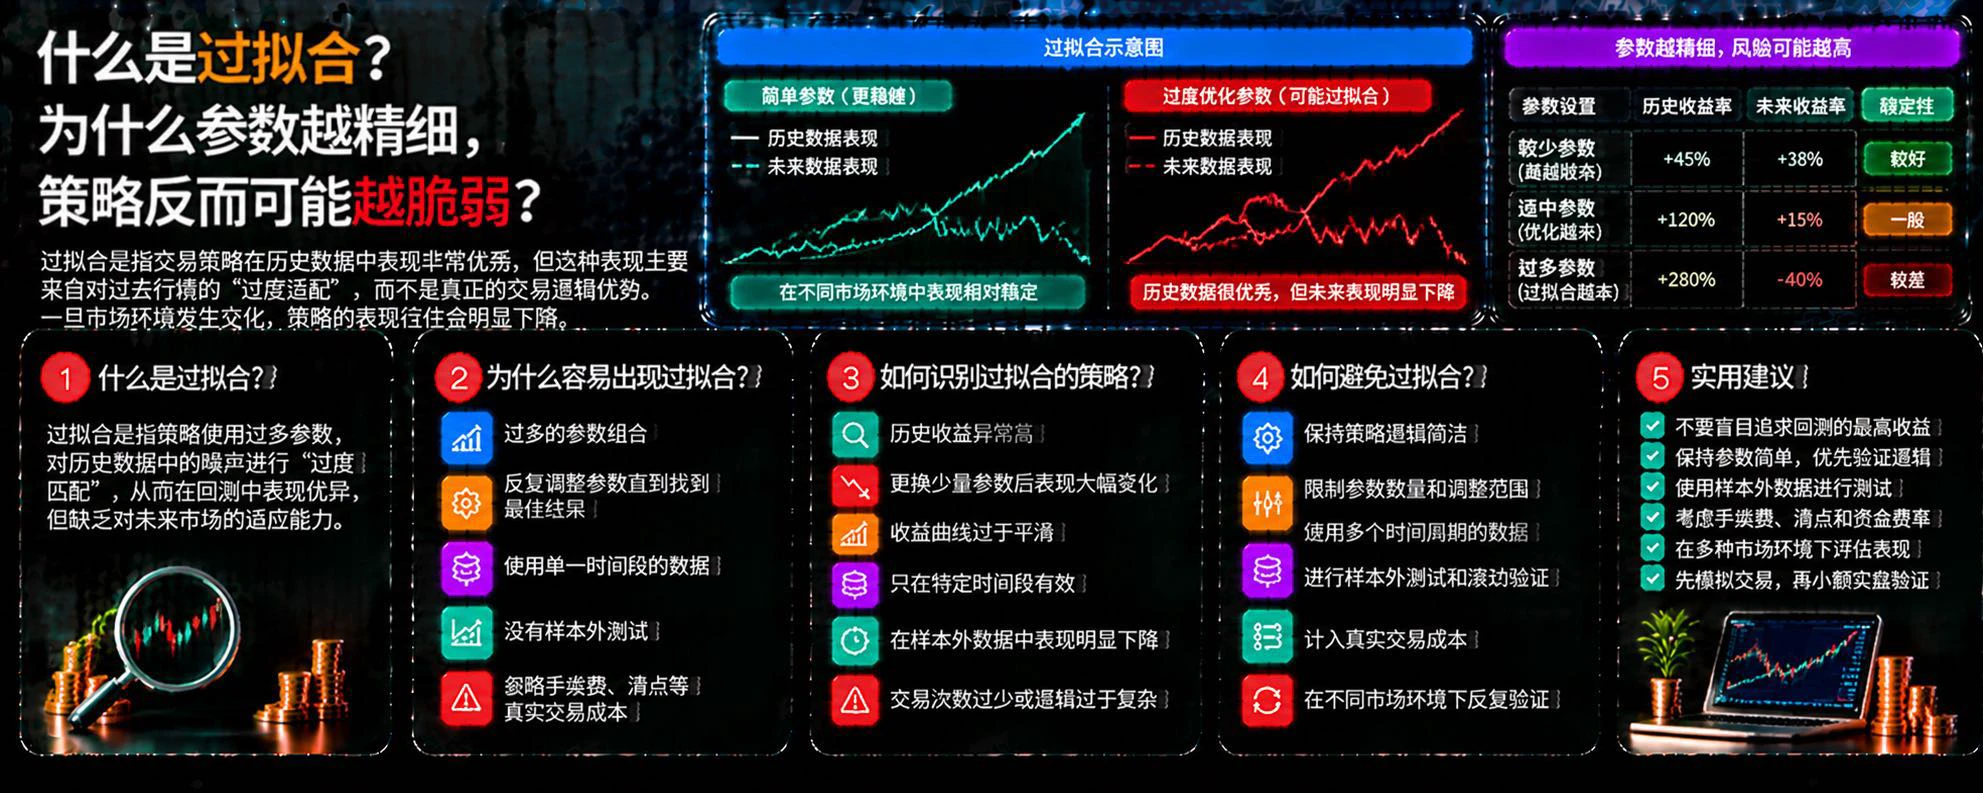
How can you identify market regimes? Why might the same trading strategy perform very differently in bull, bear, and sideways markets?

In cryptocurrency trading, many people look for a fixed strategy that they hope will keep generating profits regardless of how market conditions change. But markets do not always behave the same way. When trends, volatility, and capital flows change, the same strategy can perform quite differently.

First, what is a market regime?

A market regime refers to the overall characteristics of market activity during a given period. It can generally be classified as
post-image
#BTCDown4% #ShareWeekly
Bitcoin's $70,000 Battle: Breakdown, Recovery or a Bigger Market Reset?

Bitcoin is no longer simply approaching the $70,000 support zone. The market has tested and briefly traded below that psychological level, making the next daily and weekly closes extremely important. After struggling around $80,000 earlier in November, BTC fell toward $69,000–$70,000. The latest market snapshot showed BTC near $69,270, down approximately 6.10% over 24 hours and 8.55% over seven days. Its reported 24-hour range was roughly $68,900–$73,858. Market capitalization was around $1.40 tri
  • 4
Trenches
mihao
m
bade
b
mihao
4Cxj...pump
Market Cap
$.
Change
.
24h Vol
$
Holders
.
AGT
A
bade
b
AGT
0x5d...e274
Market Cap
$.
Change
.
24h Vol
$.
Holders
.
FOOD
F
bade
b
FOOD
FTu5...pump
Market Cap
$.
Change
.
24h Vol
$.
Holders
.
IDOL
I
bade
b
IDOL
0x3b...ab07
Market Cap
$.
Change
.
24h Vol
$.
Holders
.
AI
A
bade
b
AI
2T56...pump
Market Cap
$.
Change
.
24h Vol
$.
Holders
.
If you're waiting for the perfect buying opportunity, I don't think you're going to get it.
I'm already seeing signs of recovery on $ETH and buyers are starting to step in.
There's also a lot of short-side liquidity sitting above the current price, which could push $ETH toward $1,990 or even $2,000 if the recovery picks up.
Let's see how this plays out. I'm buying this dip right here.
post-image
ETH-1.23%
  • 2
  • 1
No way this is real. No one would do "Thomas the Train" plastic surgery.
Hey @grok, is this AI?
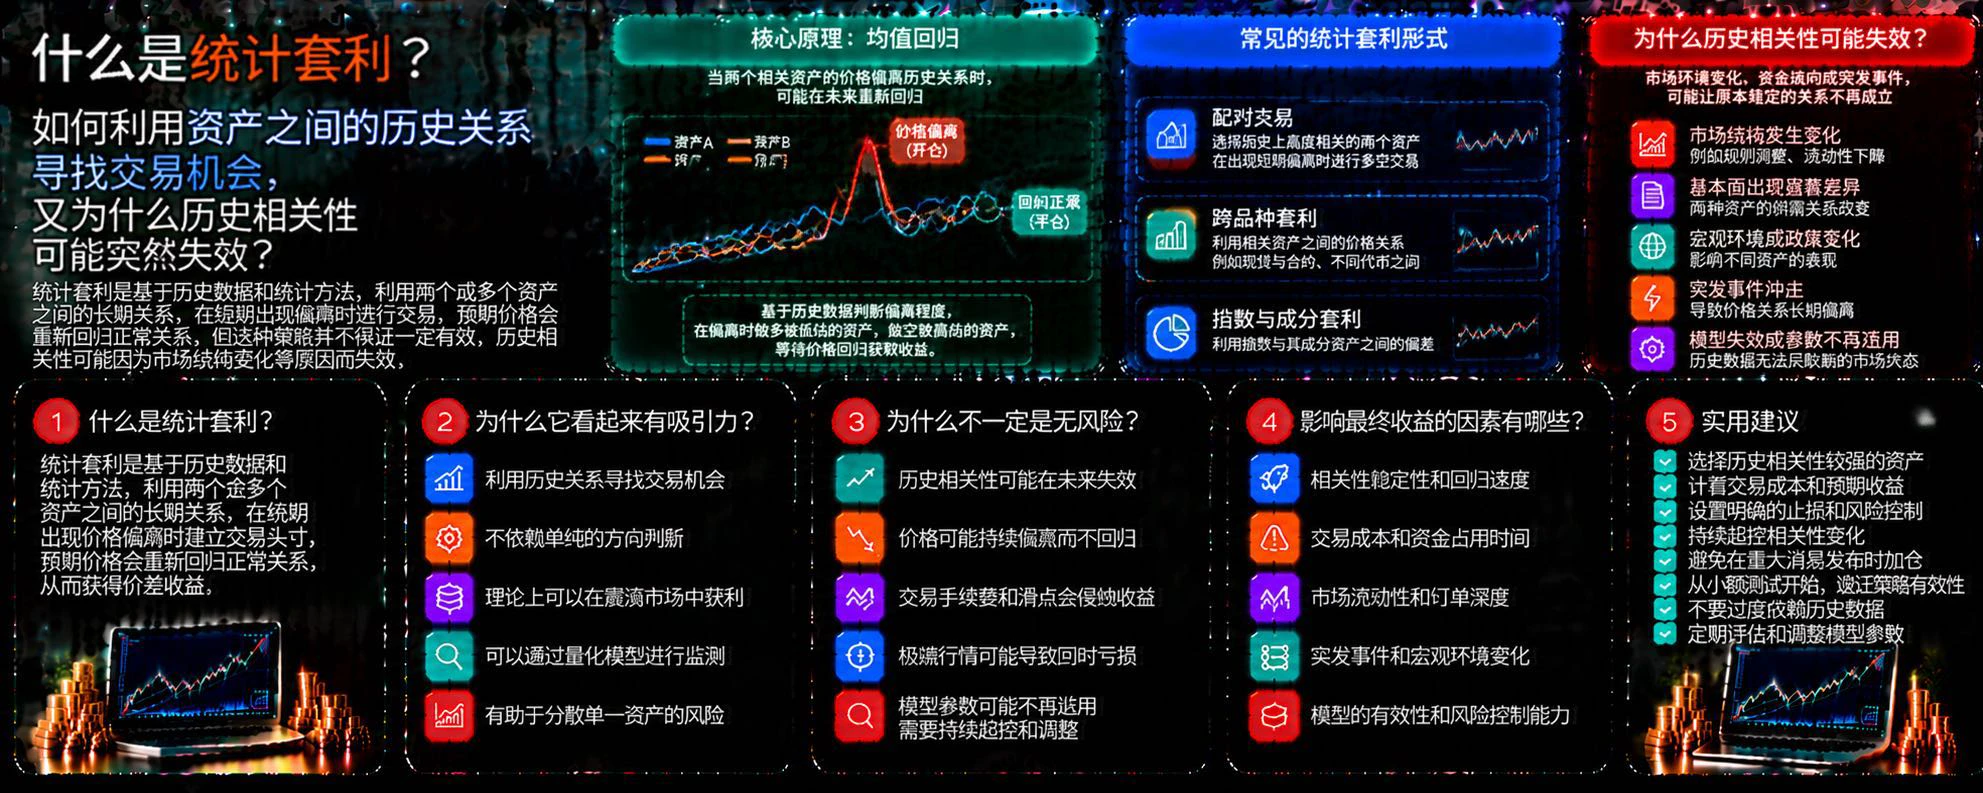
What is statistical arbitrage? How can historical relationships between assets be used to identify trading opportunities, and why might historical correlations suddenly break down?

In the cryptocurrency market, some assets have long exhibited similar price patterns. When their historical relationship temporarily deviates, traders may try to capitalize on the divergence. This is the basic idea behind statistical arbitrage, but historical patterns do not guarantee future repetition.

First, what is statistical arbitrage?

Statistical arbitrage is a type of trading strategy that uses historical
post-image
Marty supreme arc
post-image
Midday tip: try a short; it moved straight down with the trend, opening up 12 points of room! $XAU #BTC跌4% #黄金 ‌
XAU+0.38%
A storm is brewing.

The morning strategy was firmly bearish, and the order book broke down as expected. Bollinger Bands are opening and diverging downward, while the Wyckoff distribution structure has entered an acceleration phase. On top of CPI coming in above expectations and driving Treasury yields higher, a stronger U.S. Dollar Index is weighing on risk assets. With multiple forces converging, the bearish trend is now firmly established.

Don’t try to call the bottom against the trend; stay within the boundaries of the structure. The market always rewards those who are prepared. $BTC
BTC-0.65%
Why Can Large Trades Still Cause Slippage When Liquidity Is Ample?

Many traders believe that choosing a cryptocurrency with high trading volume and good liquidity will prevent slippage. In reality, ample liquidity can only reduce some execution risks; it does not mean that orders of any size can be filled at the expected price.

The key point is that good overall market liquidity does not mean there will be enough executable quantity at the specific moment you place an order and within the specific price range.

First, market liquidity is not the same as liquidity at a single price.

A tradin
post-image
Bitcoin has been steadily sliding lately, and market sentiment is on edge. Expectations that the Federal Reserve may continue raising interest rates are still building, while funds continue to flow out of Bitcoin ETFs. The price has already fallen below $70k. 😱
$BTC briefly dipped to around $68,000 today, breaking through several key levels in succession. Long liquidations exceeded $1 billion, and fear is clearly intensifying. Technically, short-term support is around $65,000-$67,000. If that level doesn't hold, there may be further downside.
$ETH has also weakened, falling to around $1,900
post-image
BTC-0.67%
ETH-1.26%
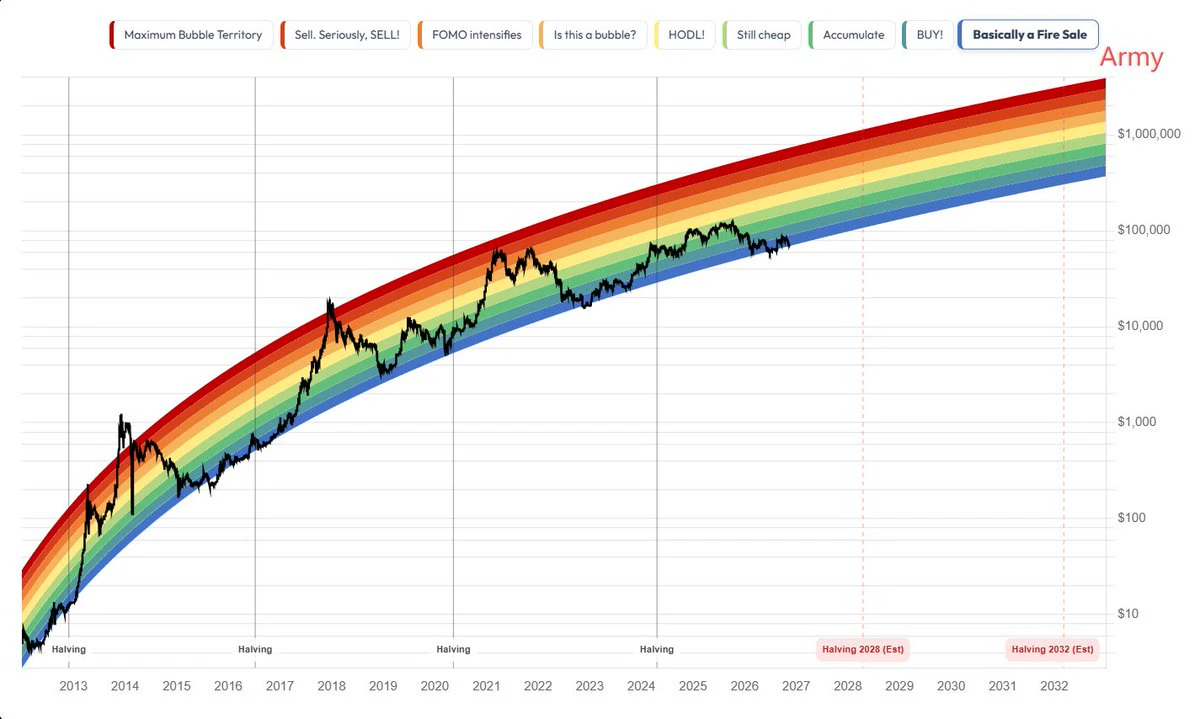
《Bitcoin Rainbow Chart: Price Returns to the “Discount Zone,”
Market sentiment continues to cool, and long-term valuations are gradually returning to lower levels.》
But historical cycles tell us that extreme undervaluation often occurs when market confidence is at its lowest.
Behind the price correction:
Should we look at changes in long-term holders’ holdings?
The direction of institutional fund flows?
And shifts at the margin in global liquidity?
If the macro environment gradually improves and on-chain holdings stabilize,
will the current valuation discount be further eliminated?
Of course,
post-image
BTC-0.67%
  • 1
$SUI Long: SUI is attempting to rebound from $0.7640, and a potential bullish bounce is forming—if buyers reclaim $0.8050, upside targets will gradually become clearer. Long $SUI Entry: $0.7950–$0.8000 Stop-loss: $0.7860 Take-profit 1: $0.8050 Take-profit 2: $0.8120 Take-profit 3: $0.8190 Take-profit 4: $0.8280 Trade here $SUI : 👇
post-image
SUI-1.05%
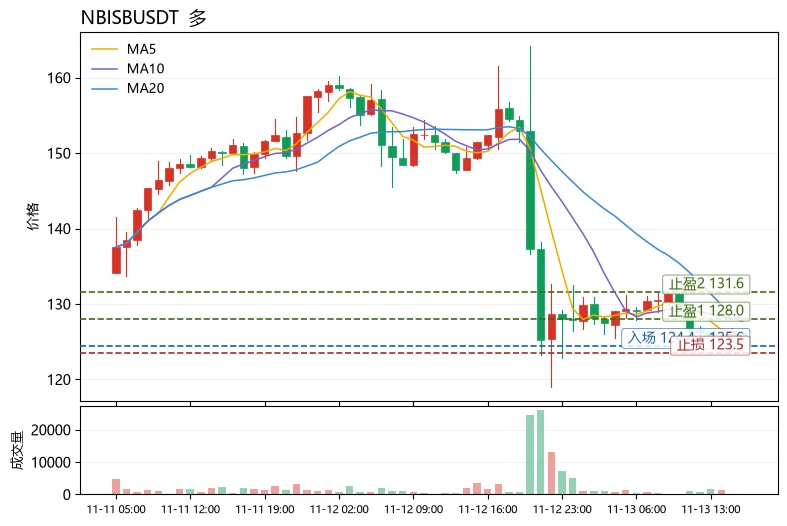
The most unusual detail in today’s market is that after $NBISB$NBISB fell 17.43% in 24 hours, its MACD histogram surprisingly turned positive (+0.2894), while the price remains below the declining MA5 (125.828) and MA20 (128.005). This kind of “bullish momentum picking up amid a decline” is often an early signal of an oversold rebound, not confirmation of a trend reversal.
To judge whether a trend is healthy using moving averages, focus on three things: the price’s position relative to the averages, the direction in which the averages are aligned, and whether momentum indicators are moving in
post-image
BTC-0.67%
Why Can the Order Book Look Deep, Yet Liquidity Suddenly Disappear When You Place an Order?

In crypto markets, you may sometimes see a large number of buy orders stacked in the order book and assume there is strong support below. But when prices start falling rapidly, those buy orders can quickly dwindle, and a market that looked stable can suddenly become fragile.

Why does this happen?

First, orders can be canceled at any time.

The order book shows currently visible limit orders, not completed trades. Traders can modify or cancel orders as market conditions change. So large orders only in
post-image
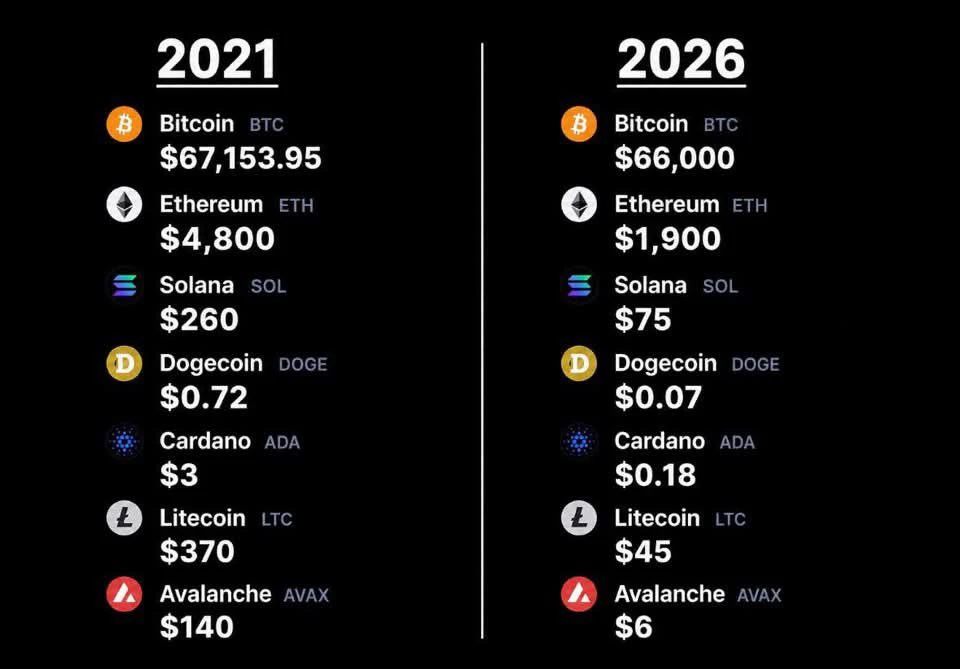
Crypto 2021 vs Crypto 2026
I think we went back in time... ?
post-image
BTC MARKET UPDATES.
live-cover
LIVE1,980
What Is the Funding Rate? Why Can Perpetual Contracts Continue to Incur Holding Costs Even When Prices Do Not Change Significantly?

In crypto trading, many people focus only on price movements after opening a position and overlook the funding rate. For perpetual contract traders, even if prices move sideways for a long time, holding a position may still incur additional costs or generate returns as long as the funding rate is not zero.

First, what is the funding rate?

The funding rate is a mechanism in perpetual contracts through which longs and shorts make periodic payments to help keep th
post-image
Subscribe to Anthropic, earn trial funds, and win more rewards through post-listing trading

The Anthropic (ANT) IPO subscription channel is now open! Complete a valid subscription through Gate IPO Access and meet the threshold based on your final subscription amount to receive up to 1,000 USDT worth of ANT stock trading trial funds. Even if you are not ultimately allocated shares, eligible valid subscriptions can still participate in the rewards.

More benefits are available beyond subscribing:
Post-listing trading benefits: ANT is scheduled to begin trading on November 19. Take part in de
post-image
BTC falls below $71k, hitting its lowest level since September! The $70k level is under threat—where
live-cover
LIVE2,191
📈 See the real returns of top traders!
7-Day Copy Trading Returns Leaderboard
🥇 Hunter of Highs and Lows: +818%
🥈 Heaven-Sent Harmony: +176%
🥉 Soul Wanderer youshi: +149%
Instead of blindly feeling your way around, copy success directly. Copy trade with one tap and let your returns run!
🔗 Follow Now: https://www.gate.com/copytrading
#跟单 #交易高手 #收益
  • 4
  • 1
Load More

Join 40 M users in our growing community

⚡️ Join 40 M users in the crypto craze discussion

💬 Engage with your favorite top creators

👍 See what interests you

Trending Topics

JensenHuangResigns

512.4K Views8K Discussing

Jensen Huang has resigned as NVIDIA CEO and stepped down from the board. CFO Colette Kress will serve as interim CEO while NVIDIA considers internal and external successors. $NVDA fell more than 10% in premarket trading following the announcement. With one of AI’s most influential leaders stepping aside, markets are now reassessing NVIDIA’s leadership stability, AI strategy, and long-term valuation.

GateIPOAccessAnthropic

278.5K Views2.6K Discussing

Dr.HanOxfordUnionSpeech

144.3K Views442 Discussing

View More