
Square
Following
Hot
News
Notifications
Profile
Share your thoughts
placeholder
Article
JUST IN: 🇯🇵 Japan's Nikkei 225 officially enters bear market as stock market crashes.
JPN225-0.62%
Layout: Bitcoin, Ethereum, Dogecoin
live-cover
LIVE890
  • 1
Trenches
ZIG
Z
bade
b
ZIG
0x8c...1145
Market Cap
$.
Change
.
24h Vol
$.
Holders
.
BTC
B
bade
b
BTC
C5xp...pump
Market Cap
$.
Change
.
24h Vol
$.
Holders
.
CORLA
C
bade
b
CORLA
0xba...7777
Market Cap
$.
Change
.
24h Vol
$.
Holders
.
STONK
S
bade
b
STONK
6GmA...UNgx
Market Cap
$.
Change
.
24h Vol
$.
Holders
.
DESSA
D
bade
b
DESSA
npz2...pump
Market Cap
$.
Change
.
24h Vol
$.
Holders
.
11.6 BTC Positioning Strategy

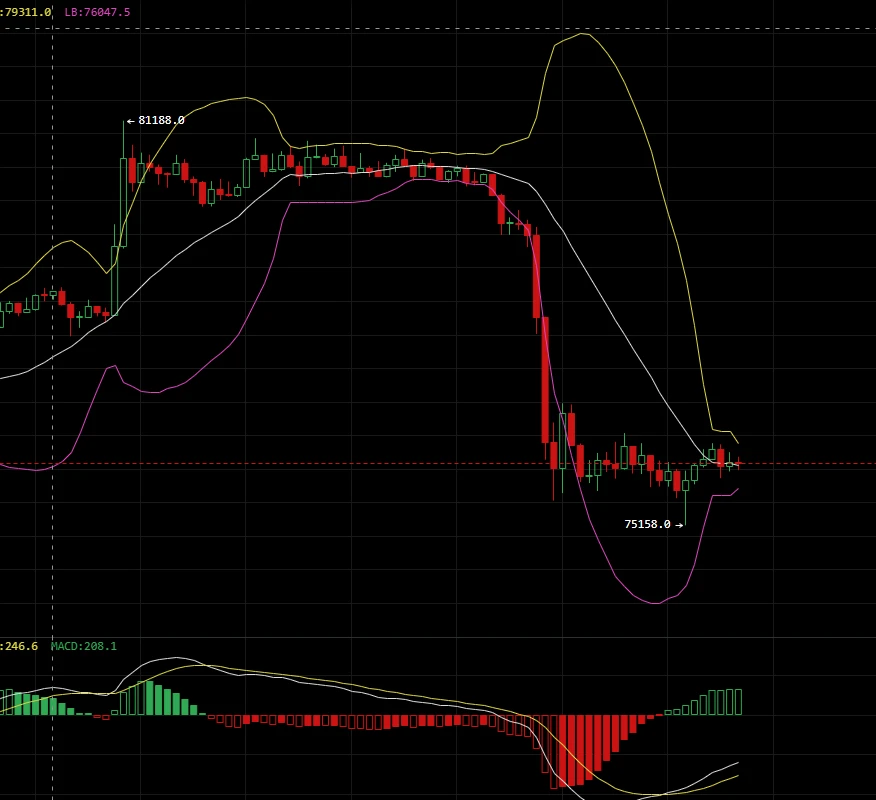
  BTC quickly fell from a high of 81188 to a low of 75158, completing a short-term oversold flush. The price is now consolidating around 76100 as it recovers. The Bollinger Bands remain broadly in a downward-opening bearish structure, but the price has moved away from the oversold lower band and begun to rebound. Bullish momentum bars continue to expand, giving the short-term rebound room to recover from oversold conditions. On the support side, the first key support is the 75150-75200 range around this decline’s low, the last line of defense for short-term bulls
post-image
BTC-0.65%
$AKE Did someone take the bait again
post-image
AKE+6.07%
  • 1
Tonight’s nonfarm payrolls data:

If the numbers come in way above expectations, unemployment doesn’t rise, and wages increase, rate-hike expectations will climb again—and that would be a double whammy for the market!

But last night’s drop had already priced in the expectations, and the analyst above has already explained that if the nonfarm payrolls data is fairly strong and rate-hike expectations ease, the market could potentially V-rebound. After all, the bill that was just introduced is only a proposal. It simply reflects the Democrats’ push to tighten AI policy and the uncertainty that c
post-image
📅November 6 (Friday) Macro & Finance | Beijing Time

Key event: US nonfarm payrolls at 21:30 are the day's highest-impact data release, directly affecting market volatility

1. 15:00|Germany's September seasonally adjusted industrial production month-over-month; UK's October Halifax house price index month-over-month
2. 15:45|France's September trade balance
3. 16:00|Switzerland's October consumer confidence index
4. 18:00|Eurozone's September retail sales month-over-month
5. 21:30【Major】US October nonfarm payrolls, US October unemployment rate
6. 23:00|US preliminary University of Michigan c
The point is, you have to go to a store that has these systems.
Welcome “Meicun” to altcoin season.
post-image
Filecoin's Warm Storage, its paid onchain cloud tier, passed 40 TB of stored data on November 2.
Going from 20 TB to 30 TB took 56 days. The last 10 TB took 9.
@Filecoin
FIL-2.00%
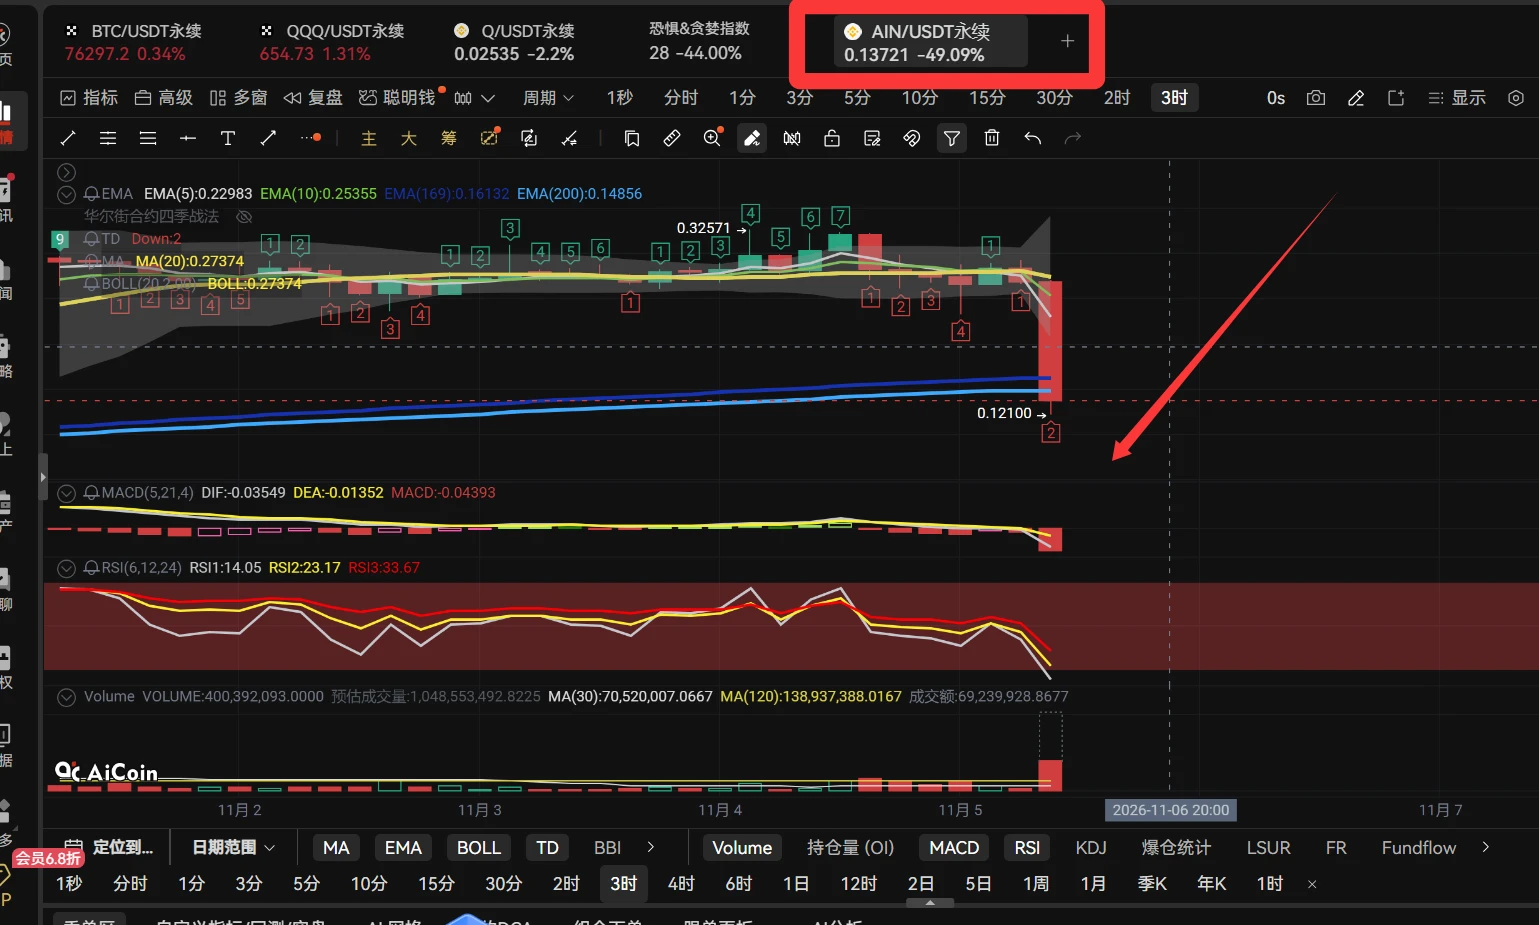
It fell to 0.12 today, finally dropping by a full 50% or more. I finally scored a big win! Brothers and sisters, you can all look at my case as proof—it finally took off!
post-image
ShanghaiBrotherMgcb2124
Shanghai Mige’s November 4 live trading walkthrough:

Trade AIN: short it at 1x leverage, with 10% of your position at 2.99 and 20% at 3.29! I’ll help you double your wealth in one week—this is the proof. That’s what professionalism looks like!

repost-content-media
  • 1
Bitcoin on 11/6:

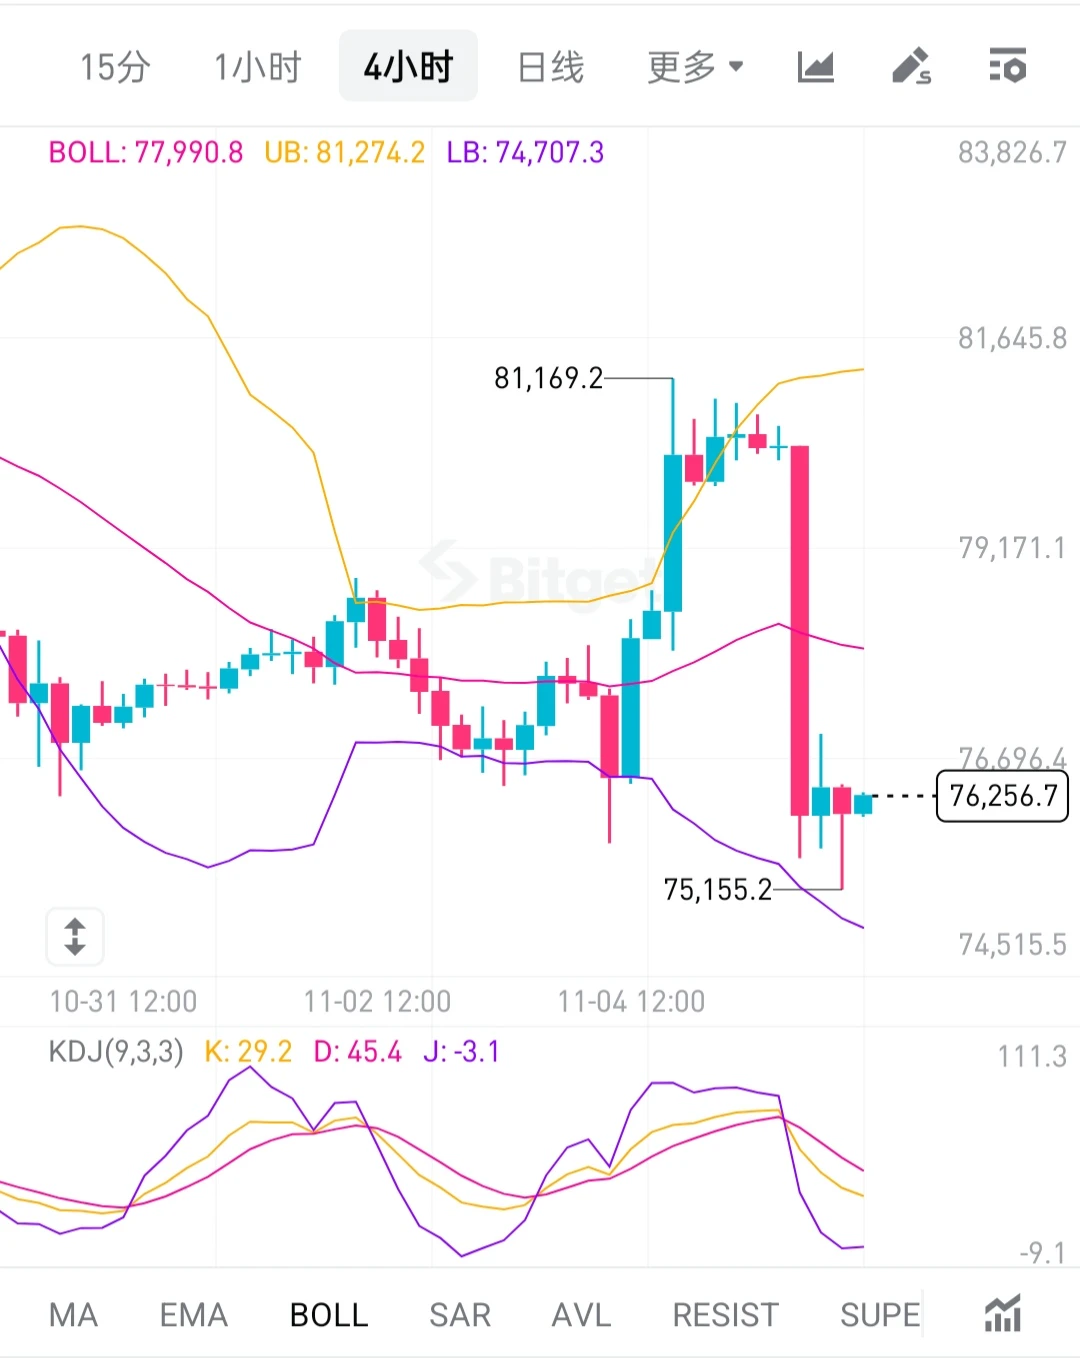
On the 4-hour chart, the price surged to around 81170, met resistance, and pulled back. A large bearish candle broke through the Bollinger middle band, weakening the short-term trend. The price is now consolidating near the lower Bollinger Band. The KDJ J value has reached -3.1, entering oversold territory, so a short-term rebound may be due.

Watch the Bollinger middle band as short-term resistance and the recent low as support. After a bullish run, selling pressure has been released all at once. Oversold conditions can easily trigger a rebound, but the trend can only return
post-image
BTC-0.67%
No need for so much skepticism; 55x took 10 days
☀️ GM! The market suddenly hit the brakes—what signal will tonight’s nonfarm report flash? 🚦
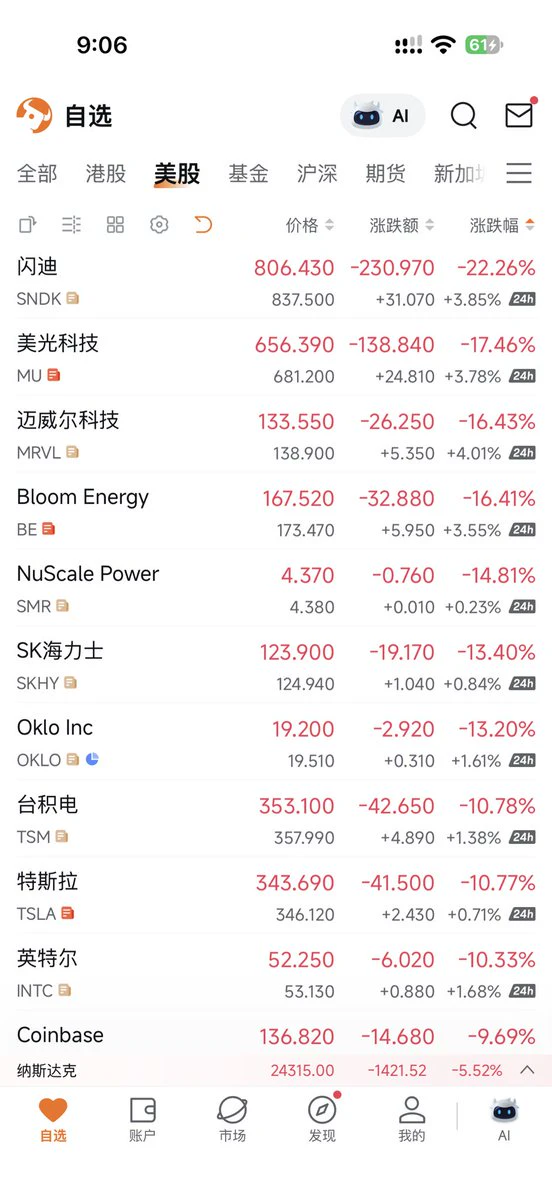
The Nasdaq plunged 5.52% last night, while BTC pulled back to around $76K . The U.S. nonfarm payrolls report is due out tonight at 21:30. 👀

📌 Today’s featured topic: How will you adjust your trading strategy ahead of the nonfarm report?
🔴 Risk watch: Will U.S. stocks and BTC remain under pressure?
🟡 Waiting for confirmation: What changes could the nonfarm report bring?
🟢 Looking for opportunities: Are there any assets worth watching in this pullback?

🎁 Come share your nonfarm predictions and t
post-image
NAS100-0.07%
BTC-0.67%
  • 9
  • 3
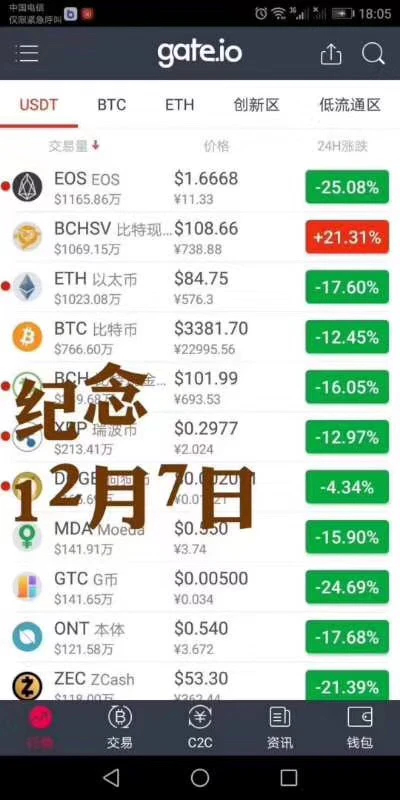
$BTC Let me jog your memory. Look at the black swan event back then—many users today have never experienced it.
post-image
BTC-0.67%
$ETH 🔎 #ETHDrops5.5% 👀 ‌ ‌Is the 5.5% drop in ETH driven by price action alone, or is there something else at play?

While everyone in the market is talking about ETH’s 5.5% decline, the real story isn't found on the price chart; it lies in the quiet accumulation by an institutional "whale" amidst a brewing macroeconomic storm.

Over the last 24 hours, ETH has fallen sharply to the $2,252 level, resulting in the liquidation of positions held by approximately 199,000 investors. However, this decline is not merely a case of a flight to safety; it is being shaped by a combination of tightenin
ETH-1.26%
  • 3
  • 1
Yesterday early morning, I warned against going long. Today’s market action provided the answer.

BTC fell from around 80500, hitting a low of 75158, a short-term pullback of more than 5300 points.

Yesterday, I repeatedly stressed not to assume the bottom was in just because the price had fallen for a while. Especially in a sustained downtrend, the more urgently you try to buy the dip, the more likely you are to enter while prices are still falling.

Often, the hardest part of trading is not catching the exact bottom, but controlling the urge to enter a position.

Without a clear signal that
BTC-0.65%
ETH-1.23%
Morning updates with beautiful girl
live-cover
LIVE1,630
11.6 $ETH Today's Outlook
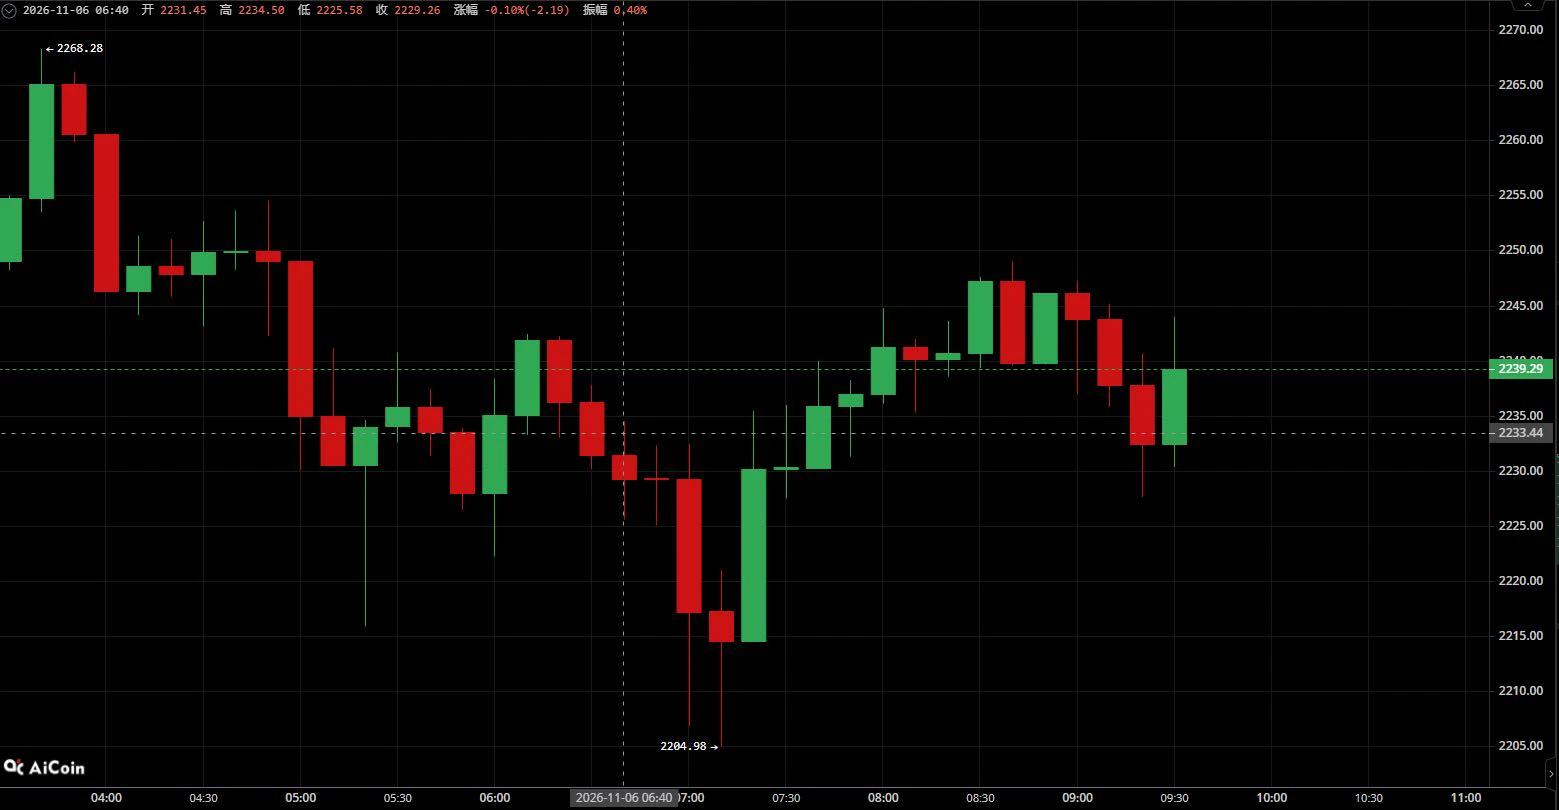
After bottoming at 2204.98 overnight, the market entered an oversold recovery phase. The broader bearish trend remains unchanged, and the rebound still has room to fall when it meets resistance. Prioritize shorting rallies, with short-term longs at support as a secondary strategy.
#美股史诗级抛售
- Support: 2215-2220, 2205
- Resistance: 2240-2245, 2255-2260
- Short: Enter in batches on a rebound to 2240-2245, stop-loss at 2265, initial target 2225, then 2205 if support breaks
- Short-term long: If price stabilizes after retesting 2215-2220, consider a light long position;
post-image
ETH-1.26%
Ethereum continued its door-shaped price action this morning, dipping to around 2205 at the low. The short shared early this morning at 2251 has been closed for profit!$ETH
ETH-1.23%
261106 Bitcoin on the weekly chart, market is weak. BTC/ETH on the 12-hour chart; use stop-losses for short-term trades! BTC resistance levels: 77458/78827/79892 BTC support levels: 74718/73349/72284 ETH resistance levels: 2278/2319/2350 ETH support levels: 2198/2157/2126 Place the stop-loss slightly beyond the third price. Intraday trades should not exceed 5% of your position. Livestreams are held in the afternoon and evening; follow my homepage to find me. #Gate安全卫士免费开通
post-image
BTC-0.67%
ETH-1.26%
Load More

Join 40 M users in our growing community

⚡️ Join 40 M users in the crypto craze discussion

💬 Engage with your favorite top creators

👍 See what interests you

Trending Topics

USStocksFaceHistoricSelloff

1 Views3.43k Discussing

U.S. stocks suffered a sharp selloff on Thursday, with the Nasdaq closing down more than 5% and the Philadelphia Semiconductor Index falling over 12%. AI and chip stocks including $NVDA and $AMD were hit especially hard. Markets are reassessing AI valuations, data-center spending and future returns. Is this just short-term deleveraging, or the start of a deeper correction in the AI trade? Which sectors are you watching next?

GateLaunchesPoSECProofOfSecurity

10.9k Views557 Discussing

USNonfarmPayrolls

8.57k Views3.96k Discussing

View More