Square
Following
Hot
News
Profile
Share your thoughts
placeholder
Article
PPI rises 6.3% year over year, highest since 2022; energy is “eating” the entire economy
Yesterday, when the PPI data came out, I was looking at Gate’s candlestick chart. The moment the numbers appeared, my first thought was, “I must be reading that wrong.”
September PPI rose 6.3% year over year, versus expectations of 5.4% and a previous reading of 5.4%. It rose 1.3% month over month, versus expectations of 0.6% and a previous reading of 0.4%. Core PPI rose 5.0% year over year, versus expectations of 4.4%. Core PPI rose 0.7% month over month, versus expectations of 0.3%. All figures significa
MU-5.66%
$EPIC It surged 18% in a day, briefly touching 0.3350 before dumping back to 0.2884. That long upper wick is no joke.
First, the signal: this is a classic high-volume spike and retracement. The 24-hour trading volume of 72.2M alongside an 18.29% gain shows the volume is real, but that wick at 0.3350 indicates very heavy overhead selling pressure. From the low of 0.2182 to 0.3350, the price gained 53%, so profit-taking at this level is perfectly normal. Technically, 0.2884 sits just below the midpoint of the intraday gain, putting it in the pullback confirmation phase—not a breakout entry poin
EPIC+23.19%
Trenches
AGT
A
bade
b
AGT
0x5d...e274
Market Cap
$.
Change
.
24h Vol
$.
Holders
.
CNPY
C
bade
b
CNPY
0xc6...ddd2
Market Cap
$.
Change
.
24h Vol
$.
Holders
.
Q
Q
bade
b
Q
0xc0...0589
Market Cap
$.
Change
.
24h Vol
$.
Holders
.
Gato
G
bade
b
Gato
55A3...pump
Market Cap
$.
Change
.
24h Vol
$.
Holders
.
DOPE
D
bade
b
DOPE
0xf9...8899
Market Cap
$.
Change
.
24h Vol
$.
Holders
.
$Online Loan Life: Borrow money to enter the market, stay up all night watching charts, and keep adding to the position.
Act like nothing’s wrong during the day; stare blankly at red candles at night.
When liquidation hits, debt collection texts arrive more punctually than market moves.
Interest keeps accruing, but the position is down to zero.
We’re not gamblers, just ordinary people trying to survive in crypto.
Online loan life: the most honest portrait of crypto bros.
post-image
EIA data determines the short-term direction of crude oil
live-cover
LIVE13
#美国9月PPI大超预期
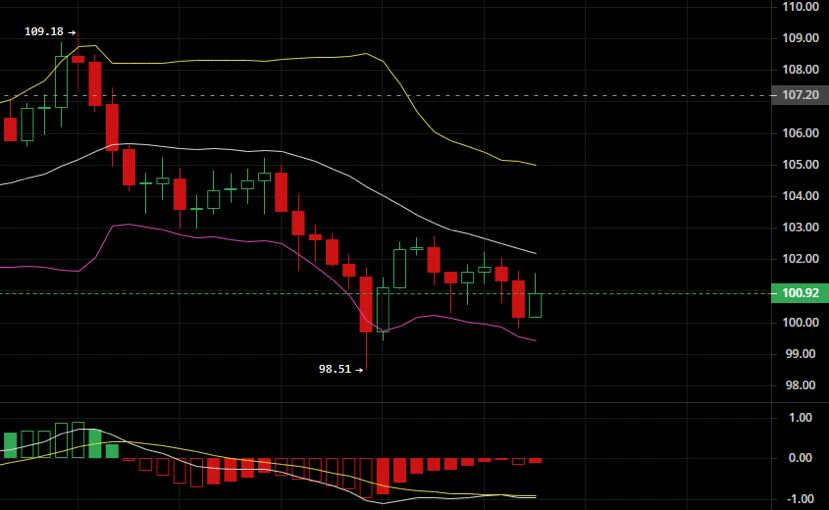
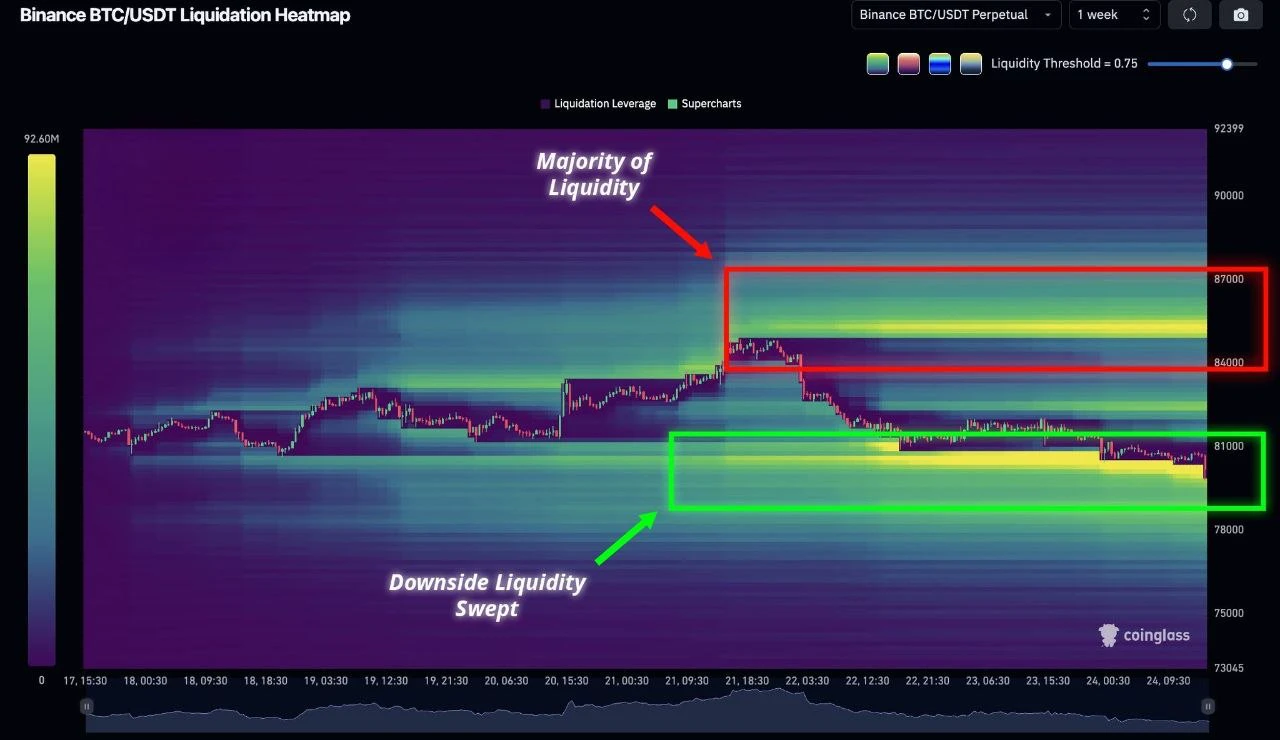
My 83626 short, current price 81382.4, with a large unrealized profit. 82057 will determine direction.
Market: The 4H chart pulled back from 84340, bounced weakly after bottoming at 79732.3, and is now at 81382.4 (down 0.21% over 24h). MA5 (81277.8) and MA10 (81367.6) are intertwined near the current price, while MA30 (82057.7) continues to trend down and cap price. The overall bearish trend continues, with weak, choppy trading.
P&L calculation: 83626 - 81382.4 = a 2243.6-point price difference; the large unrealized profit continues to grow.
Key levels: Support 80751/79732, resis
BTC+0.03%
Good morning, $DOGE fam! 🤝🐕
Gm C X ☕️🌎
Happy weekend! ✌️🌦🍂
Dogecoin to the moon! 🚀🌑
post-image
DOGE-0.92%
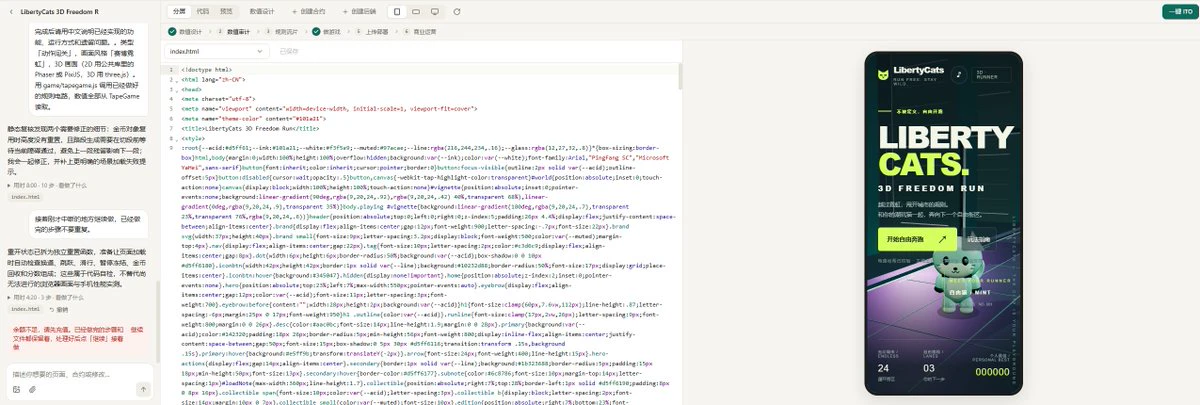
Making a little bear—almost 2 hours and it’s still not done. At a rough glance, the interface looks inferior to SOL6.1 but better than LUNA. So this is the DEEPSEEK-V4.1-FLAH-1017 you were hyping? By the way, it has cost ¥3 so far
post-image
LUNA-4.54%
DEEPSEEK-4.55%
It tested below that moving average again, but it just couldn't hold. $ARB quickly proved that shorting today was the right call. This trade made a 60% profit, a result that's hard to argue with. Notably: : Current price 0.23321 - 24-hour gain: +20.11%$AGT : Current price 0.083382 - 24-hour gain: +40.11%
post-image
GTC
GTC芝麻币
Gate.Fun
MC:$0.1Holders:1
0%
ARB-4.14%
AGT+15.72%
Layout: Bitcoin, Ethereum, Dogecoin
live-cover
LIVE880
  • 4
$SNDK SHORT SETUP — SELLERS IN CONTROL! 📉**
Entry: 1265 – 1280 (Short)
SL: 1308
TP1: 1240
TP2: 1215
TP3: 1185
$SNDK has broken below its consolidation zone, with strong selling pressure. The current bounce looks weak.
As long as 1308 holds, further downside remains possible.
**Wait for a bearish rejection before entry.**
post-image
SNDK-2.76%
  • 3
BTC’s battle to defend 80,000 goes into overtime after Warsh’s remarks

Before Warsh’s remarks, BTC seesawed between 80,443 and 82,000. After he began speaking, the price saw no sharp moves—because there were no unexpectedly hawkish or dovish signals. As I write this post, BTC is hovering around 80,800.

Why is the 80,000 level so important? I looked at a few data points.

The first is the ETF cost basis. The average cost basis for U.S. spot Bitcoin ETFs is around $81,500. BTC has fallen below this level, meaning most investors who bought through ETFs are now at a loss. If the price stays b
NVDA-1.42%
Too outrageous, $BTW has been pumped way too hard. Lee is preparing to short heavily, anticipating a potential downturn. $AGT Strongly short $Q 🥳🥳🥳
post-image
BTW+19.06%
AGT+15.72%
Bullish on $PARTI .Position Entry: 0.02823 - 0.02886Profit Target 1: 0.03015Profit Target 2: 0.03143Risk Limit: 0.02710Catching the knife at lows for a quick oversold bounce. Let's print!Support the idea here.Watching this market pair: $Q and $EPIC .
post-image
PARTI-17.18%
EPIC+23.19%
#DOGE #WCTCS9 Dogecoin May See Its First Major Daily Death Cross of 2026: Is a Potential Trend Reversal Coming?
A potential trend reversal could offset bearish pressure and invalidate the current pattern.
Dogecoin could see its first daily death cross of 2026 as moving averages suggest they will converge in the coming days. The daily 50-day moving average is currently trending downward, while the daily 200-day moving average is flattening, highlighting the potential for a death cross. Dogecoin saw its first daily golden cross since 2026 in October, but profit-taking in the crypto market drove
post-image
ThisIsTranslateContent:
#DOGE #WCTCS9 Dogecoin may see its first major daily death cross of 2026: Is a potential trend shift approaching?
A potential trend shift could counter bearish pressure and invalidate the current setup.
Dogecoin could see its first daily death cross of 2026, as moving averages point to convergence in the coming days. The daily 50-day moving average is currently sloping downward, while the daily 200-day moving average is flattening, highlighting the potential for a death cross. Dogecoin saw its first daily golden cross of 2026 in October, but profit-taking in the crypto market drove its price down to a low of $0.077. Bears seem to be making an aggressive effort to negate this bullish signal, with the possibility of a death cross drawing near.
The timing of a death cross remains uncertain, as a trend shift could counter the bears’ push and invalidate the current pattern. At the time of writing, Dogecoin was up 3.19% over the past 24 hours to $0.081, after briefly selling off as investors weighed higher-than-expected inflation data and the latest remarks on interest rates from Fed Chair Kevin Warsh.
Inflation data released this week was strong: the Producer Price Index released Thursday showed wholesale prices rose 6.3% year over year in September, the biggest increase since 2022. The Consumer Price Index also rose in data released Wednesday. Fed officials responded in September by approving the first rate hike in more than three years; markets expect the Fed to hold rates steady in October and hike again in December.
Could a trend shift be coming? The last time Dogecoin saw a death cross on the daily chart was in November 2025, followed by months of selling until a golden cross appeared recently. This has focused market attention on price action in case a death cross ultimately appears again.
Crypto analyst Ali recently posted a contrarian take on X, sharing three reasons to be bullish on Dogecoin.
First, the TD Sequential indicator has previously marked potential turning points for Dogecoin several times, and this time it issued a buy signal on the daily chart as the price neared $0.081.
Second, URPD data shows that about 36 billion DOGE previously traded near $0.081.
Third, whales appear to be buying near this support level, having accumulated 600 million DOGE since October 12.
If $0.081 holds and Dogecoin rebounds, Ali identifies the $0.16 to $0.17 range as a potential profit-taking zone. $DOGE
repost-content-media
DOGE-0.92%
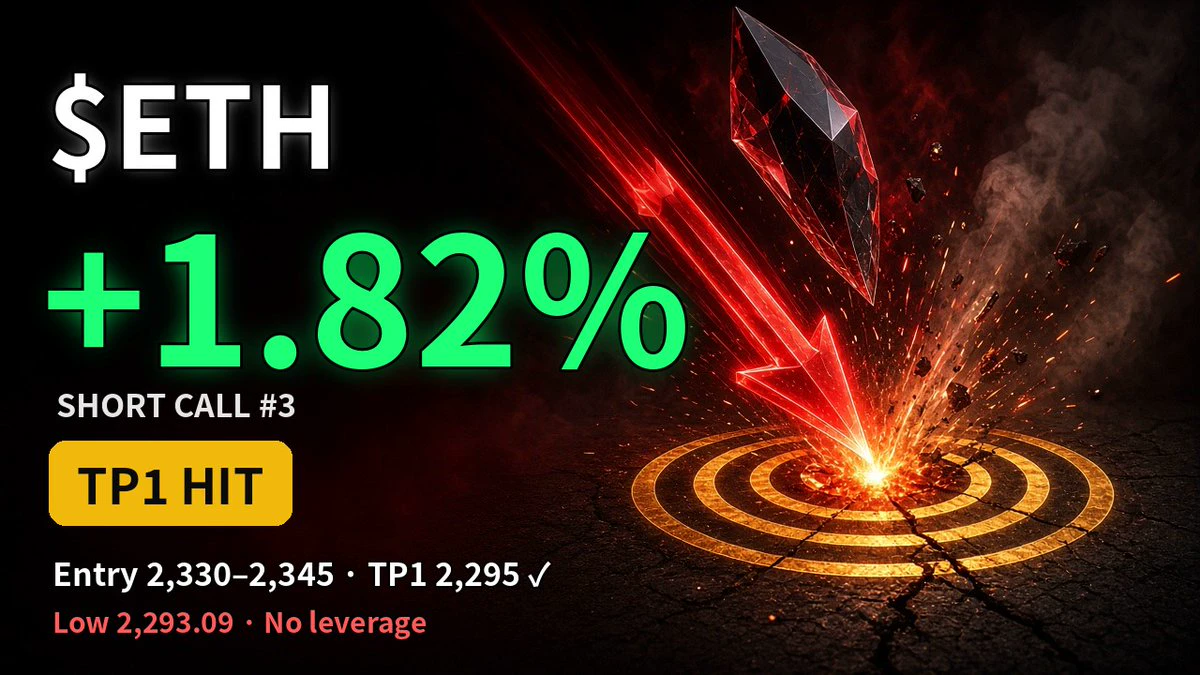
$ETH is currently at 2,396.89, down 1.15% over 24 hours, with volume at 0.12 times the average over the past 20 candles. Put these figures together, and the key point to explain is that $ETH’s price has already moved, but trading activity and volume have not followed.
One verifiable update: Gate’s official announcement reads, “Gate Research: Corporate Earnings Support U.S. Stocks, KR1 Launches Ethereum Validator Nodes…”. It may explain why people are paying attention, but it cannot answer which way the price will move.
You can tentatively trust the direction, but not assume the move will conti
post-image
ETH-0.60%
At 5 a.m., Ethereum saw another sharp wick down, mainly as Brent crude broke above $106 in after-hours trading, up more than 4% intraday
Combined with the U.S. September CPI annual rate accelerating to 3.7%, markets repriced the rate-hike path and risk appetite contracted; continued net outflows from spot ETFs and declining exchange reserves amplified the drop, leaving the short-term outlook weak.
post-image
ETH-0.60%
BZ-0.48%
  • 1
  • 1
Can stablecoins also have a directional bias? Bottom line: yes, but only for mean reversion within an extremely narrow range, and $U currently has a clear edge in relative sideways strength.
Sector comparison: $SOL is trading at 103.48, with MA5 below MA20, RSI at 44.7, bearish MACD, a funding rate of -0.0022%, and a range of about 3.89% over 30 candles; $APT is trading at 0.7936, down 5.56% over 24h, with RSI at just 37.2, bearish MACD, and a range of about 10.99%. Both are below their moving averages, with weak momentum. By contrast, $U is trading at 1.0007, with MA5=1.00064 above MA20=1.
post-image
SOL-0.67%
APT-5.28%
Most people are focused on a tariff breakthrough. I think the market will drop first. The court has ruled, but the tariff agenda isn’t dead—it’s just lost its easiest path. After doing this for so long, I know position sizing is always more important than calling direction. Let’s compare notes this weekend.
post-image
#日韩股集体大跌
KOSPI +3.3%: A relief bounce or the start of a recovery?
My initial assessment: This appears to be a potential relief rally; however, a single strong session is not enough to confirm a broader recovery. The key question is whether semiconductor stocks can sustain this rebound following the sharp sell-off, or if the gains are merely driven by short covering and bargain hunting.
The gains seen in Samsung Electronics (+3.6%) and SK Hynix (+3.4%) are particularly significant, as the South Korean market is highly sensitive to semiconductor sentiment and the global AI-memory trade.
What is
post-image
ybaser
#日韩股集体大跌
KOSPI +3.3%: A relief bounce or the start of a recovery?
My initial assessment: This appears to be a potential relief rally; however, a single strong session is not enough to confirm a broader recovery. The key question is whether semiconductor stocks can sustain this rebound following the sharp sell-off, or if the gains are merely driven by short covering and bargain hunting.
The gains seen in Samsung Electronics (+3.6%) and SK Hynix (+3.4%) are particularly significant, as the South Korean market is highly sensitive to semiconductor sentiment and the global AI-memory trade.
What is driving the recovery?
1. The sell-off may have overshot the fundamentals
On October 15, the KOSPI fell by 7.57%, closing at a six-month low following seven consecutive days of losses. During this sell-off, Samsung and SK Hynix lost 23.9% and 31.5% of their value, respectively—creating an opening for bargain hunters to return.
2. Memory chip fundamentals remain supportive
Analysts continue to highlight tight memory supply, robust demand related to artificial intelligence, and expectations for rising DRAM prices. This supports the view that the sell-off was driven more by sentiment and positioning than by a collapse in earnings expectations.
3. Global risk appetite has improved
A recovery in U.S. equities, combined with easing concerns regarding AI-related credit risks, has helped fuel a rebound in Asian technology stocks. However, concerns regarding returns on investment in artificial intelligence, financing costs, and interest rates have not dissipated.
A relief rally or a sustainable recovery?
Bullish scenario — a lasting recovery
* The KOSPI remains above its recent low.
* Samsung and SK Hynix continue their recovery.
* Foreign investors return as net buyers.
* Earnings forecasts and expectations for memory chip prices remain robust.
Bearish scenario — a short-lived rebound
* The index rises toward a resistance level and then reverses.
* Foreign investors continue to sell Korean stocks.
* U.S. bond yields rise, or renewed concerns regarding AI valuations weigh on chip stocks.
* Samsung and SK Hynix fall back below their recovery levels.
What should investors watch for next?
The most critical indicator is not the magnitude of the initial rebound, but whether buying pressure is sustained.
Indicator Bullish interpretation
Foreign investor flows Consistent net buying
Samsung and SK Hynix Gains sustained over several sessions
Memory chip pricing Continued strength in DRAM and HBM
U.S. Treasury yields Stabilization or decline
Earnings expectations Maintenance of upward revisions
A key distinction: On October 16, the KOSPI recorded an intraday gain of up to 3.17%, but closed the day up 2.05% at 5,668.05. Consequently, the sharp intraday rally made the final gain at the close appear more significant than it actually was.
My View
Short-term: Cautiously optimistic
A recovery is possible.
Oversold conditions and attractive entry points could support further gains, though volatility is likely to remain high.
Medium-term: Conditional
Not yet confirmed.
A more substantial recovery would require the stabilization of foreign investor inflows, supportive earnings data, and a more durable improvement in sentiment toward the global technology market.
In summary: I view the 3.3% move not as proof that the downtrend has ended, but as a promising first step. Earnings expectations for the semiconductor sector provide a firmer foundation for this recovery—moving it beyond a mere technical rebound—but the market must demonstrate that buyers are willing to hold their positions, even amidst renewed volatility.
A key factor to watch in the near term will be the earnings outlooks from SK Hynix and Samsung Electronics, set to be released on October 28 and October 29, respectively. These reports could prove decisive in determining whether the recent sell-off was an overreaction or if it reflects a more fundamental reassessment of the AI-driven memory market.
$MU ‌
$SNDK ‌$NVDA ‌
repost-content-media
  • 3
Load More

Join 40 M users in our growing community

⚡️ Join 40 M users in the crypto craze discussion

💬 Engage with your favorite top creators

👍 See what interests you

Trending Topics

USSeptemberPPIBeatsExpectations

91.35k Views1.93k Discussing

US September PPI came in at 6.3% YoY, well above the 5.3% market expectation, pointing to renewed producer-side inflation pressure. Weekly jobless claims were 199K, broadly in line with forecasts. Could hotter inflation further reduce room for rate cuts, and what does it mean for $BTC, US stocks, and gold?

GateWCTCS9GlobalTradingCompetition

37.87k Views6.68k Discussing

GateBTCAndETHFuturesVolumeRanksTop3

53.8k Views1.82k Discussing

View More