Square
Following
Hot
News
Profile
Share your thoughts
placeholder
Article
$TRUMP : FROM -98% CRASH TO A POTENTIAL MASSIVE REVERSAL?
I WAS BEARISH SINCE JAN 2025. I called the $60–$70 EXIT zone. After reaching $79, #TRUMP crashed 98.29%. I NEVER told you to buy.
NOW, my SMC analysis shows a bullish flip + CHoCH!
Accumulation Zone: $1.80–$1.46
Targets: $5 → $10 → $20 → $45
SL: HTF close below $1.35
I'm DCAing small quantities gradually. Bullish bias activated!
Leverage: Accordingly | NFA & DYOR
post-image
TRUMP-3.97%
  • 1
Juventus started their UEL run with a 5-0 win
They’re winning this one too
2.18 looks too good
post-image
Analysis crypto market
live-cover
LIVE2,998
Action is heating up on $BNB at 721.36 dollars following a 2.852 percent pullback from the 745.33 dollar peak. Markets are volatile with a 708.64 dollar low providing the floor for today. 📉 Keep your eyes glued to the tape right now. 🎯 Execution speed is everything at this exact juncture. ⚡️ Long setup: entry 721.36, stop loss 699.72, take profit 757.43. Short setup: entry 721.36, stop loss 743.0, take profit 685.29. This is not a prediction. Not financial advice. DYOR. #GateIdleEarnAutoYieldUpTo3% #GateLaunchesTrenchesWith0GasFee #ShareWeekly #WeekendMarketBullishOrBearish
post-image
BNB-3.07%
$UNI , there's one thing to say.
It will be listed for CME futures trading on October 19. Just five days left.
It sounds like institutions will have another legitimate channel to buy it, which seems great. But seasoned traders should have a reflexive reaction to the words “going live”—when did this rally start? Scroll up and look: the long trendline overhead had capped it for five years, with the highs of the previous two bull markets all lined up along it, and it was only just broken. My first reaction was, bullish. My second was, the people who broke through that line were waiting for exactly
post-image
UNI-4.97%
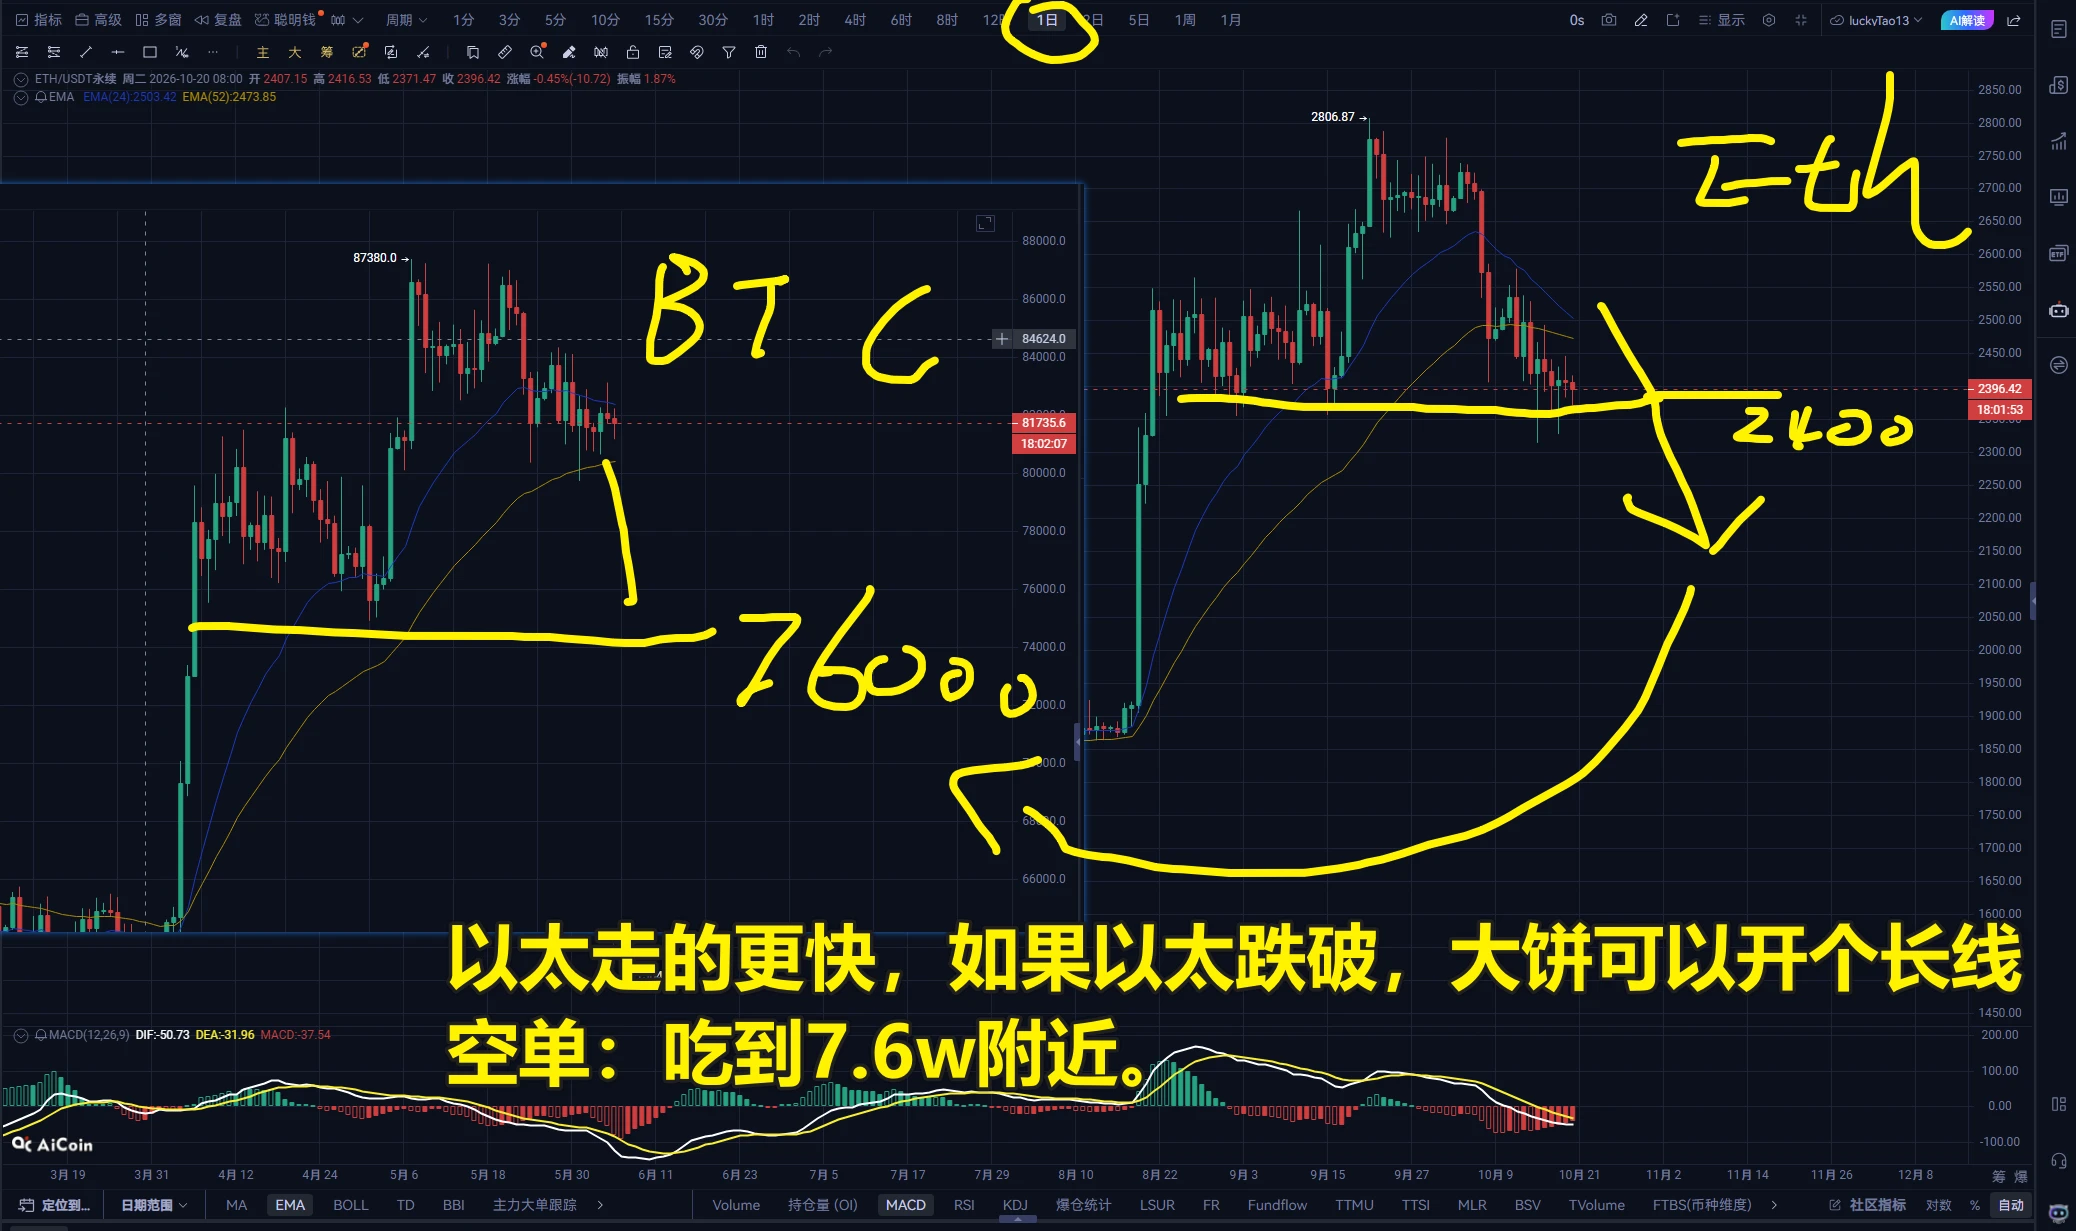
Ethereum ABC Elliot wave correction completed and forming a bullish divergance?
ethereum:native
post-image
ETH-5.42%
PPI data - tonight. BTC / ETH Market Updates
live-cover
LIVE3,055
During the countdown to the midterm elections, an unexpectedly high inflation reading has become a major political liability weighing on Trump and the Republican Party.
U.S. prices surged again in September, with energy costs soaring: gasoline rose 9.1% in a single month and more than 34% year over year, while heating oil jumped 74% year over year. Living costs, which have remained elevated since the pandemic, continued to worsen amid tariffs and the conflict with Iran, fueling voter anger.
Rent prices, which had previously begun to cool, unexpectedly rebounded as businesses passed on costs an
post-image
GAS-2.82%
Just to back my thoughts at the moment
Below is showing every PPI result & what the price of $BTC was at the time
What do you notice?
The shaded area is the Iran war !
I’m still bullish here
post-image
BTC-3.04%
If I could leave $SOXLB just one comment today, it would be: don’t let -19.65% make the decision for you.
What’s really worth discussing is that $SOXLB is oversold, but a confirmed bottom still requires a stabilization. $SOXLB is currently at 100.98, down -19.65% over 24 hours. The 1-hour support is 99.12, resistance is 121.19, and current volume is 0.17 times the average volume of the past 20 candles.
The 1-hour trend is weak, with RSI at 34; the 4-hour trend is weak, with RSI at 24. This combination makes me temporarily accept the following interpretation: I treat oversold conditions only a
post-image
Tonight’s PPI release—I’m less interested in “how much further inflation has fallen” than in whether U.S. stocks are actually willing to buy into it.
If PPI cools broadly, pressure on the market’s expectations for the subsequent interest-rate path will ease somewhat, which would of course be more favorable for long-duration, high-valuation assets like $NVDA and $AMD ; but if core components remain hot, or if the decline in the data actually reflects weak demand, tech stocks may not be able to comfortably benefit from the “cooling inflation” tailwind.
Macro trading can be this awkward sometimes
post-image
NVDA-3.75%
AMD-7.11%
GLDX+1.12%
PAXG+0.97%
XAU+1.19%
📊 Golden Finance | What is PPI? What should you do?
1️⃣ PPI = Producer Price Index, measuring changes in costs on the factory and business production side 2️⃣ Simply put: CPI is “whether things are more expensive for you to buy,” while PPI is “whether things are more expensive for manufacturers to make” 3️⃣ PPI rises → cost pass-through → CPI follows higher → pressure on the Federal Reserve to raise interest rates intensifies 4️⃣ U.S. September PPI will be released at 20:30 tonight, with the market expecting +0.6% month-on-month; if it exceeds expectations, the probability of rate hikes will
post-image
GLDX+1.12%
PAXG+0.97%
BTC-3.04%
ETH-5.42%
$BLUR Current price is 0.01229. The first resistance above is the Bollinger upper band at 0.01270, while the first support below is MA5 at 0.01242; if it breaks down, support shifts to MA20 at 0.01086. This is a reusable moving-average analysis method: to determine whether a trend is healthy, do not look at how much a single candlestick has risen, but at the moving-average arrangement and the relative position of the price to the moving averages.
Currently, $BLUR ’s MA5=0.01242 is clearly above MA20=0.01086. The short-term moving average is above the long-term moving average and opening upwar
post-image
BLUR+11.02%
EPIC-21.79%
WLFI+0.07%
📊 CPI yesterday, PPI today— inflation has repeatedly exceeded expectations. How will the market respond?
U.S. PPI rose to 6.3% year-on-year in September and increased 1.3% month-on-month, once again surpassing market expectations.
Combined with the previously stronger-than-expected CPI data, inflationary pressure has once again become the market’s focus.
But interestingly, the market has not moved in a single direction:
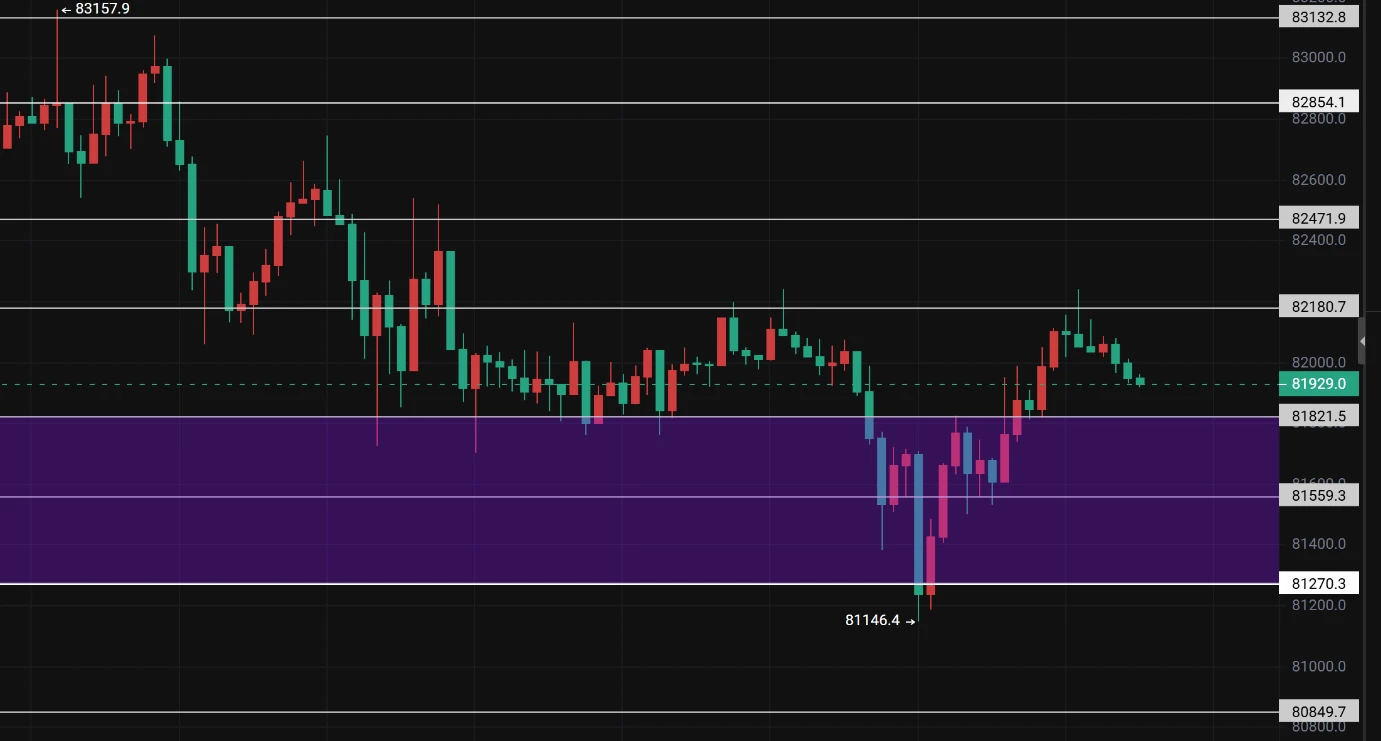
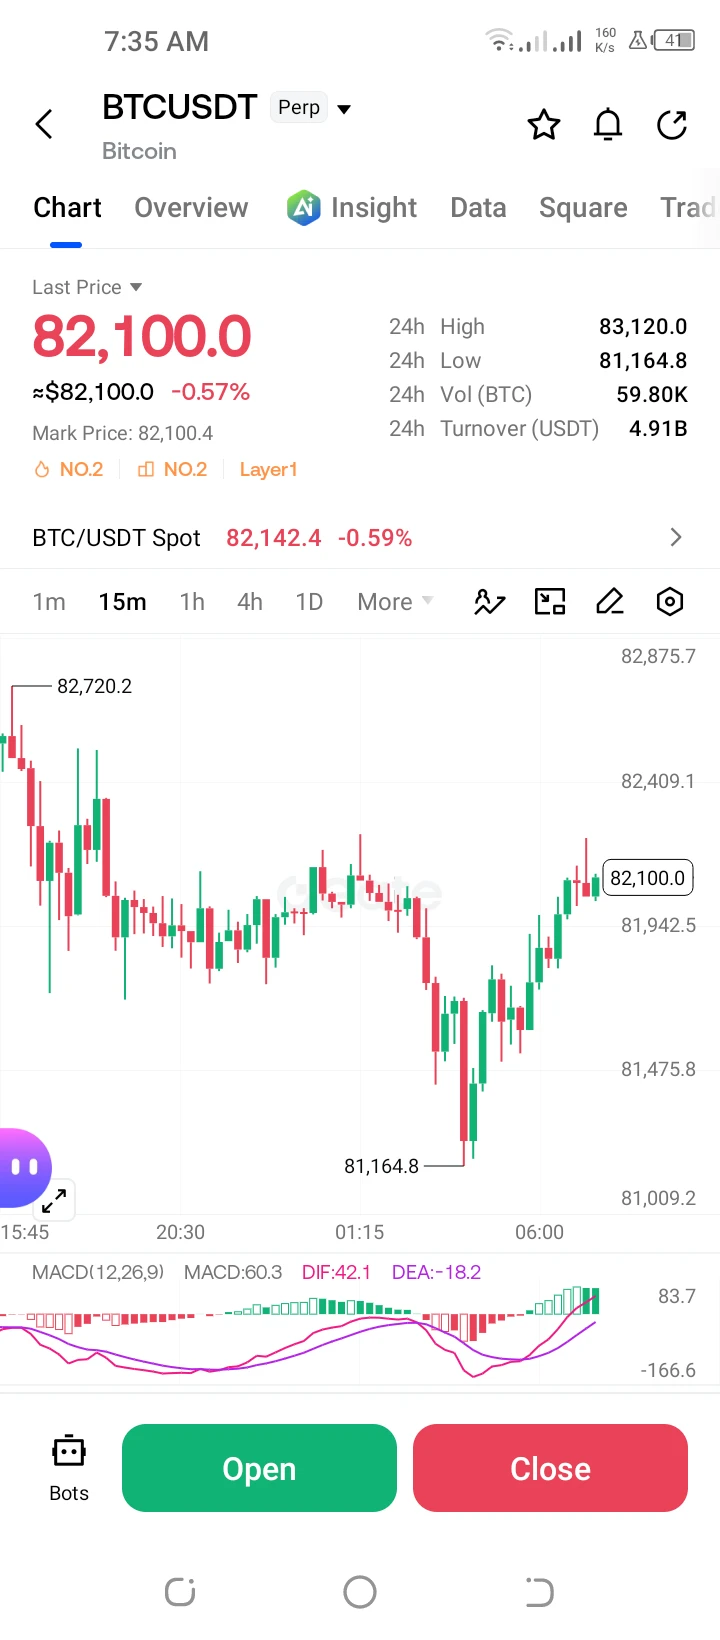
📉 BTC has pulled back to around $80,000, putting bulls to the test
📊 U.S. tech stocks are under pressure as funds begin reassessing risk
🥇 Gold rebounded intraday as safe-h
GateSquare
📊 CPI yesterday, PPI today— inflation has repeatedly exceeded expectations. How will the market respond?
U.S. PPI rose to 6.3% year-on-year in September and increased 1.3% month-on-month, once again surpassing market expectations.
Combined with the previously stronger-than-expected CPI data, inflationary pressure has once again become the market’s focus.
But interestingly, the market has not moved in a single direction:
📉 BTC has pulled back to around $80,000, putting bulls to the test
📊 U.S. tech stocks are under pressure as funds begin reassessing risk
🥇 Gold rebounded intraday as safe-haven demand and interest-rate expectations continue to clash
With inflation continuing to heat up, will the Federal Reserve remain on hold in October?
For traders, more important than correctly guessing the data is knowing how to adjust their strategy after market conditions change.
💬 Are you currently more inclined to reduce positions and seek safety, look for opportunities to buy the dip, or wait for the market to stabilize?
Bring #美国9月PPI大超预期 to Gate Square and share your macro outlook, BTC trend analysis, or real trading activities.
The data is now out; next, it all comes down to which direction the market chooses.
repost-content-media
BTC-3.04%
XAU+1.19%
XAUUSD+1.20%
$GT Continue adding to the position on October 15, 2026, with a cost price of 7.81 and a total quantity of 745. The bot grid trading started this morning has already fallen below the set minimum price and stopped
GT-4.19%
Oct 15 Update:
#Bitcoin ETFs:
1D NetFlow: -3,209 $BTC(-$257.7M)🔴
7D NetFlow: -5,250 $BTC(-$421.57M)🔴
#Ethereum ETFs:
1D NetFlow: -38,915 $ETH(-$91.19M)🔴
7D NetFlow: -133,537 $ETH(-$312.9M)🔴
post-image
BTC-2.25%
ETH-4.31%
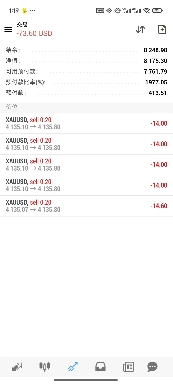
The tone was set from the start: from the European session through the U.S. session jobless claims, the entire move down was projected. I don't deal in empty talk—I gave the strategy in advance; those who followed can count for themselves💰$XAU
XAU+1.19%
#USSeptemberCPITopsEstimates September CPI Tops Estimates, What Does It Mean for Bitcoin and the Crypto Market
The latest US September Consumer Price Index data has drawn attention across financial markets after inflation figures came in above expectations. This development matters because inflation remains one of the most important factors influencing Federal Reserve policy, bond yields, the US dollar, stock market sentiment, and the direction of digital assets.
For crypto traders, CPI is more than an economic headline. It is a key event that can change market expectations within minutes. Wh
BTC-3.04%
ETH-5.42%
USIDX-0.49%
Load More

Join 40 M users in our growing community

⚡️ Join 40 M users in the crypto craze discussion

💬 Engage with your favorite top creators

👍 See what interests you

Trending Topics

USSeptemberPPIBeatsExpectations

91.35k Views1.83k Discussing

US September PPI came in at 6.3% YoY, well above the 5.3% market expectation, pointing to renewed producer-side inflation pressure. Weekly jobless claims were 199K, broadly in line with forecasts. Could hotter inflation further reduce room for rate cuts, and what does it mean for $BTC, US stocks, and gold?

DrLinHanSpeaksAtOxfordUnion

135.63k Views1.86k Discussing

JapanAndKoreaStocksPlunge

47.27k Views1.75k Discussing

View More