


Share your thoughts
placeholder
Article
I wasn’t watching the charts or thinking about it—it was moving on its own, like it was working overtime for me.
With the screen glowing green, $AIOT was still holding above 0.04561, but trading volume had contracted sharply. The overhead resistance was obvious, clearly signaling a weak rebound. While everyone else was trying to catch the rebound, I chose to wait for it to stall before shorting.
Sure enough, it couldn’t hold and slid steadily to 0.04037. The +56.85% profit was secured, and the timing was right. I closed 70% of the position first and moved the stop-loss on the remaining 30% to
post-image
AIOT+1.05%
SOL-2.05%
ETH-0.93%
I just casually hit refresh, and it went up on its own, leaving me in a very passive position😅
When I checked the chart after lunch, $PENDLE had pulled back to around 1.540. Buying support was clearly stronger than in the morning, and the market didn’t look like it was about to dump either. The key level held, which was reason enough, so I followed the move and added another long position.
Who would’ve thought that when I checked again in the evening, the price had already reached 2.225, and this position was showing +3158.38% in floating profit. This was a very satisfying bite of the meat💪
post-image
PENDLE+7.47%
SNDK+1.39%
ADA-1.42%
$PIEVERSE 1 hours ago, whale address 0x8f3c...9a2b just transferred in 4 million tokens at a cost basis of 0.98, with a 28% unrealized profit and no selling. Another address, 0x2b7e...c41d, sold 1.2 million tokens in three transactions yesterday at an average price of 1.15, clearly unloading a break-even position. The current price of 1.2637 is down 4% from the high of 1.3177. Trading volume of 50M looks active, but selling pressure from large orders is significant.
I speak based on on-chain data: this rally was driven by five new wallets accumulating a total of 18 million tokens, concentrated
PIEVERSE+6.67%
I didn’t chase the first bullish candle after the breakout; my first instinct was to worry it was a fake breakout. Only after the pullback held and the second volume-backed move began did I confirm the direction and add to my long position.
After the surge reached near the target, momentum had already stalled. As planned, I first reduced the position by 70%, keeping the remaining 30%. Later, the pullback hit my protective stop, so I exited the entire core position as well.
This long position made one thing clearer to me: entering a little later is nothing to be ashamed of. The key is whether y
post-image
LAB-2.17%
SOL-2.05%
September 8 Strategy Plan
Priority ranking, for followers only
The final priority order I’m giving you today
First priority: High-level short
2500–2511 short
Enter after resistance is confirmed.
Stop-loss: 2518
Targets
2490 → 2480 → 2473 → 2465
Second priority: Low-level long
2472–2478 long
Enter after a bottom is confirmed.
Stop-loss:
2460
Targets:
2488 → 2498 → 2508 → 2511
Third priority: Breakout long
Effective break above 2511 + retest of 2505–2511 holds
Stop-loss:
2495
Targets:
2525 → 2535 → 2548 → 2565
Fourth priority: Breakdown short
Effective break below 2464 + rebound fails to reclaim
post-image
ETH-0.93%
Inbundly brings Google Inbox bundles back to Gmail so similar emails collapse into tidy groups again.
Install the free Chrome extension, then watch promotions, social, and updates nest under one header instead of flooding the top of your inbox.
Miss Inbox? This is the closest open-source comeback.
Everyone is missing the short setup forming right under SYMBOL

$SKYAI /USDT - SHORT

Trade Plan:
Entry: 0.05666 – 0.05704
SL: 0.05863
TP1: 0.05551
TP2: 0.05462
TP3: 0.05329

Why this setup?
Why now? The daily trend is bearish, the 1h price is 0.05685, the 15m RSI is 61.48 and the 1h ATR is 0.000742, which together define an entry zone between 0.05666 and 0.05704. The 1h ATR of 0.000742 sets realistic expectations for volatility, meaning the TP1 target of 0.05551 and TP2 target of 0.05462 are within one ATR move from the entry. The invalidation level at 0.05861 is the line in the sand that
SKYAI-4.93%
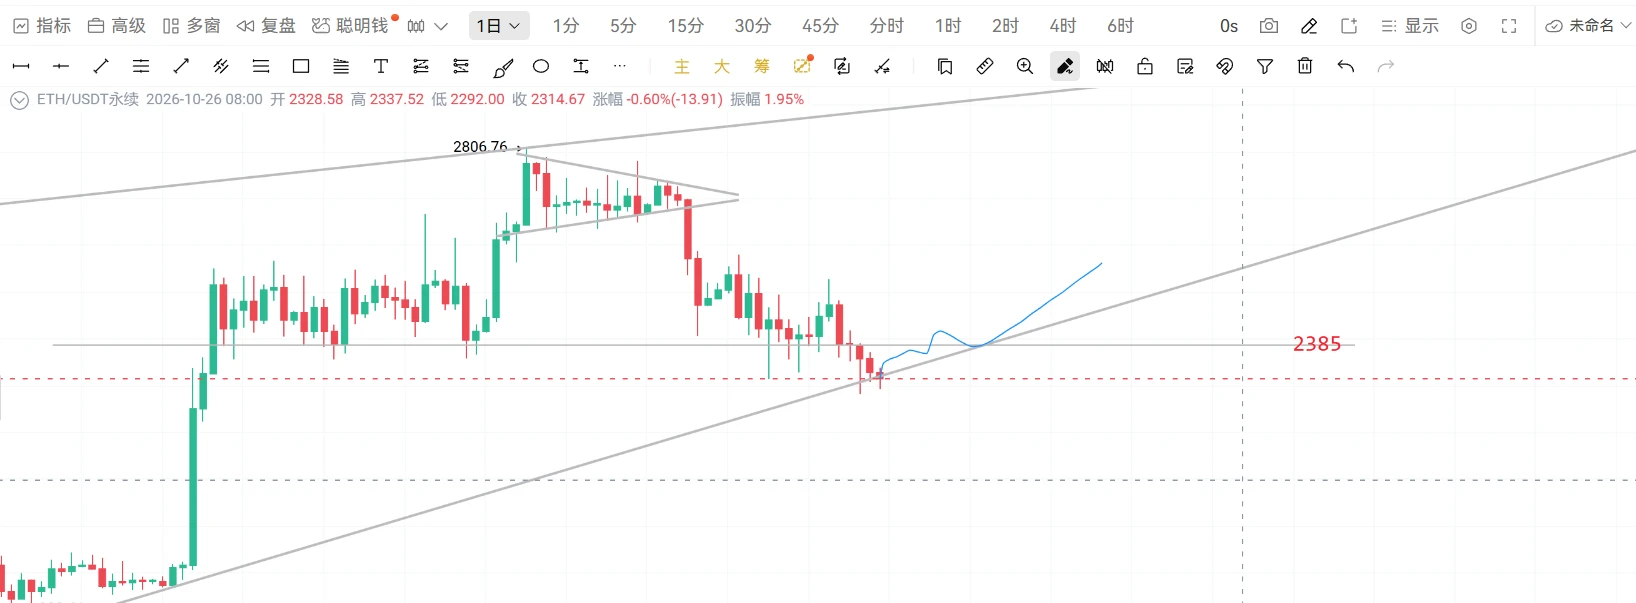
ETH’s intraday long positions from yesterday should be closed.
post-image
ETH-0.87%
Everyone is about to get burned on $LAB /USDT.

$LAB /USDT - SHORT

Trade Plan:
Entry: 0.0697 – 0.0701
SL: 0.0716
TP1: 0.0686
TP2: 0.0677
TP3: 0.0664

Why this setup?
Why now? The 1d trend is bearish and the 4h setup is confirming it with 95% confidence, so the deck is stacked for more downside. The 1h price is sitting at 0.0699, right inside the entry zone of 0.0697 to 0.0701, giving us a clean trigger. The 15m RSI at 50.9 shows the market is neutralizing, not recovering, which means the short can hold. Meanwhile the 1h ATR of 0.000729 tells us the next leg should move the price from the e
LAB-2.17%
9.8 Gold Morning Review

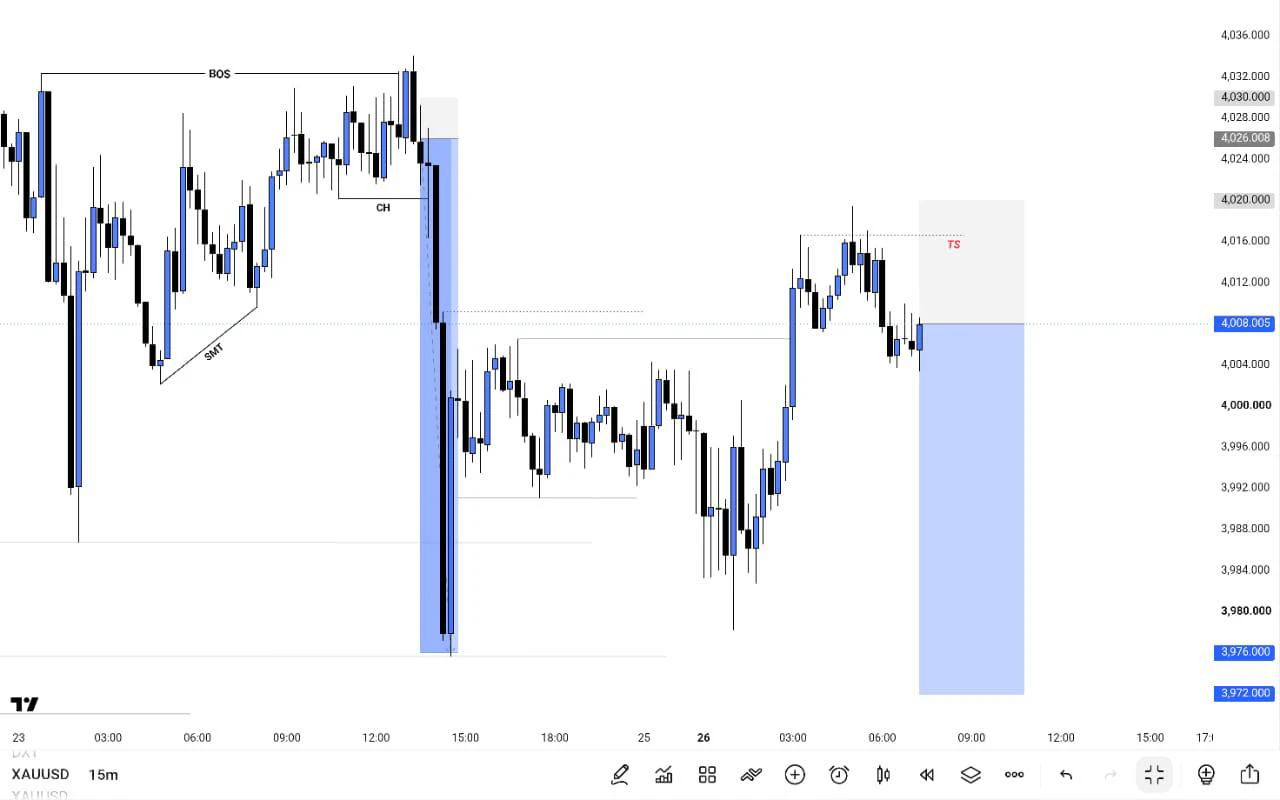
Yesterday at midnight, support was correctly anticipated to hold, and the market maintained range-bound movement. The pace aligned with expectations from the analysis, with the current gold price around 4411.

Technical analysis: The 1-hour Bollinger Bands continue to narrow and flatten, with the gold price oscillating around the middle band; the 30-minute Bollinger Bands are narrowing, the KDJ indicator is turning downward, short-term rebound momentum is weakening, and the market has entered range consolidation. The bearish structure on the larger time frame remains
post-image
GLDX-0.06%
Crypto Market and Trading Insights
live-cover
LIVE1,539
Smart money is quietly building a short position on SYMBOL while retail chases pumps.

$LTC /USDT - SHORT

Trade Plan:
Entry: 55.27 – 55.67
SL: 57.40
TP1: 54.02
TP2: 53.05
TP3: 51.61

Why this setup?
Why now? The daily trend is range-bound, which often precedes a directional breakdown, and the 1h ATR of 0.805067 confirms enough volatility to drive a move into our target zones. The 15m RSI sitting at 52.71 shows the asset is neither overbought nor oversold, leaving room for the downside to unfold. We are watching the 1h price of 55.48 as our reference point, with entries between 55.27 and 55
LTC-0.79%
I didn’t chase when that bullish candle pushed upward with a wick; I didn’t participate from the launch to the high, because before the top of the range breaks out and holds with increased volume, most breakouts are bull traps. Only after the price pulled back and broke down did I add to the short in line with the trend.

The core entry logic was the rapid sell-off after the false breakout. The price fell back inside the range, showing that selling pressure overhead remained heavy. The lower-timeframe bulls’ advances had been blocked at the same level three consecutive times, so chasing longs
post-image
LAB-2.17%
BTC-1.12%
I didn’t expect it to survive—it went straight to breakeven. The service was exceptional.

When it plunged intraday, I stared at the screen thinking: this trade might really be an expensive lesson. But then I noticed funds quietly entering and the pullback holding steady, so I felt it was still missing one final push. Today, it supplied that push itself.

$HUMA is currently at 0.02232, compared with my entry at 0.02133, bringing the paper gain to +118.5%. Those already on board should be waking up laughing—the profits feel great.

The prerequisite for compounding is staying alive; the short
post-image
HUMA-0.22%
BNB-1.57%
DOGE+0.43%
$CNPY has everything it takes to reach $1 or more in the coming days. The airdrop has been released, with no more tokens entering the market until next year. Whales like this. Let’s see how far we can go—$5 by the end of the year, mark my words.
CNPY+66.20%
$ARB may continue to retrace to 0.5 levels of our fib.
We have a bearish engulfing closed today so we expect further downside this week til we hit the lows.
post-image
ARB-11.39%
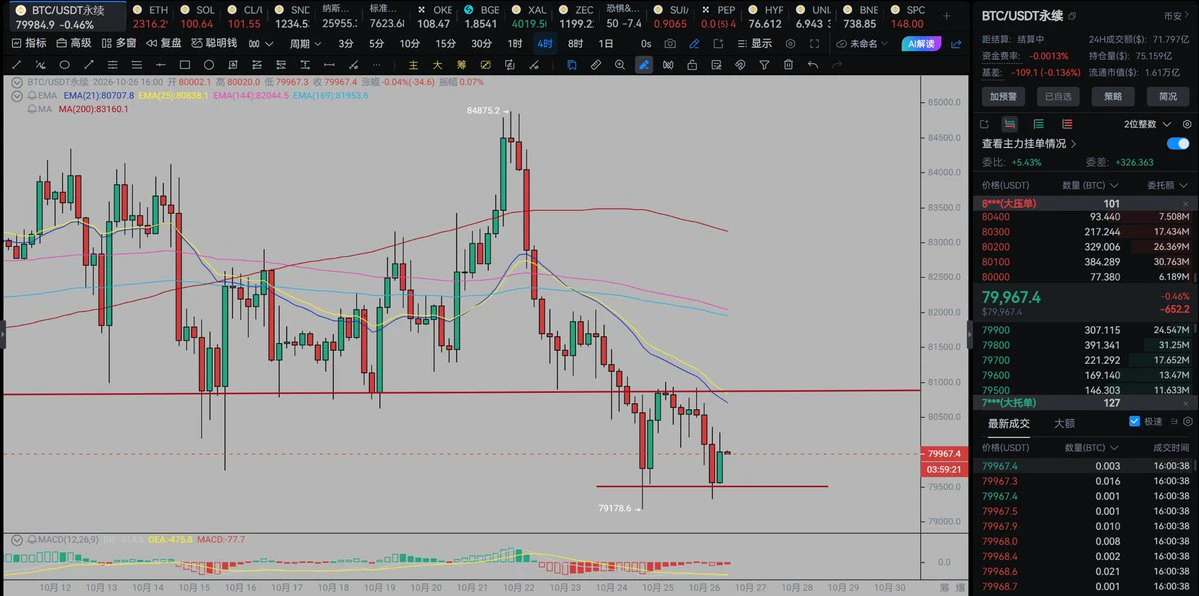
BTC found support and rebounded near 78,600, but why shouldn’t we rush to say it has turned stronger before reclaiming 79,500?
After retreating from around 80,000 over the past two days, BTC found buying support near 78,600 and has now moved back above 79,000.
Seeing the rebound, many people’s first reaction is: the pullback is over, and the market is about to move higher again.
But the easiest thing to misread today is equating a “rebound after finding a floor” directly with a “structural recovery.”
From the one-hour structure, the fact that 78,600 has held for now shows there is buying inter
post-image
BTC-1.12%
🚀 The yen just soared to a six-month high! 📈 Speculation around BOJ interest rates is shaking up the currency market. How will this impact your crypto positions? $JPY $USD #Forex
Layout for Bitcoin, Ethereum, and Dogecoin
live-cover
LIVE1,438
Everyone is missing that WLD is trapped in a range while the smart money sets up a SHORT at 0.4744.

$WLD /USDT - SHORT

Trade Plan:
Entry: 0.4715 – 0.4773
SL: 0.5107
TP1: 0.4471
TP2: 0.4290
TP3: 0.4017

Why this setup?
Why now? The 1h ATR of 0.01165 shows volatility is compressed enough for a sharp move, and the 15m RSI at 67.5 is still climbing, meaning momentum has not yet faded and could push into the entry zone. The daily range pattern keeps price contained until a breakout, and with the 1h price at 0.4744, the SHORT bias can flip the trade quickly. TP1 sits at 0.4471 as the first meas
WLD+15.79%
Load More

Join 40 M users in our growing community

⚡️ Join 40 M users in the crypto craze discussion

💬 Engage with your favorite top creators

👍 See what interests you

View More