
Share your thoughts
placeholder
Article
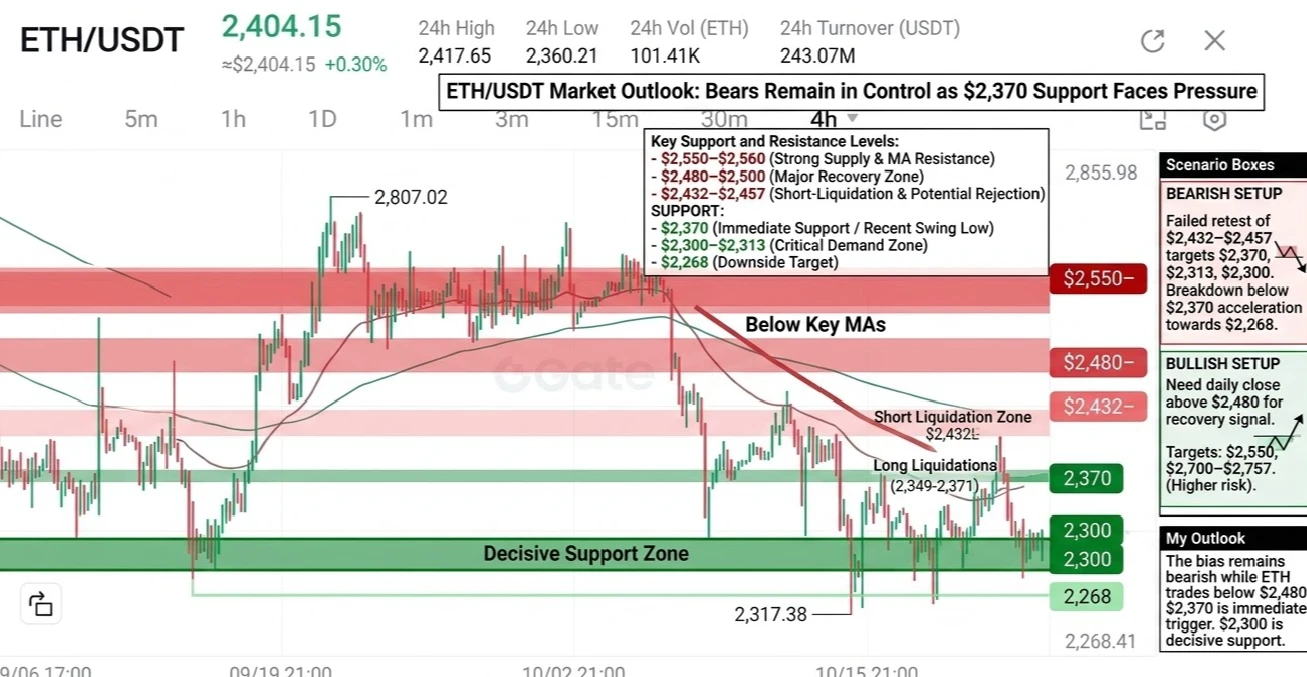
ETH staged an oversold recovery today, triggering technical buying after dipping to an overnight low of 2441, followed by a choppy rebound during the Asian session. It successively reclaimed the 2460 and 2470 levels, reaching as high as around 2486, and is currently at 2480. The rebound is slightly stronger than that of the broader BTC market, but overall it remains a phase of recovery within a bearish trend, with no trend reversal yet. Its high-beta characteristics have amplified the recovery.
After consecutive declines on the daily chart, short-term indicators have entered oversold territory
post-image
ETH-0.47%
BTC-0.92%
Nobody is talking about the quiet move forming inside $NEAR /USDT right now.

$NEAR /USDT - LONG

Trade Plan:
Entry: 2.3123 – 2.3373
SL: 2.2048
TP1: 2.4148
TP2: 2.4749
TP3: 2.5649

Why this setup?
Why now? The daily trend is firmly bullish while the 1h RSI sits at 45.32, meaning momentum is balanced with room to run. The 1h ATR of 0.050019 confirms enough volatility to push from the entry zone at 2.3248 toward the first target at 2.4148. If that level breaks, the structure aims for TP2 at 2.4749, but the real line in the sand is the invalidation level at 2.1070. Anything below that refutes
NEAR-0.62%
OpenAI’s Chief Scientist Warns AI Is Moving Too Fast! Calling for “extreme caution,” is it time to
live-cover
LIVE42
I just got back from the restroom, and my holdings had risen on their own. I placed an order for $HUMA at 0.02133 before bed a few days ago, originally thinking it would take a few days to grind higher. I didn’t expect to open the chart this morning and find the current price already at 0.02229, with an unrealized gain of +111.59%.

It held above support on the pullback, and buying pressure strengthened. I knew someone was about to make a move, so I had the guys follow in directly. The market is waited out, and profits are held out; have a strategy before the market opens, discipline during t
post-image
HUMA-0.40%
ETH-0.48%
ADA-0.36%
JUST IN: New York town weighs a new moratorium extending to crypto mining and AI data centers. If approved, this could slow local mining activity and signal heightened regulatory scrutiny in the sector. $BTC ? (skip ticker since not clearly relevant)
post-image
BTC-0.92%
Everyone is talking about @standard_rsv and trying to digest the whitepaper, but struggling to get through it?
You can break it down easily using a few AI prompts
Here is how to do it:
Just paste the link add the command, and get instant results 👇
>> TL;DR 👉 Get a 2-3 sentence overview
>> Key Takeaways 👉 Extract the top 5 critical points
>> ELI5 👉 Explain the tech like I'm 5
>> Sticky Notes👉Quick, memorable bullet notes
>> Pros & Cons👉Analyze strengths vs weaknesses
>> X Thread👉 Convert the whitepaper into a readable thread
Save this list for your research
post-image
Contrarian insiders are quietly setting up a short on $SKHY /USDT while the 1h price sits at 185.22 and nobody is watching the 15m RSI drop.

$SKHY /USDT - SHORT

Trade Plan:
Entry: 184.66 – 185.78
SL: 190.60
TP1: 181.18
TP2: 178.49
TP3: 174.45

Why this setup?


Debate:
Are we flipping to 190.60 and trapping the shorts, or is 175. Instrument the full move to the 0.60 invalidation level and the trade stays clean?

⚠️ Personal market analysis only. NFA — manage risk and DYOR.
Educational content, not investment advice or a recommendation to buy, sell, deposit, or withdraw any asset. No pa
SKHY+1.99%
I just casually hit refresh, and it went up on its own, leaving me in a very passive position.

While it was grinding along the bottom intraday, the position in my hands was still showing unrealized losses, and I didn’t really do anything. Then $LINK suddenly shot up in a bullish candle, and my account went straight from sea-green to bright red. Who could handle this experience?

My brain hasn’t caught up yet, but I’ve held the position all the way from 11.834, and it’s now at 12.515. I did a quick calculation, and the return is +385.8%. It’s okay if you can’t understand the market; what mat
post-image
LINK-2.15%
ADA-0.36%
BNB+1.55%
I wasn’t even expecting to break even, but it actually took me straight into profit. This service is incredibly on point. While everyone else was running, I kept my eyes on $BNB at 641.25.
The key level held—grinding along the bottom without breaking down. I said buying pressure was getting stronger and that it was worth watching. Then, during the intraday plunge, it broke first and reclaimed the level, surging straight to 750.9, +1213.05%. Nailed it—this time, the wait really paid off.
The prerequisite for compounding is staying alive; the shortcut to getting rich overnight is often going to
post-image
BNB+1.55%
LAB-2.15%
DOGE-1.08%
A wick-based pullback was triggered this morning. Once that lower shadow appeared, I noticed an opportunity to go long, and the price gradually stabilized afterward, which served as validation of my judgment. After entering, no particularly rapid trend emerged; instead, the price mainly maintained a stair-step rise. This pace is actually more reliable than a sharp rally, because every upward move has a key level where positions change hands.

My buy orders were completed within the long-entry range. Afterward, I observed that the positions on the order book had not loosened noticeably, so I f
post-image
ETH-0.48%
XRP+1.29%
SNDK Strategy

Current price: 1741, with a clear pullback over the past 24 hours; short-term long-short battle intensifying.

After surging at the four-hour level, the price came under pressure and pulled back, moving toward the moving averages. The upper Bollinger Band is creating resistance, the MACD red bars are gradually shrinking, upward momentum is weakening, and the RSI has turned downward from high levels. Although there has been no complete reversal overall, short-term pullback signals have emerged, so chasing longs at high levels is not advisable.

Wait for a rebound into the 1750
post-image
SNDK-2.31%
When bro keeps talking about relationships instead of
ways to make more money.
post-image
This isn't a rebound; it's a tube inserted into an account that was about to snap. As the market was grinding out an intraday bottom, $SOL kept probing around 75.33, holding firm on every pullback, with buying clearly stronger than in previous days. I judged this to be the end of the shakeout and opened a long position to test the waters.
It then surged straight to 103.24, taking the return to +3446.54%. With the timing nailed, everyone aboard should be smiling.
I first closed out part of the position at +3446.54%, pocketing the profit. For the remaining 46%, I moved the stop-loss to the entry
post-image
SOL-1.01%
SNDK-2.31%
XRP+1.29%
Insiders are quietly stacking shorts on SYMBOL while the range holds.

$BNB /USDT - SHORT

Trade Plan:
Entry: 748.7 – 751.5
SL: 763.5
TP1: 740.1
TP2: 733.4
TP3: 723.3

Why this setup?
Why now? The 1h price is pinned at 750.0 inside a tight 1h ATR of 5.58, which means a break from 751.5 will likely accelerate fast. The 15m RSI sits at 48.91, showing just enough bearish lean to confirm momentum is not flipping bullish. The daily trend is range, so this short is a fade against the upper edge of the range at 751.5, targeting TP1 at 740.1 and TP2 at 733.4. The invalidation level at 734.8 is the
BNB+1.55%
Id this was any meme chart would you be bullish?
post-image
MEME+0.28%
XRP is range-bound daily but the 1h setup hints at a hidden move.

$XRP /USDT - SHORT

Trade Plan:
Entry: 1.4140 – 1.4212
SL: 1.4520
TP1: 1.3918
TP2: 1.3746
TP3: 1.3487

Why this setup?
Why now? The daily trend is a range, so the real edge comes from the 1h window where the 15m RSI sits at 48.1, showing neither overbought nor oversold exhaustion. The 1h ATR of 0.014347 quantifies the current volatility, defining the risk per unit as the price rotates. The entry zone between 1.4140 and 1.4212 aligns with the 1h price at 1.4176, offering a precise trigger for a short bias. Targets sit at 1.39
XRP+1.29%
Do not chase $DOGE /USDT lower or you will get crushed

$DOGE /USDT - SHORT

Trade Plan:
Entry: 0.08919 – 0.08973
SL: 0.09202
TP1: 0.08754
TP2: 0.08626
TP3: 0.08435

Why this setup?
Why now? The 1h price sits at 0.08945, barely inside the entry zone of 0.08919 to 0.08973, which signals a precise trigger for the short bias. The 15m RSI reading of 46.52 shows momentum is neutral but tilts bearish enough to justify a countertrend move against the range-bound daily trend. The 1h ATR of 0.001065 confirms that a single candle can easily cover the distance to TP1 at 0.08754 and extend toward TP2 a
DOGE-1.08%
10x Leverage vs Spot - Best for Beginners
live-cover
LIVE49
Why is everyone suddenly calling XRP a range-bound trap?

$XRP /USDT - SHORT

Trade Plan:
Entry: 1.4133 – 1.4205
SL: 1.4515
TP1: 1.3909
TP2: 1.3736
TP3: 1.3476

Why this setup?
Why now? The 1h price is sitting at 1.4169 inside the entry zone of 1.4133 to 1.4205, which means the market is resting right on the boundary before a move. The 15m RSI at 53.61 shows neither overbought nor oversold, so a directional break is overdue. The 1h ATR of 0.014428 tells us the average hourly swing is small, implying a squeeze is building. If the daily trend is range-bound and price holds above 1.4124, the s
XRP+1.29%
XRP is trapped in a range, but the 1h setup hints at a sharp move down.

$XRP /USDT - SHORT

Trade Plan:
Entry: 1.4173 – 1.4245
SL: 1.4555
TP1: 1.3949
TP2: 1.3776
TP3: 1.3516

Why this setup?
Why now? The 1h price sits at 1.4209, right inside a narrow entry zone between 1.4173 and 1.4245, which keeps risk tight. The 15m RSI reading of 53.61 shows no overbought exhaustion, so the short bias lacks a natural reversal trigger yet. The 1h ATR of 0.014428 quantifies the current volatility, meaning a break below 1.4124 would likely unleash a move toward the first target at 1.3949. If that 1.3949 l
XRP+1.29%
Load More

Join 40 M users in our growing community

⚡️ Join 40 M users in the crypto craze discussion

💬 Engage with your favorite top creators

👍 See what interests you