Square
Following
Hot
News
Profile
Share your thoughts
placeholder
Article
🔹A Huge Earnings Week Is Here! Jensen Huang Takes the Stage at GTC as Meta and Tesla Report Earning
live-cover
LIVE2,044
While a woman is pregnant, no one—not even a court—is allowed to grant a divorce.
Unless there’s one situation where the law doesn’t protect the woman: the child she gives birth to isn’t her husband’s 🫣
post-image
Trenches
TSI
T
bade
b
TSI
0xa8...1c1e
Market Cap
$.
Change
.
24h Vol
$.
Holders
.
CNPY
C
bade
b
CNPY
0xc6...ddd2
Market Cap
$.
Change
.
24h Vol
$.
Holders
.
AGT
A
bade
b
AGT
0x5d...e274
Market Cap
$.
Change
.
24h Vol
$.
Holders
.
BOOMER
B
bade
b
BOOMER
0x5a...5c00
Market Cap
$.
Change
.
24h Vol
$.
Holders
.
PIERRE
P
bade
b
PIERRE
D3S6...pump
Market Cap
$.
Change
.
24h Vol
$.
Holders
.
#资产分析 https://www.gate.com/wallet/assetsAnalysis is still consistently profitable. I’ve opened a new copy-trading account named “Julaibao.” Those of you copying my trades can switch to that account. I’ll focus more seriously on every trade there and do my best to help everyone make money. Thank you for your trust and support!!!
  • 1
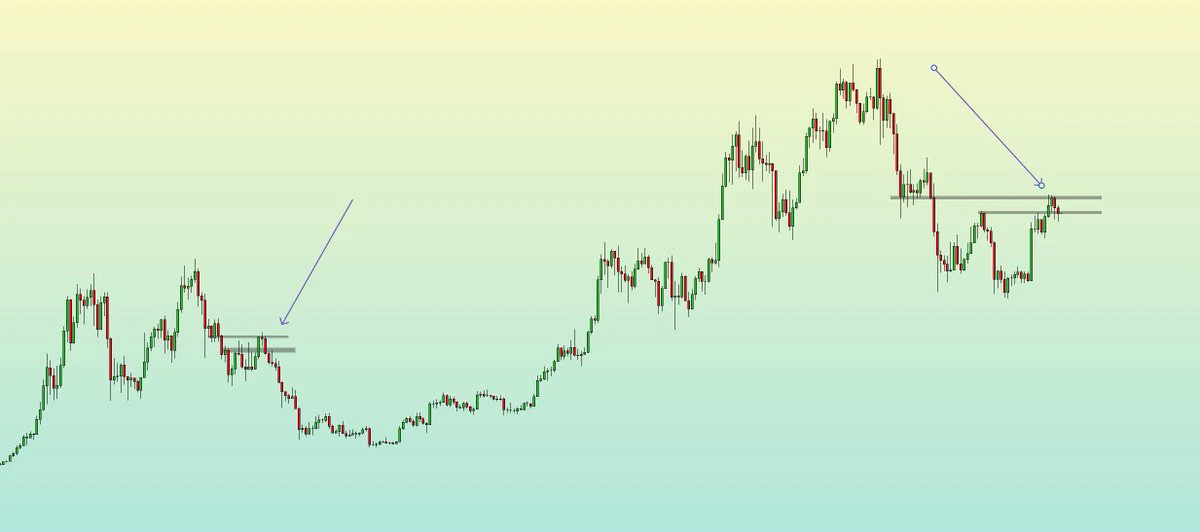
Currently, $BTC ’s weekly K-line structure looks very similar to that in March 2022.
A confirmation candlestick for a false breakout is still missing. For now, we can only make a blind bet on either direction, with a higher probability of a move downward.
post-image
BTC+0.76%
🔥Semiconductors stage a major deep-V reversal! Is this a desperate comeback or a bull trap set by the big players? Candlesticks show sentiment; capital flows reveal the real story. A rally without financial backing is usually a bear's comfort zone. Nasdaq futures are up nearly 1%, lifting SNDK, SKHYNIX, and KORU in lockstep into deep Vs on the hourly charts, with MACD bullish crossovers amid bottom divergences—a highly tempting setup. But don't get carried away!
Look at the capital flow chart: SKHYNIX has a flow score of -100, indicating “strong outflows,” with an inflow share of 0%; KORU and
SNDK+5.20%
SKHYNIX+3.29%
KORU+12.02%
🌐 ONEA NETWORK—Without trust, connections have limits.
The digital economy enables people to connect across geographic boundaries with different people, services, and opportunities.
But as digital interactions become more widespread, one factor is also becoming increasingly important: trust.
People need confidence in the services they use, the transactions they make, and the systems that underpin their digital lives.
Convenience can attract attention.
Trust helps relationships grow over the long term.
🔗 Why does trust matter so much?
An interconnected digital ecosystem needs more than fast t
post-image
#GateWCTCS9GlobalTradingCompetition Gate WCTC S9 Global Trading Competition: A New Challenge for Traders Worldwide
The global trading arena is getting more competitive as Gate launches WCTC S9, bringing together traders across cryptocurrency, stocks, ETFs, futures, and other financial markets. With a headline prize pool of up to 6,000,000 USDT, this competition is designed to reward trading activity, teamwork, and performance across multiple markets.
But WCTC S9 is about more than a large prize pool. It also highlights how modern trading platforms are expanding beyond crypto-only markets, givi
post-image
BTC+0.76%
ETH+0.16%
  • 6
BTC selling pressure from near-peak buyers is easing
Over the past 30 days, approximately 205,400 BTC held for 6–12 months moved, but only 4.4% was sent to exchanges.
Notably, the proportion of BTC transferred to exchanges fell sharply from 40.4% in June to just 4.4% in October. This is a fairly positive signal, indicating that investors who bought near the 2025 peak are creating less selling pressure than before.
• 17/6: 40.4%
• 17/7: 30.9%
• 16/8: 9.8%
• 15/9: 3.7%
• 15/10: 4.4%
According to IT Tech, potential selling pressure has declined significantly. However, fewer sellers do not nec
post-image
BTC+0.76%
The big 💊 is coming: 7 tokens worth over $100 million will unlock this week
LayerZero (ZRO) will unlock approximately 23.28 million tokens at 7 p.m. on October 20, about 3.83% of its circulating supply, worth approximately $43.3 million;
Kaito (KAITO) will unlock approximately 17.6 million tokens at 8 p.m. on October 20, about 3.69% of its circulating supply, worth approximately $5 million;
SOON (SOON) will unlock approximately 20.24 million tokens at 4:30 p.m. on October 23, about 3.50% of its circulating supply, worth approximately $6.3 million;
SoSoValue (SOSO) will unlock approximately 23
post-image
ZRO+0.82%
XPL-0.98%
H+1.48%
  • 1
🔥 Tesla’s new car ignites buzz; team up with one click to position in hot U.S. stocks
🚀 Gate Contract Mix: 4 ways to play, easy to get started
🔥 Try it now—update the Gate App to V8.40.0
🎁 The first Contract Mix Trading Competition is now live
🏆 Team up and share the 20,000 USDT prize pool
👉 https://gate.onelink.me/7pdk/9d3ee318563e5477
👉 https://www.gate.com/announcements/article/102252
BotsOfficial
🔥 Tesla’s new car ignites buzz; team up with one click to position in hot U.S. stocks
🚀 Gate Contract Mix: 4 ways to play, easy to get started
🔥 Try it now—update the Gate App to V8.40.0
🎁 The first Contract Mix Trading Competition is now live
🏆 Team up and share the 20,000 USDT prize pool
👉 https://gate.onelink.me/7pdk/9d3ee318563e5477
👉 https://www.gate.com/announcements/article/102252
repost-content-media
TSLA-2.17%
  • 2
#美股存储板块跌幅扩大 The Nature of the U.S. Tech Pullback Is Shifting: From Valuation Repricing to Credit-Chain Repricing
Many people are still viewing U.S. stocks through the old “AI pullback = buying opportunity” playbook. But if you only watch the Nasdaq and the Philadelphia Semiconductor Index, you may miss the most important change:
July was “AI valuation/positioning repricing”; October is a triple hit from “the AI credit chain + high interest rates + geopolitics/oil prices.” The latter is closer to a “credit-side preview” of the bursting of the 2000 internet bubble, but we’re not yet in a full-bl
Falcon_Official
#美股存储板块跌幅扩大 The Nature of the U.S. Tech Pullback Is Shifting: From Valuation Repricing to Credit-Chain Repricing
Many people are still viewing U.S. stocks through the old “AI pullback = buying opportunity” playbook. But if you only watch the Nasdaq and the Philadelphia Semiconductor Index, you may miss the most important change:
July was “AI valuation/positioning repricing”; October is a triple hit from “the AI credit chain + high interest rates + geopolitics/oil prices.” The latter is closer to a “credit-side preview” of the bursting of the 2000 internet bubble, but we’re not yet in a full-blown bear market.
I. July pullback: Expensive, crowded, but no blowup!
Trigger: Google/Meta/Tesla raised CAPEX forecasts, FCF turned negative, and the market asked, “When will AI spending pay off?”
QQQ fell from a June high of ~$748.65 to a July 29 low of $661.14, a peak-to-trough decline of 11.7%; QQQ fell 6.5% for the full month of July, and SOXX fell 21%.
The 10-year Treasury yield was at 4.6–4.75%; the VIX spiked to 20.66 on a weekly basis (+24%), but the broad VIX did not stay above 22. VXN reached 26, but there was no panic spike.
The S&P edged down, while equal-weight stocks rose; money rotated within equities (tech → Dow/healthcare/consumer). Bonds didn’t rally, and yields rose → this wasn’t a flight to safety, but “semiconductors are too crowded, trim them first.”
Outcome: The 200-day moving average at $645 held, and stocks recovered after August. This was a correction that could be bought.
II. October pullback: From “valuation” to “who can’t repay their loans?”
The logic behind this tech pullback since October is more like:
Borrow at a 15% cost to build compute capacity → rental income can’t cover interest → credit cracks appear first → semiconductor order expectations get cut → quite a few sell-side firms are using the 2000 internet bubble as a reference (the Nasdaq crashed, while long-bond yields fell from 6.5% to the mid-4% range).
Market action: It’s not a broad selloff; “highly leveraged growth + AI infrastructure” are being singled out for punishment. From 10/14–10/16, the Dow rose 0.67% for the week, XLV/energy were strong, the SPX fell ~1.95% for the week, and the Nasdaq fell 4.48% for the week (its worst since June); the Philadelphia Semiconductor Index (SOX) fell for 8 straight days (the longest streak since 2008);
Among individual stocks: CRWV fell 25% for the week, CDS breached 1000bp, and its 5-year default probability was priced at 60%+.
The 10-year Treasury yield fell from 5.3% to 5.07–5.19%, but this was a safe-haven decline as stocks fell and money fled into Treasuries, not a central-bank rescue; the VIX broke above 22, Brent crude topped 110, and tensions in the Middle East and Russia-Ukraine escalated.
Investor sentiment: the CNN Fear & Greed Index fell to 18, but it’s not yet at the extreme “2–4” levels seen in 2018/2020—meaning the market is shifting from “uncomfortably expensive” to “a little worried about credit,” but this is not a COVID-style liquidity collapse.
III. How have similar “credit-side + tech selloff” pullbacks played out historically?
The 2000 internet bubble burst: The Nasdaq was cut in half, then cut in half again from its peak, while the S&P lagged; valuations were hit first, then earnings, then credit, and bonds ultimately entered a bull market. The difference today: major tech issuers aren’t pure concepts; their cash flows/cloud revenues are real. So this isn’t a repeat of 2000, but “the 2000 credit playbook + the 2022 interest-rate playbook.”
The 2022 rate-driven growth selloff: The 10-year Treasury yield surged from 1.5% to 4.3%, QQQ fell 35% from its peak, and SPY fell 25%; the core issue was the “discount rate,” not credit defaults. The 10-year Treasury yield is now above 5%; megacaps are hurting, but banks/consumer/healthcare haven’t collapsed.
2018 Q4 deleveraging: The VIX spiked to 35, QQQ fell about 20% for the quarter, and stocks made a V-shaped recovery after the Fed turned dovish; the Fed isn’t as hawkish now, but inflation + oil prices mean it can’t turn dovish freely.
March 2020 liquidity black hole: The VIX hit 80, and stocks, bonds, and gold all fell together, with the Fed providing a backstop; there’s no COVID-style liquidity freeze now, and CRWV is an individual credit event, not a market-wide counterparty crisis.
Historical rules of thumb
“VIX above 20 + 10-year Treasury yield rising + tech leading declines” → usually the middle of a pullback, not the bottom.
“VIX plateauing at high levels + 10-year Treasury yield starting to fall + semiconductors no longer making new lows” → only then is it a signal to add to QQQ.
Until credit events (CDS widening, high-yield bond spreads widening) stabilize, every QQQ rebound is prone to being sold.
Historical timing reference: the July pullback took 3–5 weeks to recover; with an October-style “credit + rates + geopolitics” combination, a bottom usually isn’t in until the VIX returns to 16–18, CRWV bonds stop falling, and SOXX posts a high-volume candle without making a new low. This often takes 3–8 weeks; if credit spreads widen to Oracle/major tech bonds, it can drag on for a quarter.
IV. The counterintuitive point during earnings season: stock prices are falling, but earnings haven’t collapsed. In the first week of the new 26Q3 earnings season, about 9% of large S&P 500 companies had reported earnings. Stock prices are falling, but earnings haven’t collapsed—the declines reflect “discount rates + credit expectations,” not “current results.”
Companies that have reported: earnings up 29% year over year, revenue up 12.6%;
26Q1 earnings up 28.6%, 26Q2 up 50.4% → the strongest earnings cycle since 2021Q2;
Market pricing for full-year 2026: earnings up 32.8%, revenue up 12.7%;
Q3/Q4 earnings expectations: +29% / +28.6%;
The S&P’s forward P/E is 19.0: below the 10-year average of 19.1 and the 5-year average of 19.8.
This isn’t an “earnings collapse”; the market is getting ahead of three fears:
① AI CAPEX returns in 2027 will fall short of expectations;
② 10-year Treasury yields at 5%+ will discount long-duration assets;
③ AI credit-chain players like CoreWeave will blow up first.
So this is neither 2000 (earnings fraud/disappearance) nor 2022 (earnings downgrades + interest-rate battering). It’s “earnings are very strong, but valuation logic is being repriced for credit risk.”
V. Why is the week of October 19–23 a turning point?
This isn’t an ordinary earnings week. It’s a week to “use real-economy cash flows to rescue tech valuations.”
1) Wednesday’s two pillars: META + TSLA
What to watch for in META:
Will CAPEX be revised higher again, how are advertising/AI monetization progressing, and what is happening with free cash flow?
If it says “we’re continuing to invest more in AI, but ROI is clear” → it eases July-style spending concerns;
If it says “returns are slower than expected” → QQQ could sell off again.
What to watch for in TSLA:
It’s not just a car company; it’s a high-beta proxy for “AI / robotics / energy storage.”
Deliveries, gross margin, FSD, and what it says about Optimus matter more than sales volume.
A weak TSLA → high-beta tech sentiment could collapse again.
2) Industrial / defense / payments: proof that “the non-AI parts of the economy are holding up”
GE, RTX, NOC, LMT, MMM, UNP, CAT names (URI), AXP, COF:
Industrial orders = the temperature of the real economy;
Credit cards (AXP/COF) = consumer resilience and delinquencies;
Defense (RTX/NOC/LMT) = a geopolitical premium, but with budget constraints.
If they hold up, investors will be more willing to stay in SPY / XLI / XLV rather than go back to catch the falling knife in QQQ.
3) Macro anchors
Tuesday: housing starts / existing-home sales → has housing frozen under 5%+ rates?
Thursday: initial jobless claims + leading indicators → are there cracks in employment?
Friday: manufacturing / services PMI → soft landing or a second downturn in manufacturing?
These data will determine whether the 10-year Treasury yield holds 5.0% or surges to 5.3%–5.5%, and will directly determine the discount rates for SPY / QQQ.#WCTCS9
  • 1
#CryptoMarketTurnsGreedy #ShareWeekly
CRYPTO SENTIMENT IS SHIFTING TOWARD GREED: CAN BULLISH MOMENTUM SURVIVE THE NEXT MARKET TEST?
The cryptocurrency market is entering a potentially important phase as investor confidence improves and risk appetite begins to return. When sentiment shifts toward greed, traders often become more optimistic about Bitcoin, Ethereum, and alternative cryptocurrencies. This change can support stronger buying activity, rising trading volumes, and renewed interest in digital assets.
However, rising optimism does not automatically mean that another major rally is guar
BTC+0.73%
ETH+0.16%
  • 3
  • 3
October 19 Asia-Europe Session Outlook
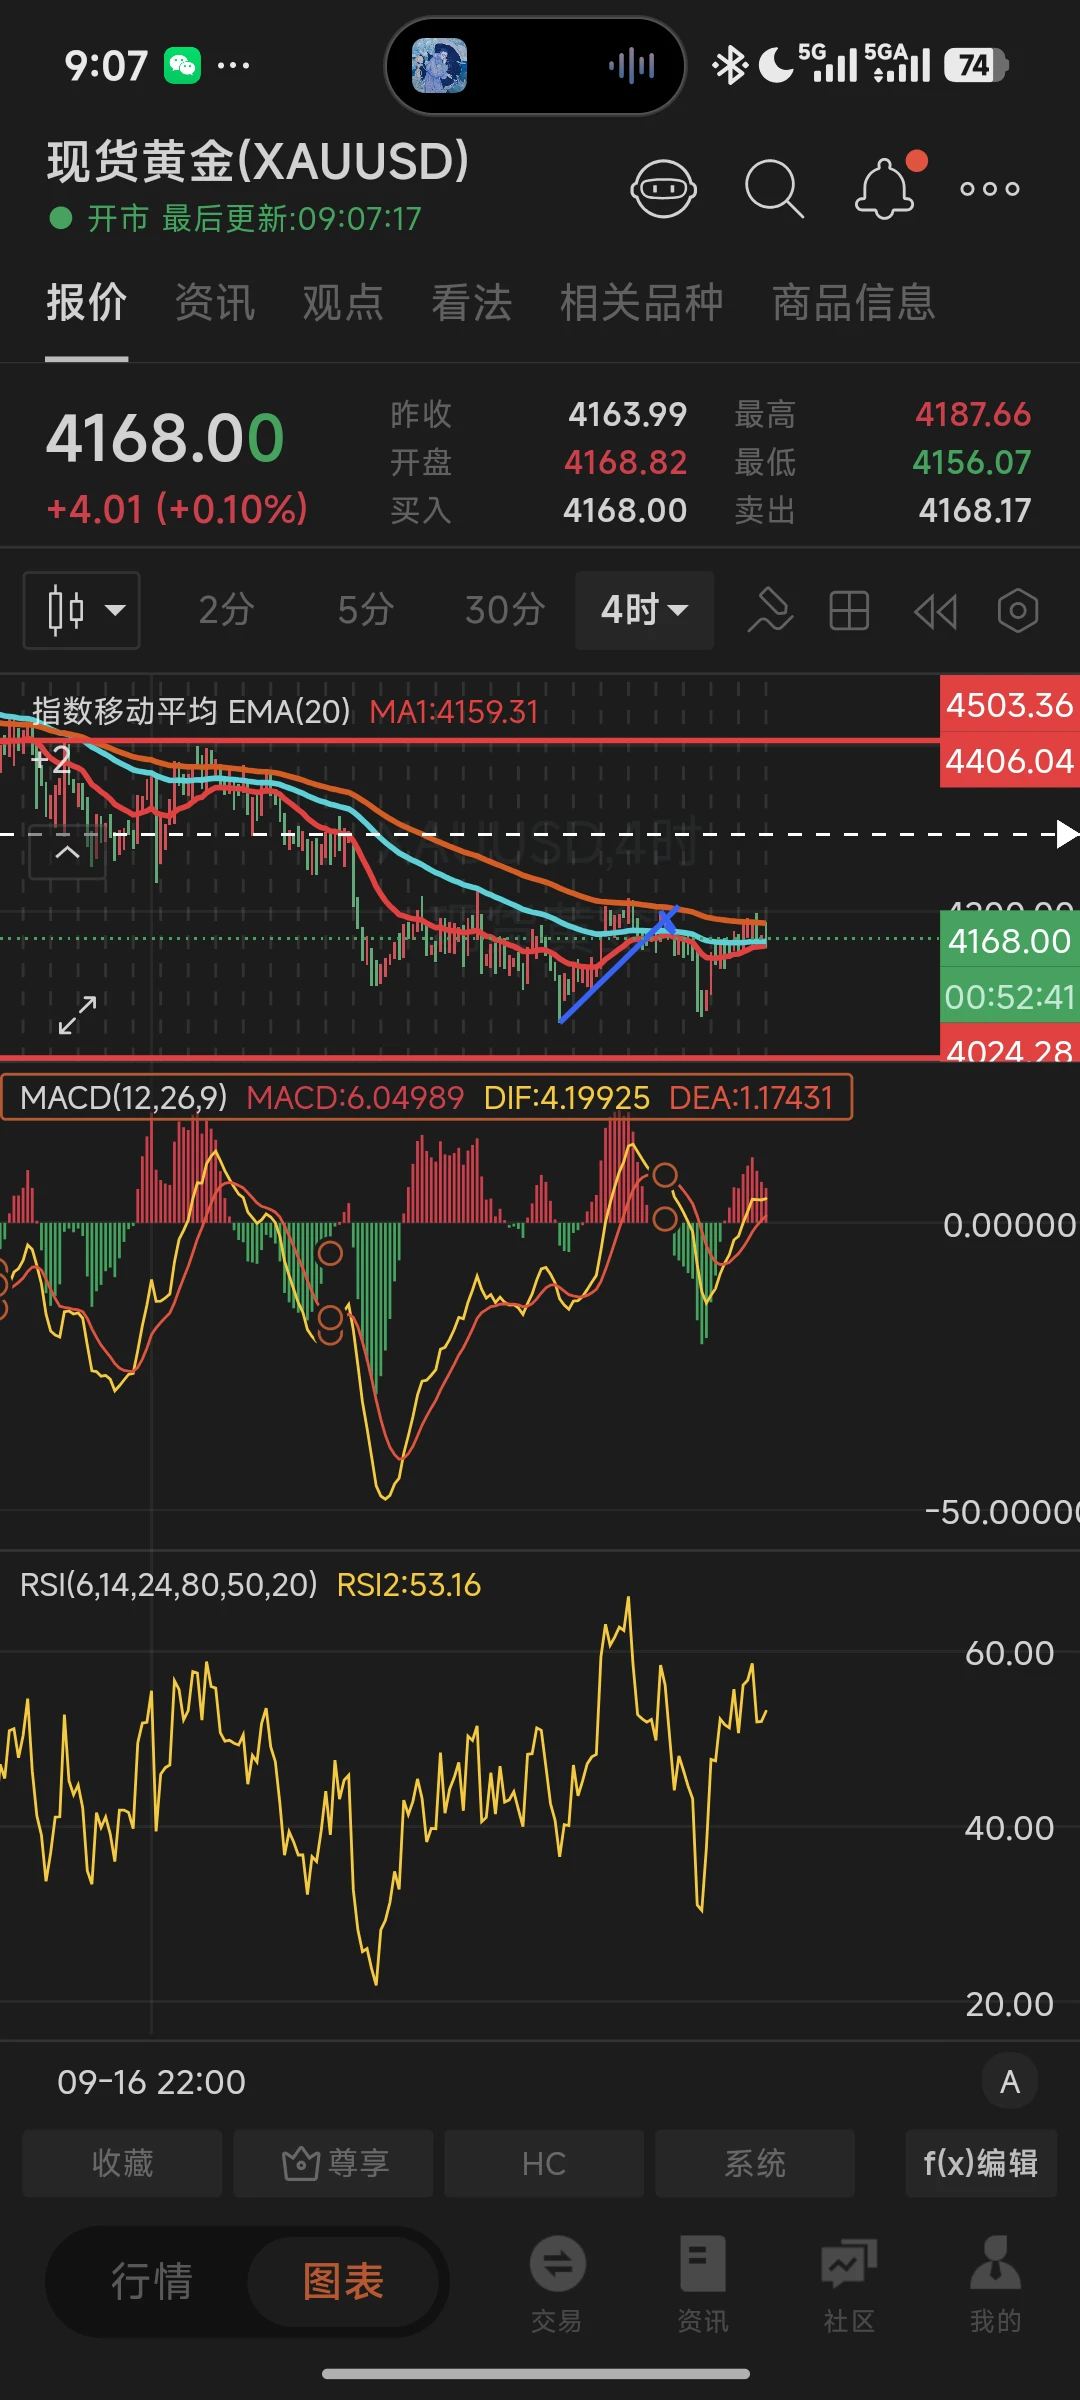
Price pushed higher at the open but was precisely capped by the 4h EMA100. The current 4-hour candle close looks concerning. Today, watch the 4215-4226 zone as a key area for bearish defense; only consider going long on a pullback if price gets above it. If it fails to break above, consider the 4113-4120 support zone.
Support: 4131-4137 (1h), 4113-4120 (4h), 4024-4035 (1day)
Resistance: 4215-4226 (1h, 4h), 4256-4260 (4h), 4303-4310 (1day)$XAUUSD
post-image
XAUUSD+0.18%
The US stock market has recently entered the peak of third-quarter earnings season, with several major AI-weighted giants reporting around the same time, and market volatility has increased significantly,
Many people have noticed: good news fails to lift prices, while bad news triggers a rebound—earnings season is when it’s easiest to get caught out.
Things to watch before earnings announcements 1. It’s not about whether the earnings are good, but how they compare with consensus expectations. Only results that beat expectations are bullish; even if profits grow, falling short of Wall Street ex
TSLA-2.17%
TXN-0.95%
FITB+0.05%
CLF+0.04%
MMM-0.38%
🚨 $ETH ETFs recorded $319.97 million in net outflows this week.
Institutional demand for Ethereum faces renewed pressure as capital flows out of ETH investment products.
Is this a warning sign or a buying opportunity?
#Ethereum #ETH #Crypto
post-image
ETH-1.64%
live market update
live-cover
LIVE2,065
Walk slowly
The confidence that comes from clearly visible results. $BTC $ETH #美国9月PPI大超预期
BTC+0.76%
ETH+0.16%
Yesterday, ZEC found support after dipping to a low of 1048.09 and began to rebound, rising to 1188.05. This rebound is a corrective move within a larger downtrend; the broader bearish trend on the daily chart remains unchanged and should not be viewed as a trend reversal.
On the 4-hour chart, price recovered rapidly and gradually approached the resistance zone above. On the hourly chart, prices rallied consecutively, indicators entered overbought territory, short-term bullish momentum is being depleted quickly, and selling pressure above is gradually emerging. The strategy is to stick to shor
post-image
ZEC+2.25%
Load More

Join 40 M users in our growing community

⚡️ Join 40 M users in the crypto craze discussion

💬 Engage with your favorite top creators

👍 See what interests you

Trending Topics

USSeptemberPPIBeatsExpectations

91.35k Views1.94k Discussing

US September PPI came in at 6.3% YoY, well above the 5.3% market expectation, pointing to renewed producer-side inflation pressure. Weekly jobless claims were 199K, broadly in line with forecasts. Could hotter inflation further reduce room for rate cuts, and what does it mean for $BTC, US stocks, and gold?

GateWCTCS9GlobalTradingCompetition

37.87k Views6.86k Discussing

GateBTCAndETHFuturesVolumeRanksTop3

53.8k Views1.98k Discussing

View More