










#BTC跌至9月以来新低 BTC Under Global Liquidity Withdrawal: After Falling Below the 200-Week Moving Average, Is $57.8k the Bottom or Just a Waystation?
The most painful thing about this decline is not how far prices have fallen, but that it offers no chance to catch your breath. U.S. stocks, gold, silver, copper, and crypto assets have almost all fallen. From November 19 to 20, spot gold briefly dropped to around $3,525 per ounce, its lowest level since September 2025, bringing its cumulative decline this quarter to about 15%; silver fell to $41.25, platinum to $1,299, and LME copper lost nearly 9% for the week.
Crypto markets were no exception: Bitcoin was around $61.8k on November 20, with a 7-day low of $61.3k and a cumulative quarterly decline of about 28%. This is not a problem limited to one sector, but a cross-asset battle for dollar liquidity.
I. Why Are Gold and Bitcoin Falling Together? The Answer Is Interest Rates
Many are still interpreting this market through the lens of “safe-haven assets,” but the reality is that when real interest rates continue to rise, gold and Bitcoin are sold off together.
What they have in common is that they offer no intrinsic yield, have no underlying cash flow, and generate no earnings. When the U.S. 10-year Treasury yield stays above 5.0% and the market even starts pricing in the possibility of a 50-basis-point Fed rate hike in December, the “opportunity cost” of holding these assets rises sharply.
The rise in rate-hike expectations is not unfounded. U.S. core CPI rose 0.3% month over month for the third consecutive month in October, with inflation still far above the Fed’s 2% long-term target.
Fed Vice Chair Jefferson said explicitly that inflation trends are a key signal for assessing monetary policy; Boston Fed President Collins said more rate hikes than expected may be necessary; Governor Waller even argued that a 50-basis-point hike should be considered if core inflation stays above 0.3%.
CME FedWatch data showed that the probability of a 25-basis-point hike in December briefly rose above 88%, while the probability of a 50-basis-point hike also reached 11.7%. The deeper transmission chain is: AI bubble concerns → tech stock sell-off → investors forced to sell gold and crypto assets to raise funds to meet margin requirements → surge in demand for dollar liquidity → sell-offs in emerging-market assets → broad contraction in global risk appetite.
Bloomberg noted that investors are selling gold to cover losses from the decline in AI stocks, explaining why even traditional safe-haven assets are under pressure.
II. Technicals: What Does a Break Below the 200-Week Moving Average Mean?
On November 17, Bitcoin officially fell below the 200-week moving average, the most critical technical signal in this decline.
Historically, the 200-week moving average has been seen as Bitcoin’s “lifeline”—the strongest support in a bull market and the hardest resistance to overcome in a bear market.
During the 2022 bear market, Bitcoin entered a year-long deep correction after falling below the 200-week moving average.
Matthew Sigel, head of digital asset research at VanEck, warned that the current situation resembles late 2022 and early 2023, which was the final stage before the previous upcycle ended.
Wintermute’s analysis is more direct: Bitcoin’s recent rebound above $64.5k was driven more by short sellers closing positions than by new capital entering. To confirm that long-term support has re-formed, Bitcoin must recover to around $68k, accompanied by fresh inflows into spot ETFs.
From the price structure perspective, the assessment that the structure was redrawn after the break below $71.8k is valid. But it should be added that the market is no longer discussing “whether it can return to $71.8k,” but rather “whether $57.8k can hold.”
III. $57.8k: A Three-Way Convergence of Miner Costs, the Power Law Model, and Historical Support
The reason $57.8k has become the key battleground between bulls and bears in this decline is not simply technical charting, but the convergence of multiple fundamental factors:
First, miners’ production costs.
Schwab strategists point out that the production cost for the most efficient miners is about $60k, while the industry’s average production cost is in the $52k–$70k range. When prices fall below miners’ average costs, selling pressure from miners weakens significantly—because those with the greatest incentive to hold (miners) can no longer keep selling.
JPMorgan data shows that by June 2026, 20% of miners were operating at a loss, network hashrate had fallen 10%, and weaker miners were exiting.
Second, support from the power law model.
The power law model cited by Jurrien Timmer, Fidelity’s head of global macro, shows that around $58k is precisely the lower range of the model, where multiple market bottoms have formed historically. Bitcoin’s current price is about 56% below the model’s median trendline, a deviation closely matching the characteristics of the 2018 and 2022 bear markets.
Third, on-chain cost support.
The network-wide realized price is about $61.5k, while the realized price for long-term holders (holding for more than 155 days) is about $48.8k, meaning structural holders still have 28% in unrealized gains and are not panic-selling.
Current selling pressure is mainly coming from short-term holders (those who bought within the past 155 days), whose cost basis is about $74.3k, leaving all of them at an unrealized loss.
But it must be noted that Fidelity also warned that, without an injection of new liquidity, Bitcoin is very likely to enter a months-long consolidation around $58k rather than rapidly reverse in a V-shaped recovery.
IV. Three Scenarios and Trading Strategies
Based on the current market environment, the future trajectory can broadly be divided into three scenarios:
Scenario 1 (about 30% probability): $61k holds, with a rebound before another test of the lows
If support forms around $61k, BTC may first rebound to challenge trendline resistance at $65.8k; a breakout would further confirm the lower boundary of the $72k channel, followed by another pullback to test $57.8k. This path is relatively favorable for bulls, giving them a window to reduce or adjust positions.
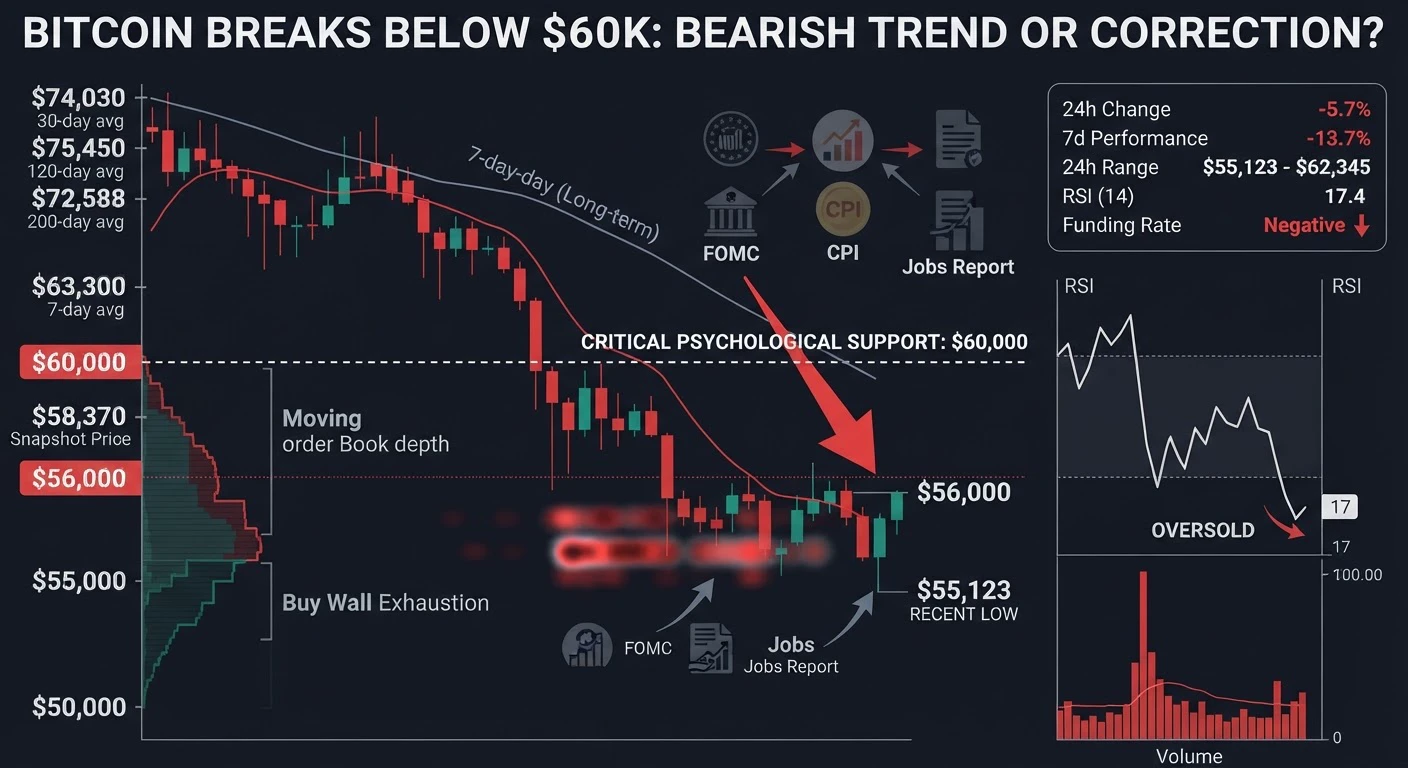
Scenario 2 (about 50% probability): Weak consolidation followed by a direct break below $60k and a test of $57.8k
This is currently the most likely path. With continued ETF outflows and elevated rate-hike expectations, the market lacks rebound momentum and may break directly below the psychological $60k level, testing $57.8k support. If a double bottom forms there or the price quickly recovers after a wick, the rebound could be strong; this could be seen as a second bottoming attempt after the rally from $57.8k, with a subsequent move back toward $72k possible.
Scenario 3 (about 20% probability): $57.8k decisively breaks, with a drop to $53.8k or even $46k
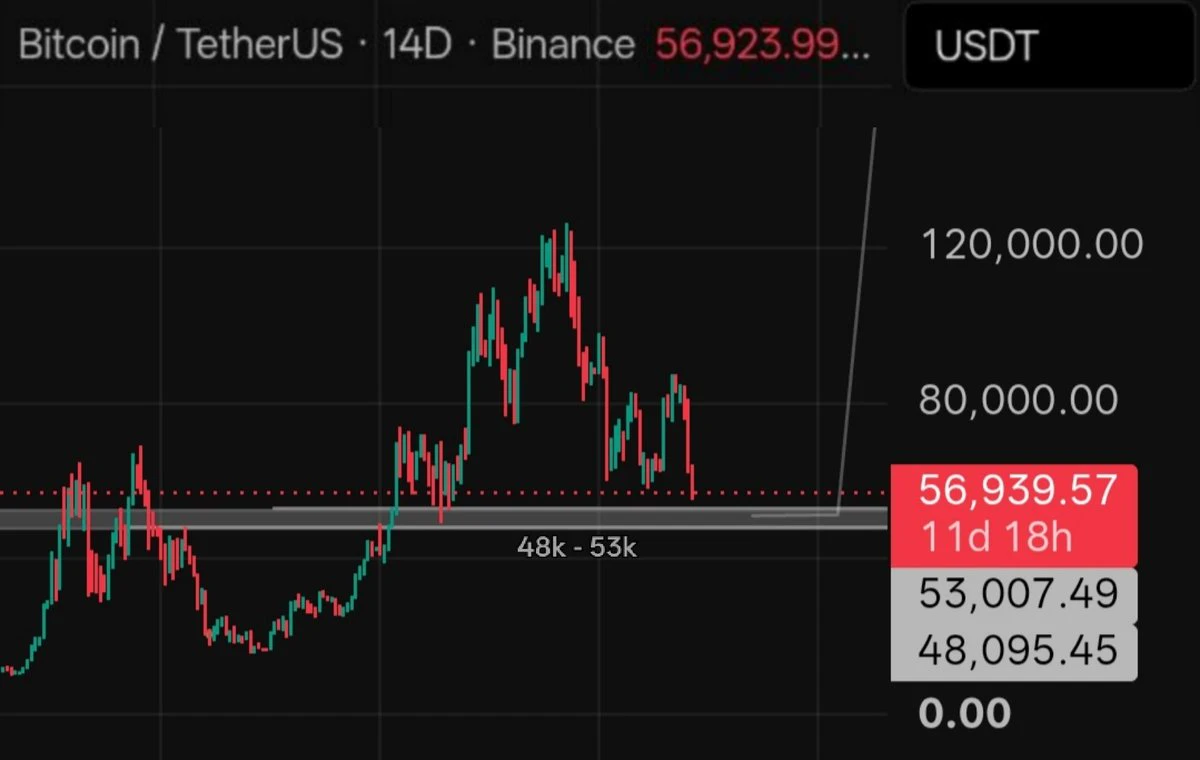
If $57.8k breaks decisively and support around $55.8k also fails, attention should turn to the annual MA7 support at $53.8k. But the more likely case is that this would coincide with an external black swan (such as a larger-than-expected 50-basis-point Fed hike or systemic risk triggered by the bursting of the AI bubble); in that case, Fibonacci extensions point lower: the 0.5 level is about $46.6k, the 0.618 level about $43.1k, and the unfilled CEM gap is around $42k. The $46k–$42k range could become the true broad bottoming zone.
The essence of this decline is not an internal problem with the crypto market, but the inevitable result of global liquidity tightening and interest rate repricing. Bitcoin’s correlation with gold and tech stocks has risen to 0.6–0.7; it is no longer a “safe-haven asset” independent of traditional finance, but part of global risk assets.
Is $57.8k the bear-market bottom or a waystation on the way down? The answer is not in the candlesticks, but in the Fed’s rate decision, whether the AI bubble can land softly, and whether global dollar liquidity can ease again. For most people, the most valuable move right now is not to “buy the exact bottom,” but to reduce leverage, write down position rules, stick to a dollar-cost-averaging plan, and then wait.
Those who survive get another cycle. In a market where hundreds of millions of dollars in margin can still evaporate in 24 hours, this is not a platitude, but the only actionable strategy. #WCTCS9 $BTC
The most painful thing about this decline is not how far prices have fallen, but that it offers no chance to catch your breath. U.S. stocks, gold, silver, copper, and crypto assets have almost all fallen. From November 19 to 20, spot gold briefly dropped to around $3,525 per ounce, its lowest level since September 2025, bringing its cumulative decline this quarter to about 15%; silver fell to $41.25, platinum to $1,299, and LME copper lost nearly 9% for the week.
Crypto markets were no exception: Bitcoin was around $61.8k on November 20, with a 7-day low of $61.3k and a cumulative quarterly decline of about 28%. This is not a problem limited to one sector, but a cross-asset battle for dollar liquidity.
I. Why Are Gold and Bitcoin Falling Together? The Answer Is Interest Rates
Many are still interpreting this market through the lens of “safe-haven assets,” but the reality is that when real interest rates continue to rise, gold and Bitcoin are sold off together.
What they have in common is that they offer no intrinsic yield, have no underlying cash flow, and generate no earnings. When the U.S. 10-year Treasury yield stays above 5.0% and the market even starts pricing in the possibility of a 50-basis-point Fed rate hike in December, the “opportunity cost” of holding these assets rises sharply.
The rise in rate-hike expectations is not unfounded. U.S. core CPI rose 0.3% month over month for the third consecutive month in October, with inflation still far above the Fed’s 2% long-term target.
Fed Vice Chair Jefferson said explicitly that inflation trends are a key signal for assessing monetary policy; Boston Fed President Collins said more rate hikes than expected may be necessary; Governor Waller even argued that a 50-basis-point hike should be considered if core inflation stays above 0.3%.
CME FedWatch data showed that the probability of a 25-basis-point hike in December briefly rose above 88%, while the probability of a 50-basis-point hike also reached 11.7%. The deeper transmission chain is: AI bubble concerns → tech stock sell-off → investors forced to sell gold and crypto assets to raise funds to meet margin requirements → surge in demand for dollar liquidity → sell-offs in emerging-market assets → broad contraction in global risk appetite.
Bloomberg noted that investors are selling gold to cover losses from the decline in AI stocks, explaining why even traditional safe-haven assets are under pressure.
II. Technicals: What Does a Break Below the 200-Week Moving Average Mean?
On November 17, Bitcoin officially fell below the 200-week moving average, the most critical technical signal in this decline.
Historically, the 200-week moving average has been seen as Bitcoin’s “lifeline”—the strongest support in a bull market and the hardest resistance to overcome in a bear market.
During the 2022 bear market, Bitcoin entered a year-long deep correction after falling below the 200-week moving average.
Matthew Sigel, head of digital asset research at VanEck, warned that the current situation resembles late 2022 and early 2023, which was the final stage before the previous upcycle ended.
Wintermute’s analysis is more direct: Bitcoin’s recent rebound above $64.5k was driven more by short sellers closing positions than by new capital entering. To confirm that long-term support has re-formed, Bitcoin must recover to around $68k, accompanied by fresh inflows into spot ETFs.
From the price structure perspective, the assessment that the structure was redrawn after the break below $71.8k is valid. But it should be added that the market is no longer discussing “whether it can return to $71.8k,” but rather “whether $57.8k can hold.”
III. $57.8k: A Three-Way Convergence of Miner Costs, the Power Law Model, and Historical Support
The reason $57.8k has become the key battleground between bulls and bears in this decline is not simply technical charting, but the convergence of multiple fundamental factors:
First, miners’ production costs.
Schwab strategists point out that the production cost for the most efficient miners is about $60k, while the industry’s average production cost is in the $52k–$70k range. When prices fall below miners’ average costs, selling pressure from miners weakens significantly—because those with the greatest incentive to hold (miners) can no longer keep selling.
JPMorgan data shows that by June 2026, 20% of miners were operating at a loss, network hashrate had fallen 10%, and weaker miners were exiting.
Second, support from the power law model.
The power law model cited by Jurrien Timmer, Fidelity’s head of global macro, shows that around $58k is precisely the lower range of the model, where multiple market bottoms have formed historically. Bitcoin’s current price is about 56% below the model’s median trendline, a deviation closely matching the characteristics of the 2018 and 2022 bear markets.
Third, on-chain cost support.
The network-wide realized price is about $61.5k, while the realized price for long-term holders (holding for more than 155 days) is about $48.8k, meaning structural holders still have 28% in unrealized gains and are not panic-selling.
Current selling pressure is mainly coming from short-term holders (those who bought within the past 155 days), whose cost basis is about $74.3k, leaving all of them at an unrealized loss.
But it must be noted that Fidelity also warned that, without an injection of new liquidity, Bitcoin is very likely to enter a months-long consolidation around $58k rather than rapidly reverse in a V-shaped recovery.
IV. Three Scenarios and Trading Strategies
Based on the current market environment, the future trajectory can broadly be divided into three scenarios:
Scenario 1 (about 30% probability): $61k holds, with a rebound before another test of the lows
If support forms around $61k, BTC may first rebound to challenge trendline resistance at $65.8k; a breakout would further confirm the lower boundary of the $72k channel, followed by another pullback to test $57.8k. This path is relatively favorable for bulls, giving them a window to reduce or adjust positions.
Scenario 2 (about 50% probability): Weak consolidation followed by a direct break below $60k and a test of $57.8k
This is currently the most likely path. With continued ETF outflows and elevated rate-hike expectations, the market lacks rebound momentum and may break directly below the psychological $60k level, testing $57.8k support. If a double bottom forms there or the price quickly recovers after a wick, the rebound could be strong; this could be seen as a second bottoming attempt after the rally from $57.8k, with a subsequent move back toward $72k possible.
Scenario 3 (about 20% probability): $57.8k decisively breaks, with a drop to $53.8k or even $46k
If $57.8k breaks decisively and support around $55.8k also fails, attention should turn to the annual MA7 support at $53.8k. But the more likely case is that this would coincide with an external black swan (such as a larger-than-expected 50-basis-point Fed hike or systemic risk triggered by the bursting of the AI bubble); in that case, Fibonacci extensions point lower: the 0.5 level is about $46.6k, the 0.618 level about $43.1k, and the unfilled CEM gap is around $42k. The $46k–$42k range could become the true broad bottoming zone.
The essence of this decline is not an internal problem with the crypto market, but the inevitable result of global liquidity tightening and interest rate repricing. Bitcoin’s correlation with gold and tech stocks has risen to 0.6–0.7; it is no longer a “safe-haven asset” independent of traditional finance, but part of global risk assets.
Is $57.8k the bear-market bottom or a waystation on the way down? The answer is not in the candlesticks, but in the Fed’s rate decision, whether the AI bubble can land softly, and whether global dollar liquidity can ease again. For most people, the most valuable move right now is not to “buy the exact bottom,” but to reduce leverage, write down position rules, stick to a dollar-cost-averaging plan, and then wait.
Those who survive get another cycle. In a market where hundreds of millions of dollars in margin can still evaporate in 24 hours, this is not a platitude, but the only actionable strategy. #WCTCS9 $BTC