Share your thoughts
placeholder
Article
$BTR This move directly shrank my account by $180,000. Three days ago I chased a long at 0.0615, and this morning I cut at 0.0478. One swift strike, and $180,000 was reduced to $112,000. Don’t ask me why I cut—if you must ask, it’s because I couldn’t hold on any longer. But after cutting, I actually calmed down. I pulled up the data and looked again: down 20.23% in 24 hours, with a trading volume of 61.4M. Pay attention to this volume—it’s not a panic-driven low-volume grind downward, but a high-volume sell-off with buyers absorbing the supply. The low was 0.0478 and the current price is 0.04
BTR-19.41%
Observing the F***boy: SPCX
Big Rocket closed at 148.18 in U.S. trading, up 0.43%, with an intraday high of 154.70 and a low of 144.89.
Looking at the daily candlestick chart, Big Rocket's closing price was between the 5-day and 10-day moving averages. The overall rebound trend remains unchanged, and the impact of the share unlock is also diminishing.
Specifically, it opened lower in premarket trading, with the day's low also occurring around the opening. The bulls then surged ahead and pushed steadily toward the 155 level. However, after failing to set a new high, they began to retreat. The m
post-image
SPCX+0.46%
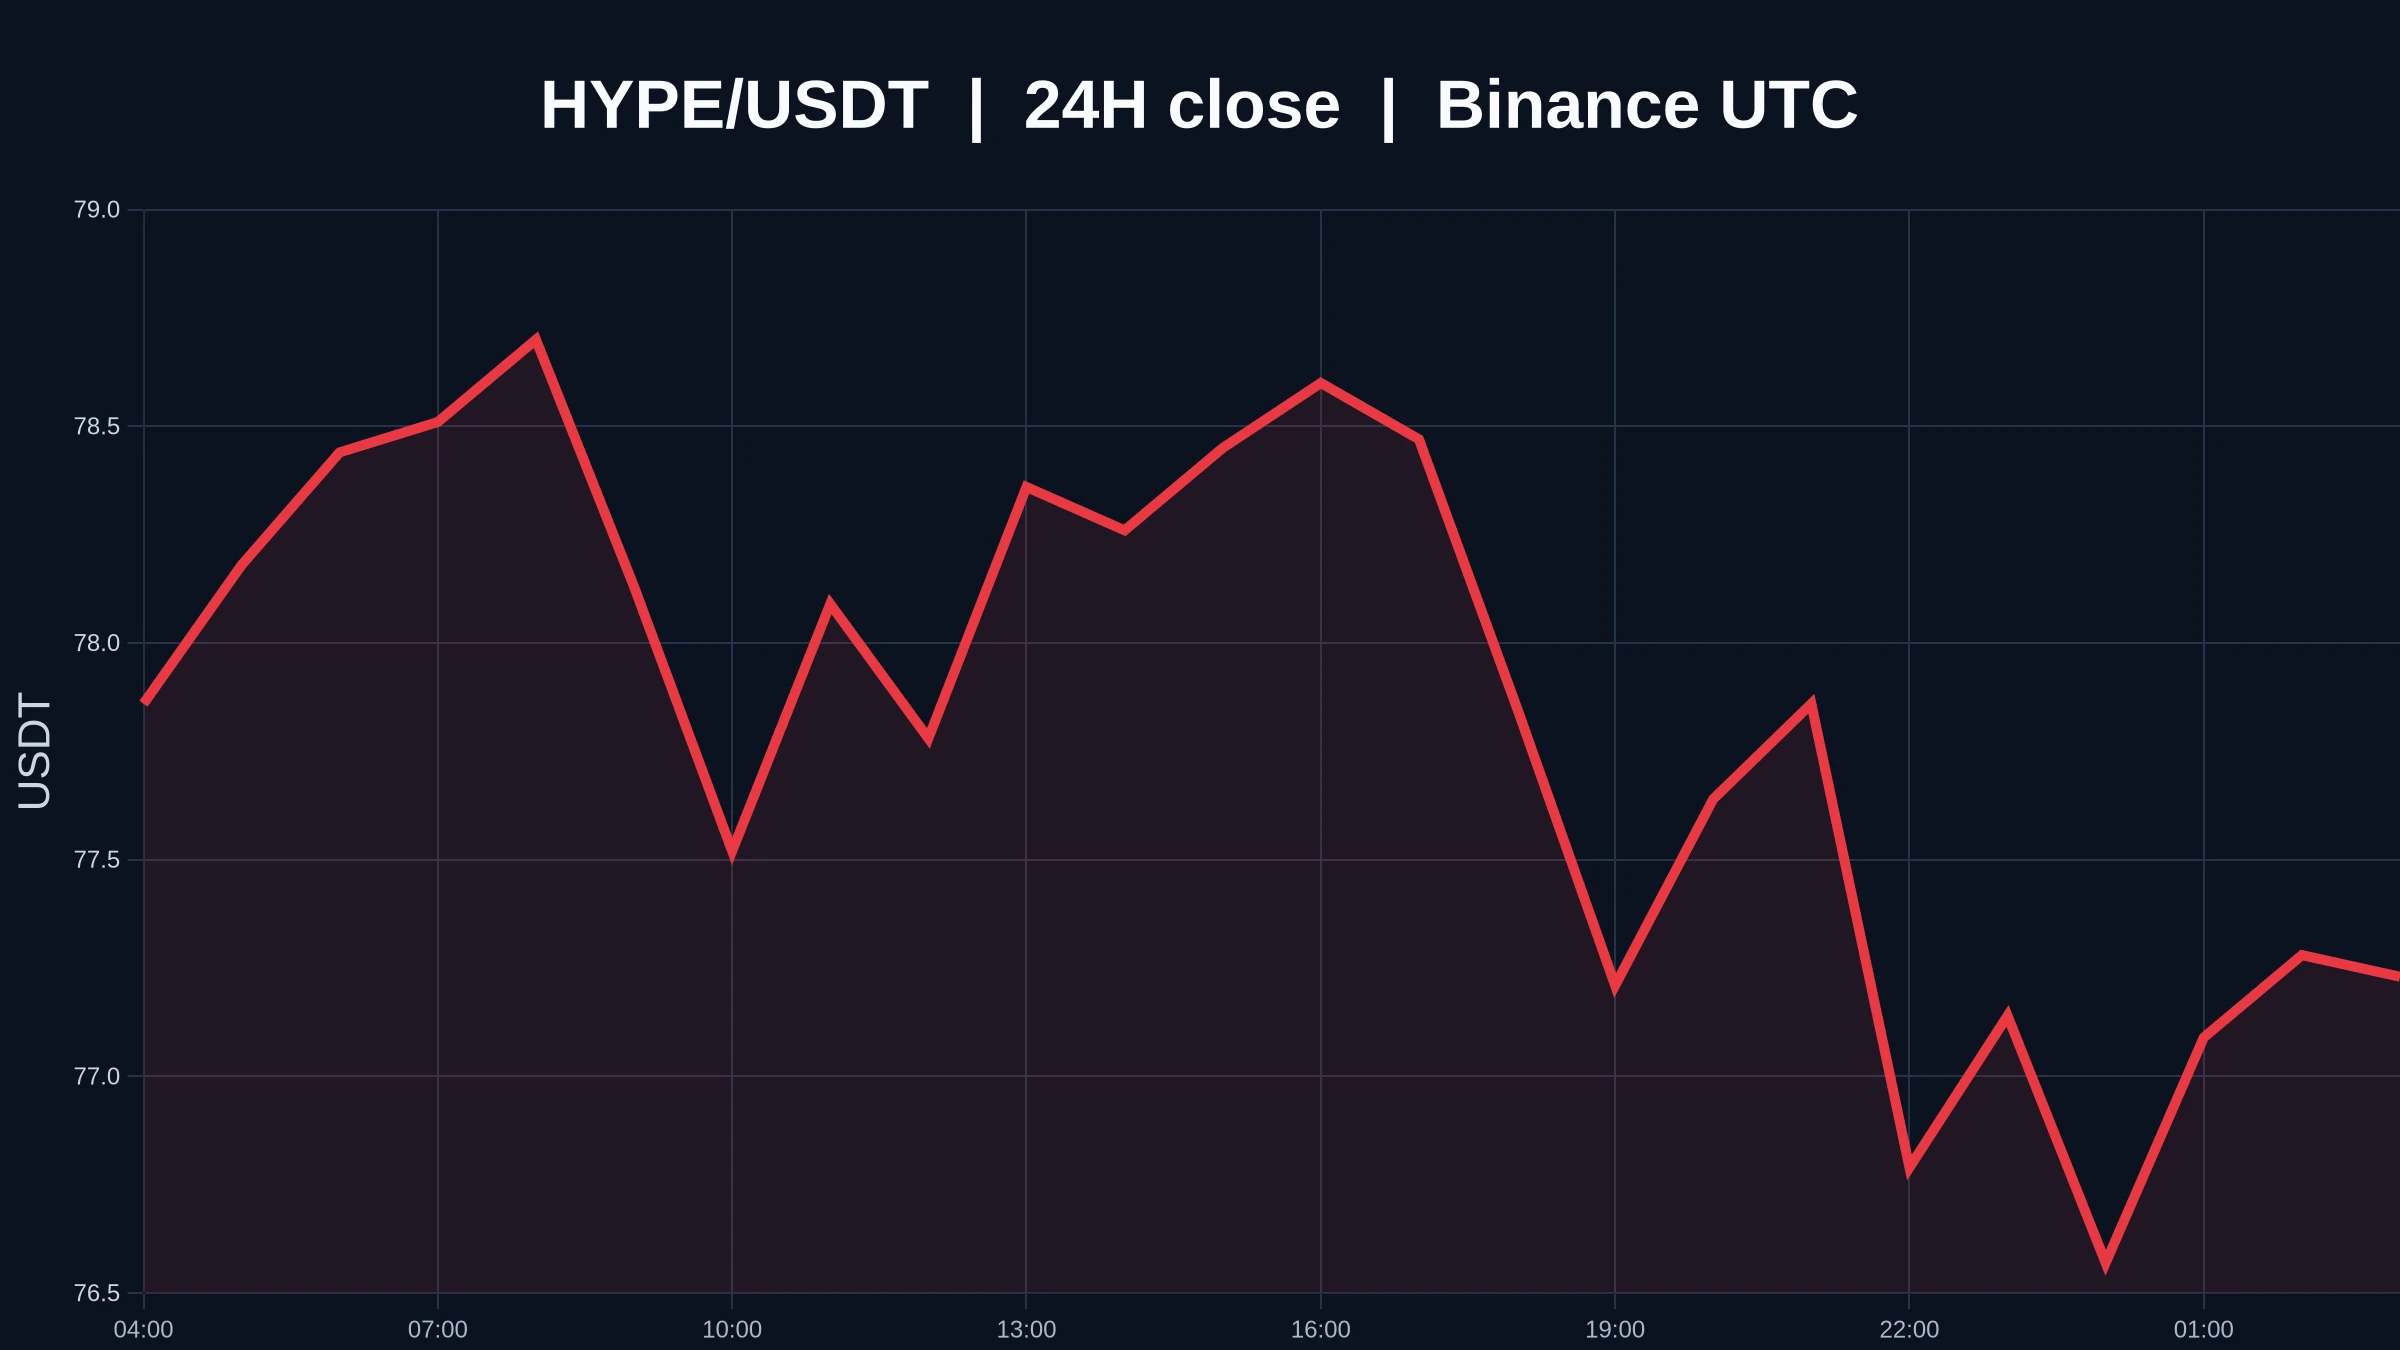
$HYPE /USDT is about to test TP2 and most traders are not ready.

$HYPE /USDT - LONG

Trade Plan:
Entry: 78.897 – 79.445
SL: 75.748
TP1: 81.739
TP2: 83.450
TP3: 86.018

Why this setup?
Why now? The daily trend is bullish, the 1h price sits at 79.171, the 15m RSI is at 27.71 showing oversold exhaustion, and the 1h ATR of 1.097242 confirms the volatility is expanding enough to fuel the next leg higher. The entry zone between 78.897 and 79.445 aligns perfectly with the current 1h price, giving a precise risk-defined setup. The first target sits at 81.739, while the second target extends to 83.
HYPE-4.78%
Good morning, review
Still holding OP long positions and continuing to lose
Shorting Nvidia, I sold OP early and went from making 2,000+ to losing 1,000—is it my greed or a decision-making mistake?
Keep going
post-image
OP-3.56%
NVDA-2.25%
A few days ago, I was still calculating whether I had enough money for instant noodles this month; this morning, I was already wondering whether to add sausage. After lunch, when I checked the charts, $AIOT started moving from 0.04200. I saw the bottom consolidation had ended and buying pressure was taking over, so I opened a long directly.
While others were still waiting and watching, I had already made the direction clear: get in once the pullback holds. The logic was simple and straightforward.
Now it has reached 0.04318, with a +13.04% gain. It feels great. It was truly sluggish at first,
post-image
AIOT+5.40%
SOL-2.26%
SNDK-3.59%
$MU /USDT is about to explode past 1000 but nobody is talking about it.

$MU /USDT - LONG

Trade Plan:
Entry: 971.93 – 976.51
SL: 945.58
TP1: 995.70
TP2: 1010.02
TP3: 1031.50

Why this setup?
Why now? The daily trend is range, which means a breakout from the 1h price of 974.22 can move fast. The 15m RSI at 33.2 shows oversold exhaustion, so sellers are running out of steam. The 1h ATR of 9.18 tells us each candle has enough fuel to reach the first target of 995.70 and push toward TP2 at 1010.02. Entry is tight between 971.93 and 976.51, keeping risk controlled while the invalidation level a
MU-4.20%
In August, the U.S. PPI rose 0.4% month-on-month and 5.4% year-on-year. The monthly increase was in line with expectations, but the annual increase was slightly higher than expected and accelerated further from July
This data is not particularly comfortable for either U.S. stocks or Crypto. The key question remains whether inflation is starting to pick up again
If CPI, employment, and other data remain hot, market expectations for rate cuts may be pushed back further. U.S. stocks, especially high-valuation tech stocks, will come under pressure first, and Crypto will also find it difficult to r
BTC-1.68%
AAPL+3.55%
$SOL Signal】Short: 1H rebound on declining volume, 4H lower band under pressure
$SOL The 1H rebound is stuck below EMA20 100.4619, with declining volume and buyers unable to push up the price. The 4H MACD histogram remains negative but is contracting, while the price is still below EMA20 102.0549 and EMA50 102.7357. RSI is 41.26 on 1H and 35.73 on 4H, indicating limited rebound strength. The order book depth ratio is 1.26, with thick buy orders that cannot push the price higher and insufficient aggressive buying; sell orders are queued above. The funding rate is 0.0023%, OI is stable, and sig
post-image
SOL-2.26%
CRYPTO MARKET UPDATES
live-cover
LIVE964
ORO Airdrop Eligibility Check
Log in with the previously linked Keplr wallet
Yesterday’s 0-point bug has been fixed. After checking, only one account has 15,500 points.
post-image
ORO-2.65%
This market is honestly a bit surreal
The 10-year U.S. Treasury yield surged to 4.943%, oil prices broke straight through $100, and the market even started pricing in Fed tightening expectations again
$BTC fell below 77,000, $ETH 2440, $SOL went straight to 99, while altcoins began collectively performing a freefall
$ZEC -13.6% in 24 hours, solana:35f7eyhtvueDfmV23g9qMVmUzDcSzFi4uUwPTF2dx1de -46%, $RVN -23%, $KAT -20%
But not all coins are falling: $Niu Lai +39%, saga-2:native +27%, solana:4k3Dyjzvzp8eMZWUXbBCjEvwSkkk59S5iCNLY3QrkX6R +16%
All I can say is that the market is no longer a m
9/11 $SNDK Analysis
I told you to short, but I don't know whether you did; it has shorted from the highest point again. The 4-hour candlestick highs have continued to decline from 1783 → 1740 → 1700, while the price is clinging to the lower Bollinger Band (1677.60). The middle Bollinger Band at 1745.88 forms strong resistance above. MACD (12,26,9) DIF is -9.25, DEA is 3.77, and the histogram is -26.06, with the spread still widening; short momentum shows no signs of converging yet.
Below: 1674.42 (the recent low) is the first validation level for the bearish thesis. After breaking below it, 1
SNDK-4.01%
AAPL+3.55%
At 773 in the early hours, continued shorting intraday; I also said during the morning livestream that there was no need to rush to exit, as another low was expected. The bottom was reached as expected in the morning, and the short position at 766 exited with a 730-point gain. The 23rd consecutive win arrived as expected. Wait for a rebound and continue shorting, but pay attention to whether the Bollinger Bands expand after the daily close, as well as the room for further downside.
post-image
ETH-0.43%
BTC-1.68%
The short strategy at the 365-day moving average level, with the coin price at 82222, has multiplied the principal 11x in 8 days and successfully come to a close!
Subscription special price: 8.8, today only. Subscribe and get on board—the next big trade is being laid out!
post-image
  • 3
Ever since I got MCPX, I’ve genuinely had this feeling lately:
It’s like I’ve unlocked “unlimited usage” for ChatGPT.
Of course, it isn’t actually unlimited.
The Chat mode itself already has a pretty generous quota, and after installing and configuring MCPX, many things that originally required me to switch software, find tools, or run commands myself can now be done directly in Chat.
And I think the best thing about MCPX isn’t that it “adds another new tool.”
It’s precisely that once it’s installed, you can even forget MCPX exists.
You can keep talking to ChatGPT normally, just like before:
H
post-image
This return has me feeling nervous, worried that the market will catch on tomorrow and blacklist me.

When I checked the market after lunch, $XRP was struggling to rebound, with a strong bull-trap vibe. Volume hadn't followed, and the upside wasn't easy to break through. I knew the short-side logic was unchanged, so I warned against chasing longs and said to wait for it to pull back on its own. The pressure at high levels was no joke.

From 1.3844 to 1.3355, +329.02%—nailed it. Time to treat myself to a good meal. This profit feels great; the earlier grind was worth it, and the timing was sp
post-image
XRP-3.60%
SNDK-3.59%
BTC-1.70%
Insiders are quietly setting up a long on BNB while the range holds.

$BNB /USDT - LONG

Trade Plan:
Entry: 709.37 – 711.93
SL: 694.64
TP1: 722.66
TP2: 730.66
TP3: 742.67

Why this setup?
Why now? The daily trend is range-bound, but the 1h price is sitting at 710.65 with a tight 1h ATR of 5.13, signaling compressed energy before a move. The 15m RSI at 45.28 shows room to run without being overbought. Entry is defined between 709.37 and 711.93, giving a precise zone to accumulate. The first target is 722.66, with a second target at 730.66, but the trade gets invalidated if price pushes to 72
BNB-1.36%
Load More

Join 40 M users in our growing community

⚡️ Join 40 M users in the crypto craze discussion

💬 Engage with your favorite top creators

👍 See what interests you