Share your thoughts
placeholder
Article
🚨 Over 3,400 BTC have been recovered after a successful negotiation with White Hats! But 598.5 BTC still hangs in limbo. Why is this crucial for $BTC 's future? 🤔 #crypto
BTC-1.53%
How Much Further Can ZEC Go After Surging Past $1,200? The Real Test Has Just Begun
ZEC breaking through $1,200 means the market has officially entered a new price discovery phase.
Previously, $900 and $1,000 were important psychological levels, but these positions have now been broken through consecutively. The latest market data shows that ZEC recently came close to $1,250 at its peak, gaining more than 40% over the past week—a remarkably rapid rise.
So the question is: where is the next stop?
After breaking through its all-time high, traditional resistance levels become less meaningful, and
ZEC-7.11%
  • 48
This return makes me feel both thrilled and apprehensive, afraid the market will catch on tomorrow and blacklist me. 😂

I just checked the market again. $ZEC climbed from 610.37 all the way to 1140.08, with floating gains now at +6152.24%. Honestly, the luckiest part of this round wasn’t buying early, but holding on.

While everyone else was running, it stayed sideways at key levels without breaking down, and funds stepped in to buy every pullback. That already says a lot. I only took one action at the time: don’t get off, hold tight.

This is not the place to add to the position—I need t
post-image
ZEC-7.08%
XRP-1.79%
DOGE-0.21%
9.08 ETH Analysis
Analysis: Go long on a pullback to around 2450–2460, with defense at 2430; first target 2490, second target 2515
On the 1H ETH chart, the price came under pressure and pulled back after surging to the phase high of 2536.00, with the low reaching 2464.62. It is currently in a consolidation phase following the high-level pullback.
The short-term MA7 and MA30 are flattening and edging slightly downward. The price is trading below the moving averages, which are creating overhead resistance. After the continuous decline, bearish momentum is gradually being depleted. 2450–2460 is t
post-image
ETH-0.95%
Insiders are quietly loading ZEC while the 1d trend screams bullish and RSI stays oversold.

$ZEC /USDT - LONG

Trade Plan:
Entry: 1144.89 – 1155.75
SL: 1098.20
TP1: 1189.41
TP2: 1215.47
TP3: 1254.56

Why this setup?
Why now? The daily trend is firmly bullish, setting a higher-timeframe tailwind that most retail traders are still ignoring. The 1h ATR of 21.717173 tells us volatility is compressed enough for a clean breakout from the entry zone around 1150.32, where the 1h price currently sits. With the 15m RSI at 38.79, momentum is deeply oversold, suggesting a squeeze is overdue rather tha
ZEC-7.08%
This entry point was not perfect; I tried a long at the area where the price tested the low for a second time on the $UAI hourly chart. The moving averages had not fully turned yet, so I could only use a tight stop-loss in exchange for room for profits later.

After entry, the price action was very sticky. Several rallies were pushed back, making it look as though the trend was weakening. But the key levels during each pullback never broke below the key reference level at entry, so I chose to reduce my trading frequency and let the position run.

Only after the key level above was broken did
post-image
UAI+21.28%
ETH-0.93%
LAB-2.73%
Layout for Bitcoin, Ethereum, and Dogecoin
live-cover
LIVE1,437
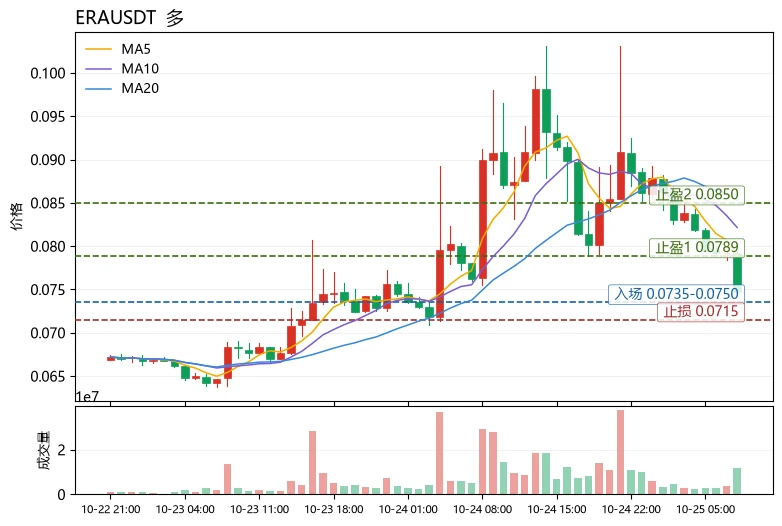
$H /USDT is about to break something most traders will not see coming.

$H /USDT - SHORT

Trade Plan:
Entry: 0.07700 – 0.07762
SL: 0.08033
TP1: 0.07504
TP2: 0.07353
TP3: 0.07127

Why this setup?
Why now? The daily trend is bearish and the 4h setup has 95% confidence, which means the market is already moving in our favor before we even enter. The 1h ATR of 0.001259 tells us volatility is compressed, so a breakout from the 0.07731 entry zone could be explosive. The 15m RSI at 50.92 shows the short term is neutral, giving us a clean trigger without chasing. If price pushes to TP1 at 0.07504 it
H+4.90%
HealthAPI turns your Apple Health into a personal API so ChatGPT or Claude can answer with your real steps, sleep, and heart rate.
Sync on iPhone, get a key, then ask your AI how you actually slept or recovered.
Would you let an AI read your Health app?
post-image
ethereum:native
Higher low or one thousand US dollars
post-image
ETH-0.95%
9.08 Bitcoin Analysis
Analysis: Go long on a pullback to around 78000‑78500, with 77500 as the defensive stop, first target at 79500, and second target at 80000
On the hourly chart, the price has undergone a continuous decline, falling under pressure from the high of 80536.1 and testing a low of 78636.0. The short-term MA7 and MA30 moving averages are both trending downward, with the price below the moving averages, indicating that bears are in control in the short term. The Bollinger Bands are opening downward, with the price moving close to the lower band. After consecutive bearish candlesti
post-image
BTC-1.53%
This short entry was not early, but it was fairly comfortable to hold. After the sideways consolidation broke down, I only looked for an entry during the pullback confirmation. I entered with a protective level in place, setting the stop-loss near the previous high rather than trying to catch the bottom.
As the move continued, the profit was once quite decent. A quick rebound midway caused the account to give back a small portion. I did not panic because scaling out at 0.014417/20 had already locked in most of the profit; for the remainder, I simply gave it room as long as the protective level
post-image
XRP-1.79%
BNB-1.63%
I was just about to curse it out, but then I looked at my account and thought, never mind. Let it fall however it wants—I’ll keep quiet.

During the intraday plunge, it weakly bounced to around 0.06198. The trading volume looked half-asleep, bids were weak, and it was obvious it couldn’t go any higher. I placed a short order, and sure enough, it later ground all the way down to 0.05601, +236.19%. That profit felt great.

The operation wasn’t complicated: lock in 80% first, and set breakeven protection for the remaining 30%. Even if it bounces, it won’t touch my profits. With a coin you’re no
post-image
SNDK+0.33%
SOL-2.49%
$PIEVERSE 1 hours ago, whale address 0x8f3c...9a2b just transferred in 4 million tokens at a cost basis of 0.98, with a 28% unrealized profit and no selling. Another address, 0x2b7e...c41d, sold 1.2 million tokens in three transactions yesterday at an average price of 1.15, clearly unloading a break-even position. The current price of 1.2637 is down 4% from the high of 1.3177. Trading volume of 50M looks active, but selling pressure from large orders is significant.
I speak based on on-chain data: this rally was driven by five new wallets accumulating a total of 18 million tokens, concentrated
PIEVERSE+22.03%
I had just switched the app to the background, and it shot right back up—are you playing hide-and-seek with me?

But don’t get me wrong, I’m watching the show from a short position. In that last glance before bed, I noticed that $IN ’s price action was quite subtle: trading volume kept shrinking, yet the price was still stubbornly holding up instead of falling. This kind of low-volume rebound is inherently suspicious. No volume means no conviction, and without conviction, don’t expect capital to carry you higher.

Sure enough, after today’s opening, the rebound was weak, with each upward push
post-image
IN-1.48%
BNB-1.63%
ETH-0.93%
Insiders are quietly fading silver above 66.34 while the 1h RSI sits at 50.33.

$XAG /USDT - SHORT

Trade Plan:
Entry: 66.28 – 66.40
SL: 66.91
TP1: 65.91
TP2: 65.63
TP3: 65.20

Why this setup?
Why now? The 4h bias favors a SHORT with 55% confidence, and the 1h ATR of 0.237301 tells us volatility is compressed enough for a clean move. The entry zone between 66.28 and 66.40 aligns with the 1h price at 66.34, giving a precise trigger for the short. TP1 at 65.91 and TP2 at 65.63 represent logical exhaustion points where range-bound sellers lose conviction. The daily trend being range confirms w
XAG+0.56%
A hand that set a stop-loss a few days ago trembled slightly; this morning I realized that was unnecessary filial piety😂. A few days ago before bed, $HYPE was still at that level. I checked it repeatedly, and the key level held while the critical position kept moving higher. This pattern is the most likely to produce a decent move. While everyone else was running, I instead felt that the opportunity had arrived.
Got in at 83.949; when I opened the chart this morning, it was at 85.274, +111.81%. Nailed it, brothers. Getting the rhythm right matters more than anything—the big bite of profit fee
post-image
HYPE-3.02%
LAB-2.73%
SNDK+0.33%
I originally wanted to cut my losses as a sacrifice to the heavens, but the ceremony never happened—the meat cooked itself. When the market plunged, I stared at the chart for a moment, then laughed. The bears had finally started moving to the rhythm they were supposed to, without disappointing anyone.

I had been watching this level for several days. Every rebound toward the upside was always just short of enough, and each rally was immediately knocked back to its original position. I placed a short order around 4474.29 as planned, without hesitating for too long, because opportunities often
post-image
LAB-2.73%
ETH-0.93%
I just casually hit refresh, and it went up on its own, leaving me in a very passive position😅
When I checked the chart after lunch, $PENDLE had pulled back to around 1.540. Buying support was clearly stronger than in the morning, and the market didn’t look like it was about to dump either. The key level held, which was reason enough, so I followed the move and added another long position.
Who would’ve thought that when I checked again in the evening, the price had already reached 2.225, and this position was showing +3158.38% in floating profit. This was a very satisfying bite of the meat💪
post-image
PENDLE+6.19%
SNDK+0.33%
ADA-1.12%
Load More

Join 40 M users in our growing community

⚡️ Join 40 M users in the crypto craze discussion

💬 Engage with your favorite top creators

👍 See what interests you

View More