
Square
Following
Hot
News
Notifications
Profile
Share your thoughts
placeholder
Article
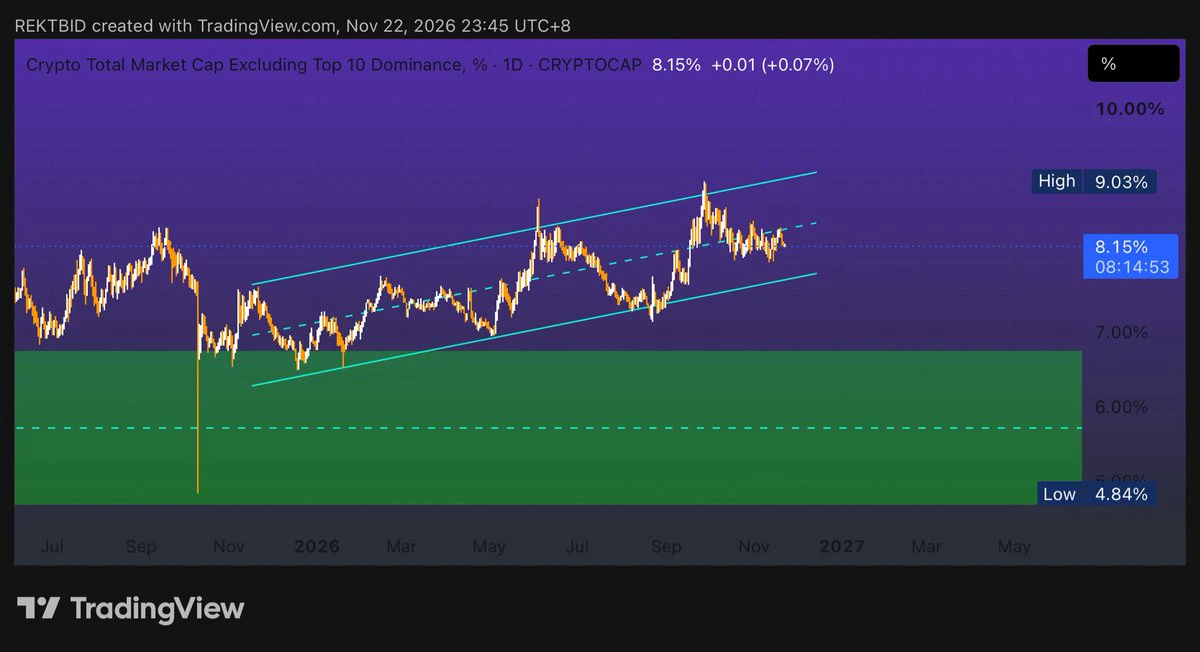
Altcoin dominance is weaken , imo dominance is gonna run the low. Stay safu and accumulate BTC only
post-image
BTC-0.67%
It all comes down to luck. When will I have the maturity of a veteran?#BTC反弹后再争6万美元关口
post-image
BTC-0.67%
Trenches
PIEVERSE
P
bade
b
PIEVERSE
0x0e...25a9
Market Cap
$
Change
.
24h Vol
$.
Holders
.
IDOL
I
bade
b
IDOL
0x3b...ab07
Market Cap
$.
Change
.
24h Vol
$.
Holders
.
JAGENT
J
bade
b
JAGENT
0x8e...ae15
Market Cap
$.
Change
.
24h Vol
$.
Holders
.
mihao
m
bade
b
mihao
4Cxj...pump
Market Cap
$.
Change
.
24h Vol
$.
Holders
.
Singularity
S
bade
b
Singularity
7R4M...pump
Market Cap
$.
Change
.
24h Vol
$.
Holders
.
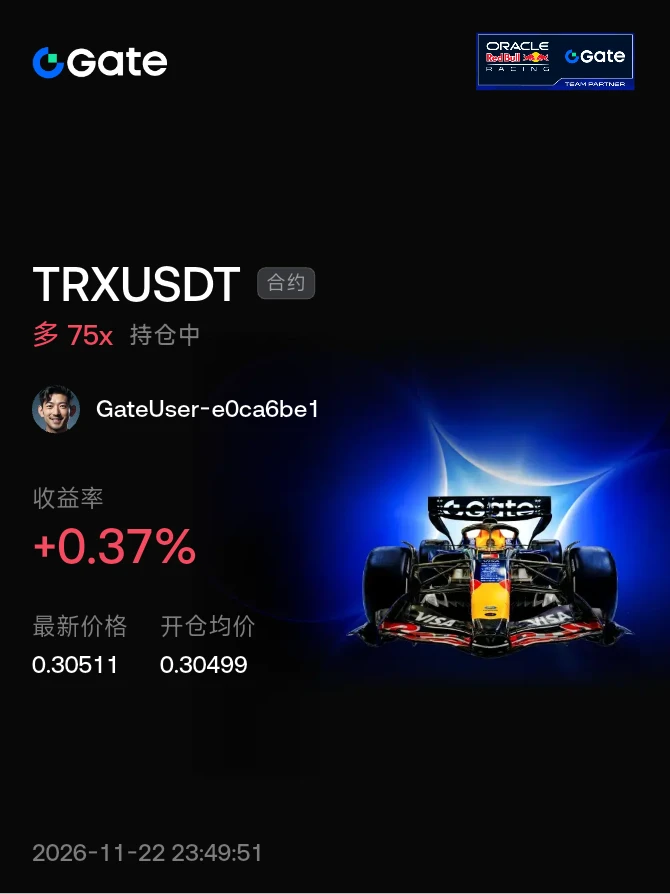
#晒出我的持仓收益 Didn't pay much attention at 0.1; at 0.3, I'm preparing to hold long-term
post-image
TRX+0.40%
Next Week in Crypto: A Dual Test of Data and Liquidity (November 23–29)
PCE and GDP on the same day—holiday liquidity declines—watch interest rates before crypto prices
I. The key issue this week is not whether the data are high or low, but how they combine
On November 25, the U.S. will release the October personal income and spending report as well as the second estimate of third-quarter GDP. PCE inflation data will determine the inflation outlook, while the revised GDP figure will shape growth expectations.

Three combinations correspond to different trading logic:

Cooling inflation, sta
BTC-5.94%
ETH-9.05%
NAS100-0.07%
  • 3
  • 2
(news stremer market update
live-cover
LIVE1,229
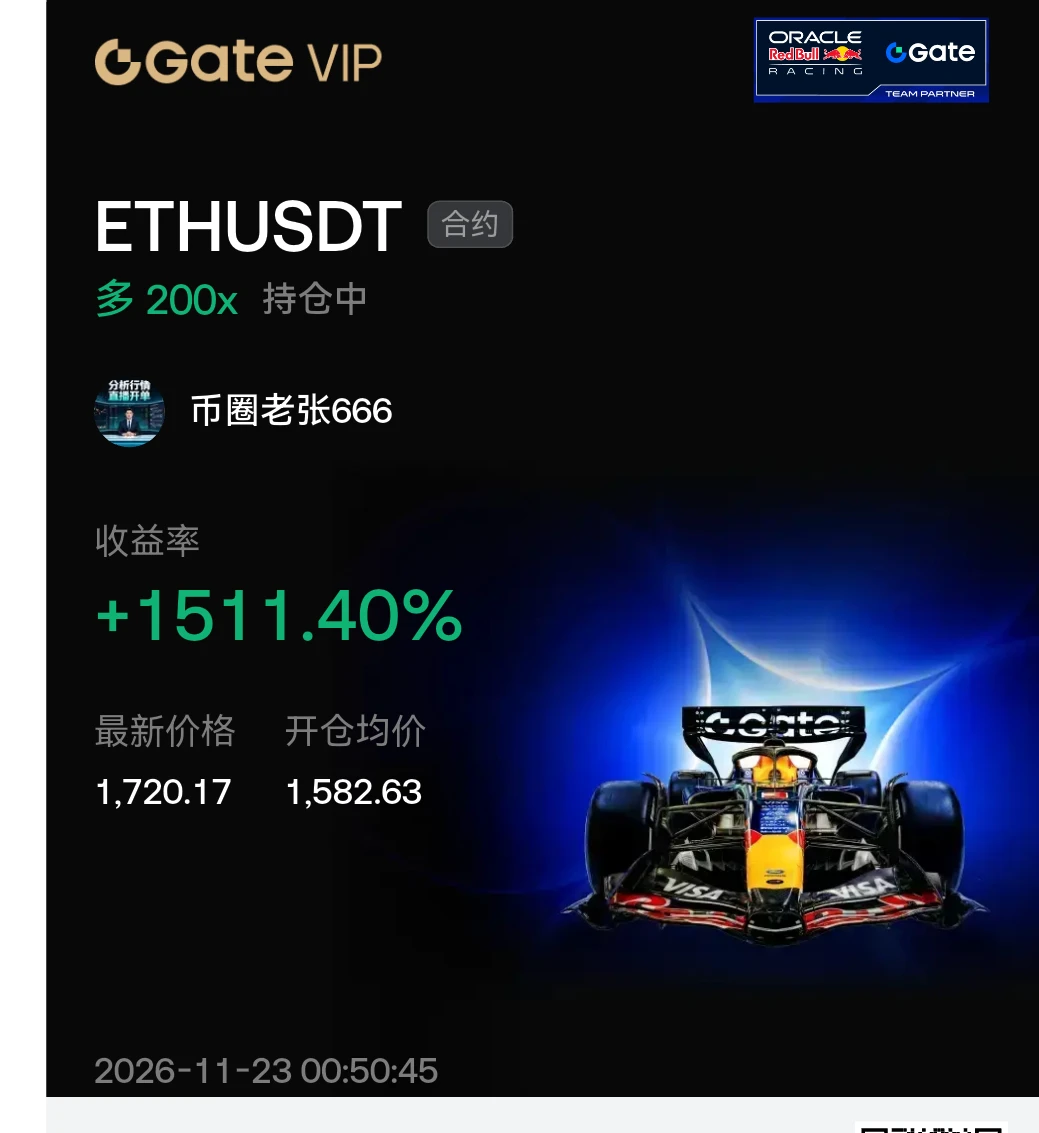
$ETH The current price is 1720.44, up 2.38% over 24 hours. However, while both the one-hour and four-hour timeframes show strength, their RSI readings differ significantly. The one-hour RSI is as high as 71.5, while the four-hour RSI is only 46.53, indicating strong short-term momentum that has not been matched in the medium term. Although the price touched short-term resistance at 1732.52, trading volume did not expand meaningfully, suggesting the breakout may be temporary and lack follow-through.
I’ll watch this level. If the price falls below support at 1648.35, this bullish move is invalid
post-image
ETH-1.26%
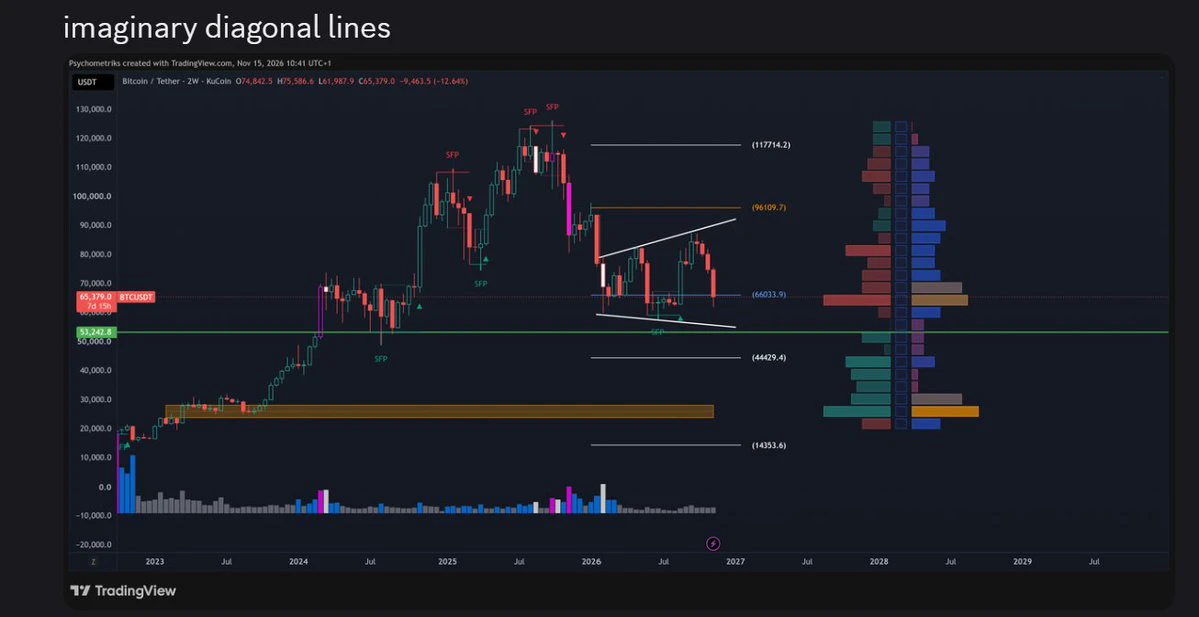
looks like #livermore megaphone getting pretty famous last days on X
$btc made simple 7 days ago
#bitcoin ain't your F friend
post-image
BTC-0.67%
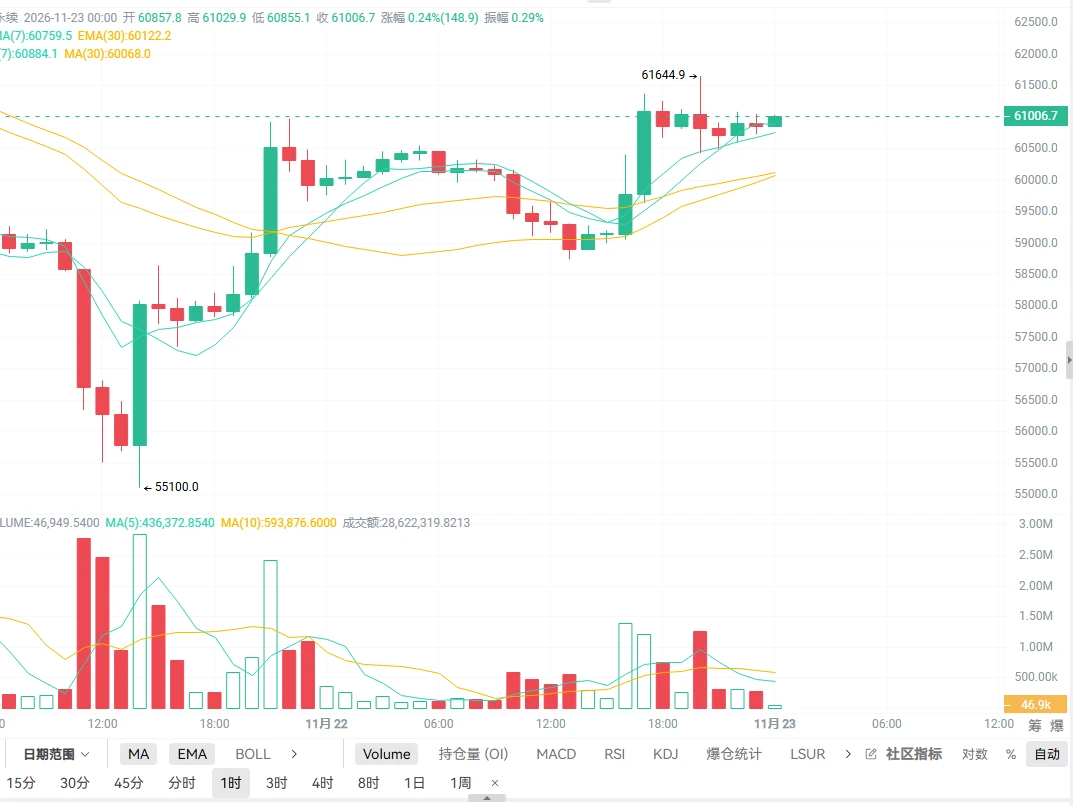
Yang Guang bit | November 23 $BTC Rebound runs into strong mid-term resistance; short with the trend as hawkish pressure weighs
【Today's Plan】
Entry: Price rebounds to the 61300–62000 range
Stop-loss: 62500
Take-profit targets:
First target: 60200–59700
Second target: 59000–58500
【Key Takeaway】
Fed officials are collectively hawkish. The October minutes showed that almost all officials considered further rate hikes appropriate in the coming months, with some not ruling out a single hike of more than 25bp. US stocks open at 22:30 tonight after switching to winter time, making this a key variabl
post-image
BTC-0.65%
  • 2
The unrealized profit on my $BR position at 0.40 is now over 4,000. Not much, but enough to assess the chart. Let’s compare it with another kind of price action we’ve seen recently.
In terms of gains, $BR rose from 0.3891 to a high of 0.4785, closed at 0.4611, and gained 15.30%. It climbed steadily, rather than exploding in a single vertical candle. Volume was 17.0M, in step with the price, with no heavy-volume stall. I can’t see the full picture of the holder distribution, but the range between the highs and lows is wide enough to suggest some turnover along the way—not a flat, locked move fr
BR+6.00%
  • 2
  • 1
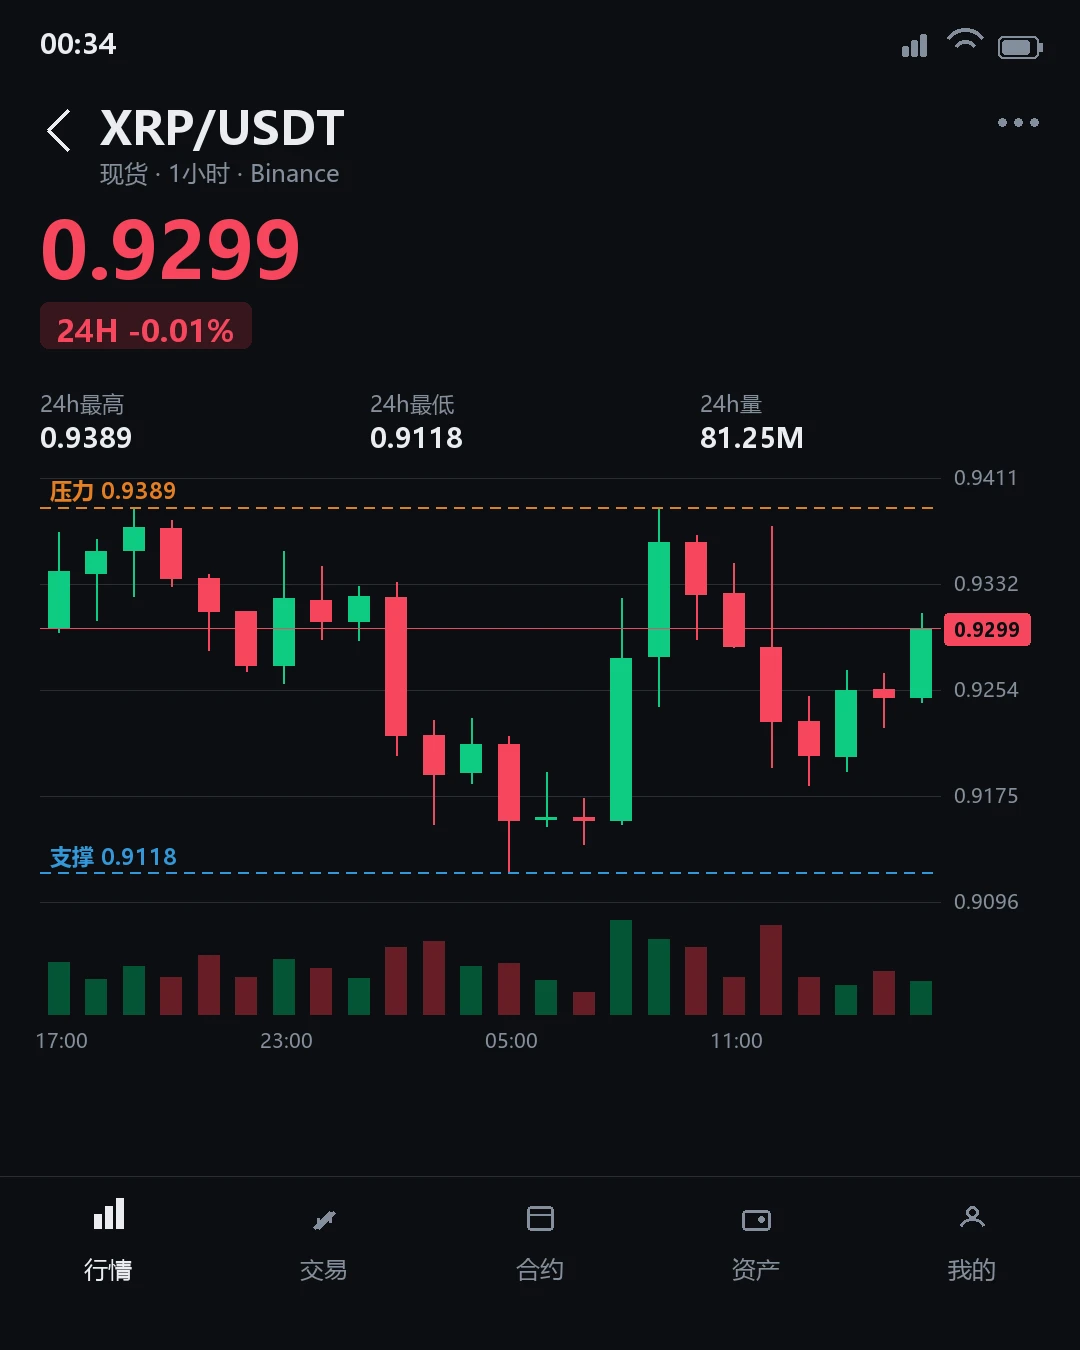
$XRP The current price is 0.9291, up 0.04% over the past 24 hours. However, the 1-hour timeframe looks strong, while the 4-hour timeframe looks weak, showing a clear divergence. The 1-hour RSI is 56.22, indicating short-term strength, while the 4-hour RSI is 44.16, indicating longer-term weakness. This conflict between timeframes can easily lead people to misread it as a trend reversal signal, when it may simply be short-term volatility.
I’d rather see this as direction not yet confirmed than rush to label it a rebound or pullback. The key thing to watch now is which timeframe changes directio
post-image
XRP-1.15%
Normally, nobody pays attention when I post. This time I’m swallowing my pride and asking for votes—don’t leave me on read again 😅 I’m on the leaderboard for Gate’s annual gala. Just visit the event page and give me a boost—it’s completely free. Afterward, you can use your boost points to enter a lottery, and you get to keep the prize if you win. Just click the link to do it, and maybe we’ll become friends.
https://www.gate.com/zh/competition/Annual-Gala?ref_type=165&ch=Direct&ref=UVdMV1w
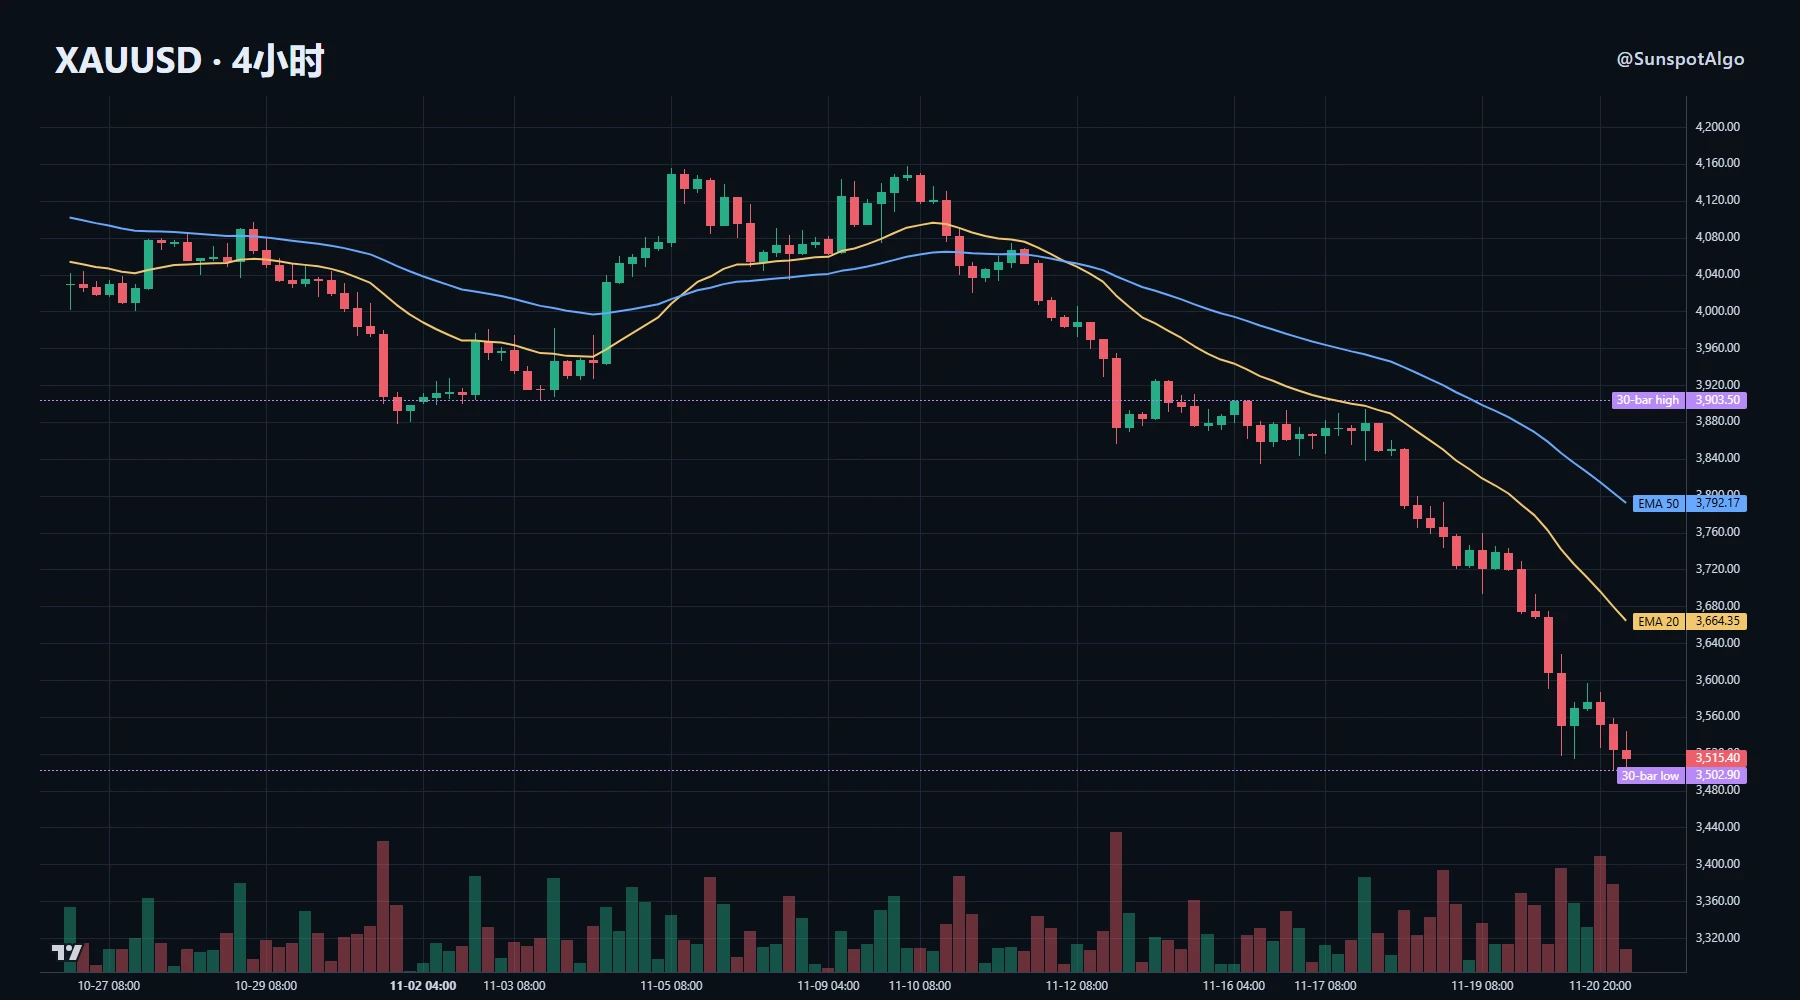
This week's action in gold can be divided into two phases, driven by completely different factors.

The first began in mid-November and was driven by interest rates. October inflation came in above expectations, the Fed turned sharply hawkish, and a December rate hike was almost fully priced in. The dollar strengthened and real yields rose, weighing on gold. This is a conventional macro-pricing response.

The second began after November 17, and the dynamics changed. The AI trade unwound, the Nasdaq fell more than 10% in a week, and the VIX surged to 35.89, up 26.2% in a single day. Liquidation
post-image
GLDX-0.40%
PAXG+0.37%
XAU+0.38%
NAS100-0.07%
XCU+0.20%
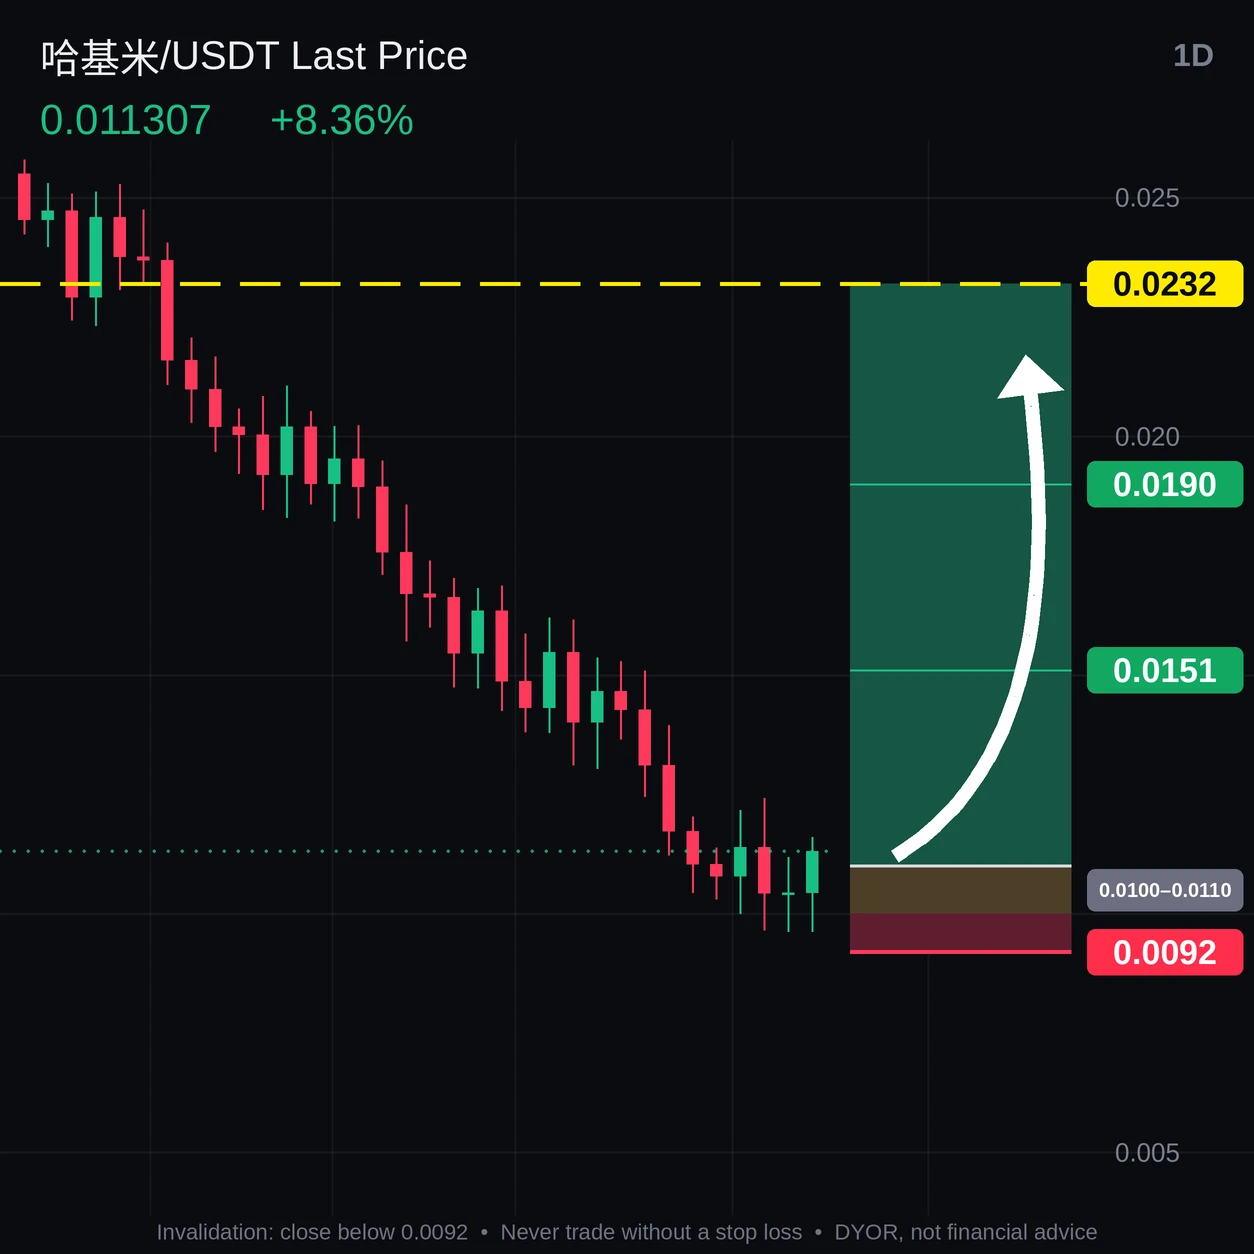
🟢 $Hakimi ‌ /USDT LONG

Entry: $0.0100 – $0.0110
SL: $0.0092
TP1: $0.0151
TP2: 0.0190
TP3: $0.0232

A daily close above $0.0115 would make the long considerably stronger.

⚠️ Invalidation zone: $0.0090 – $0.0097
post-image
哈基米-2.13%
  • 1
  • 1
#CookBacksFurtherRateHikes
📊 #CookBacksFurtherRateHikes

The discussion around further interest rate hikes is creating fresh uncertainty in the financial markets.

When central banks consider raising interest rates, investors often become more careful. Higher rates can put pressure on stocks, cryptocurrencies, and other risk assets.

For Bitcoin, this could mean more volatility and possible selling pressure. However, market direction will also depend on inflation, economic data, and investor confidence.

I believe traders should avoid emotional decisions and wait for clear market confirmatio
BTC-0.67%
XAU+0.38%
Hurry, get in—we’re about to hit the highway
post-image
BTC Live Market Breakdown | Is the $55K Bottom In Place, or More Dumping Ahead? | Safe Trading
live-cover
LIVE1,283
BTC-0.67%
Come on, pump it. I've been waiting for you for so long. If you don't pump the market soon, I'm going to bed
post-image
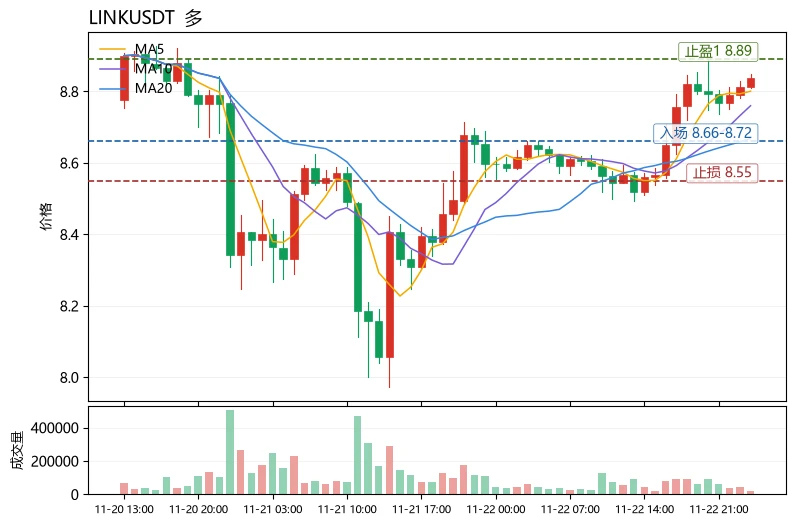
Can a bullish moving-average alignment alone justify chasing longs? Not necessarily; the key is the “health” of the trend.
Using $LINK as an example, here’s a reusable method for reading the chart: first, check the moving-average structure: MA5=8.80 has crossed above MA20=8.67, indicating an upward short- to medium-term trend—this is the prerequisite. Next, check momentum: the MACD histogram at +0.0188 remains bullish, but RSI=66.3 is nearing overbought territory, suggesting the rally is accelerating rather than just starting. Finally, check the price level: the current price of 8.837 is hugg
post-image
LINK-0.18%
TRUMP-0.95%
JUST IN: Bitcoin reclaims $61,000 and ETH reclaims $1,715
BTC-0.67%
ETH-1.26%
  • 1
#PCEAndGDPDataNextWeek #ShareWeekly

Financial markets are approaching another important macroeconomic event as the United States prepares to release a fresh batch of inflation and economic growth figures on November 25. This time, investors will receive several important indicators together, including October's Personal Consumption Expenditures (PCE) Price Index, the revised third-quarter GDP estimate, personal spending, and durable goods orders.

In my view, this combination deserves particular attention because inflation and economic growth can tell two very different stories about the US
post-image
Load More

Join 40 M users in our growing community

⚡️ Join 40 M users in the crypto craze discussion

💬 Engage with your favorite top creators

👍 See what interests you

Trending Topics

BTCReboundFaces60KTest

2.2M Views30.1K Discussing

BTC rebounded from around $55,300 on November 21, briefly reclaiming $60,000 before pulling back to around $59,300. The $60K level is back in focus as traders assess whether the recovery can last. Is this rebound a sign of stabilization or a short-lived recovery? Would reclaiming and holding $60K be enough, or do you need confirmation from trading volume and fund flows?

PCEAndGDPDataNextWeek

260.2K Views2.6K Discussing

GateDirectIPOPhase3ANTAllocates92100Shares

848.8K Views5.1K Discussing

View More